Mastering Traffic Pattern Analysis for Smarter Cities
We’ve all been there: stuck in bumper-to-bumper traffic, staring at an endless sea of red taillights, wondering why a city’s main arteries are so hopelessly clogged. That daily frustration isn’t just an inconvenience; it’s a complex puzzle cities worldwide are desperately trying to solve. The key to unlocking that puzzle? It’s called traffic pattern analysis, and it gives planners the data they need to build smoother, saner commutes.
Why Traffic Jams Happen and How Analysis Helps
Picture a huge retail store on Black Friday. If the manager doesn’t understand how shoppers move through the aisles, they might stick the most popular items in a tiny, narrow corner, creating a massive human bottleneck. The result is chaos, frustrated customers, and lost sales. The solution isn’t to just yell “move faster!”—it’s to analyze the foot traffic and redesign the store layout.
That’s exactly what traffic pattern analysis does for our cities. Instead of just reacting to gridlock after it happens, urban planners and engineers use this approach to study the entire transportation ecosystem. They’re digging for the root causes of delays, not just patching up the symptoms.
Uncovering the Real Causes of Congestion
Traffic is a massive global headache. From London to Paris to Rome, major cities are constantly fighting gridlock. In Los Angeles, for instance, drivers recently lost an average of 87 hours a year just sitting in traffic. That’s a staggering economic hit in lost time and wasted fuel. You can find more global road traffic statistics on ladingcargo.com that paint a pretty clear picture of why a deeper understanding of traffic behavior is so critical.
The analysis goes way beyond just counting cars on a road. It’s about asking the tough questions that lead to smarter, more effective solutions. Investigators typically focus on key areas like:
- Peak Hours: When do morning and evening rush hours really start and end?
- Bottleneck Locations: Which specific intersections, highway merges, or on-ramps are the consistent troublemakers?
- Traveler Behavior: What are the common origin and destination points? Seeing the bigger picture of how people move is crucial.
- Incident Impact: How do accidents, road construction, or big events ripple through the entire network?
From Data to Actionable Solutions
Once cities collect and interpret this data, they can finally shift from reactive problem-solving to proactive, intelligent infrastructure planning. It gives them a solid, evidence-based foundation to make critical decisions that actually work.
Think of traffic pattern analysis as a city’s diagnostic tool. It’s like a doctor running tests to find the source of an illness instead of just handing out painkillers for the symptoms. It identifies the underlying disease so the right treatment can be applied.
This data-driven approach lets planners test solutions virtually before spending millions on real-world changes. They can simulate the impact of retiming a series of traffic lights or adding a new bus lane. This ensures that improvements are targeted, effective, and truly benefit the entire community, paving the way for safer and more reliable transportation for everyone.
Building the Foundation for a Smart City

Real traffic pattern analysis is about so much more than just helping people avoid a morning traffic jam. It’s one of the most important pieces of the puzzle for building smarter, more liveable cities. When we look past simple traffic flow, we find the insights needed to make urban life better—from public safety all the way to environmental health.
Picture a city as a living, breathing organism. Its roads are the veins and arteries, and the traffic is its lifeblood. If that system gets clogged, everything starts to grind to a halt. By truly understanding the complex patterns of how people and goods move, city planners can stop just reacting to problems and start designing intelligent solutions before they’re even needed.
Enhancing Public Safety and Security
One of the biggest wins from traffic data comes in making our streets safer. By layering historical accident data over traffic volumes and speeds, planners can pinpoint high-risk intersections and dangerous stretches of road—often before another tragedy strikes. This gives them the power to make targeted, life-saving changes.
For instance, the data might show that a certain intersection has a spike in near-misses during evening rush hour, likely due to a combination of poor lighting and drivers making high-speed turns. Armed with that knowledge, the city can step in with practical fixes:
- Improved street lighting to make sure drivers and pedestrians can see each other clearly.
- Adjusted signal timing that adds a dedicated left-turn arrow, preventing conflicts.
- Redesigned crosswalks to create a safer, more obvious path for people on foot.
Emergency services see a massive benefit, too. Predictive analysis helps first responders find the quickest, most reliable routes to an incident, steering them around congestion as it forms in real-time. Shaving even a few minutes off response times can literally be the difference between life and death.
Driving Economic and Environmental Gains
The economic pulse of a city is directly linked to how well its transportation network runs. When delivery trucks are stuck in gridlock, supply chains slow down, and the cost of everything goes up. But when traffic flows smoothly, commerce thrives, from last-mile deliveries to the daily commute. This data also steers billion-dollar decisions on infrastructure, making sure that a new highway or public transit line is built where it will actually do the most good.
And let’s not forget the environmental upside. Every minute a car sits idling at a red light or creeping along in traffic, it’s just pumping needless emissions into the air.
Optimized traffic flow isn’t just about convenience; it’s a direct route to a greener city. By reducing congestion through smarter signal timing and better road design, we can significantly cut down on fuel consumption and city-wide carbon emissions.
This field has exploded to meet the demand. The global market for traffic data analytics recently topped $8.2 billion and is growing at an incredible 18% annually, mostly thanks to smart city projects. Modern systems now use sophisticated AI to pull out insights we could only dream of a decade ago. You can read more on how traffic data is fueling transportation optimization on dataterminal.co.
At the end of the day, traffic pattern analysis gives city leaders the tools to be more intelligent and proactive. It turns raw data about movement into a powerful asset for building safer, cleaner, and more economically robust communities for everyone who lives there.
How Experts Read the Roads
To really get a handle on a city’s traffic, you have to think like part detective, part fortune-teller. You’re not just looking at a line of cars; you’re seeing a massive, interconnected system of human habits, infrastructure limits, and even the weather. Unpacking all that messiness requires a few specific techniques to turn raw data into a clear story about how a city actually moves.
These methods are like different lenses, each giving you a unique angle on the same problem. By layering them, experts can go beyond just counting cars and start digging into the why behind the jam. That deeper insight is what leads to real solutions, whether it’s retiming a single traffic light or designing an entirely new highway.
Charting the Complete Journey
One of the most foundational techniques is the Origin-Destination (O-D) survey. Think of it like tracking a package from the warehouse clear to your front door. It’s not enough to see the truck on your street; you need to know where it started, where it’s going, and the entire path it took.
O-D analysis does the exact same thing for cars and commuters. It’s all about answering the big questions:
- Where are most people coming from during the morning rush?
- Which downtown spots draw the biggest crowds at night?
- Are commercial trucks taking weird, inefficient routes through quiet neighborhoods?
When you understand these complete journeys, you can spot the most critical travel corridors. For example, if data shows thousands of people commute from a specific suburb to a downtown business district every single day, that builds a rock-solid case for a new express bus route or even a rail line connecting those two points directly. This information usually comes from anonymized mobile phone location data, GPS trackers in fleet vehicles, and good old-fashioned roadside surveys.
The graphic below shows how these different methods come together to create a full picture.
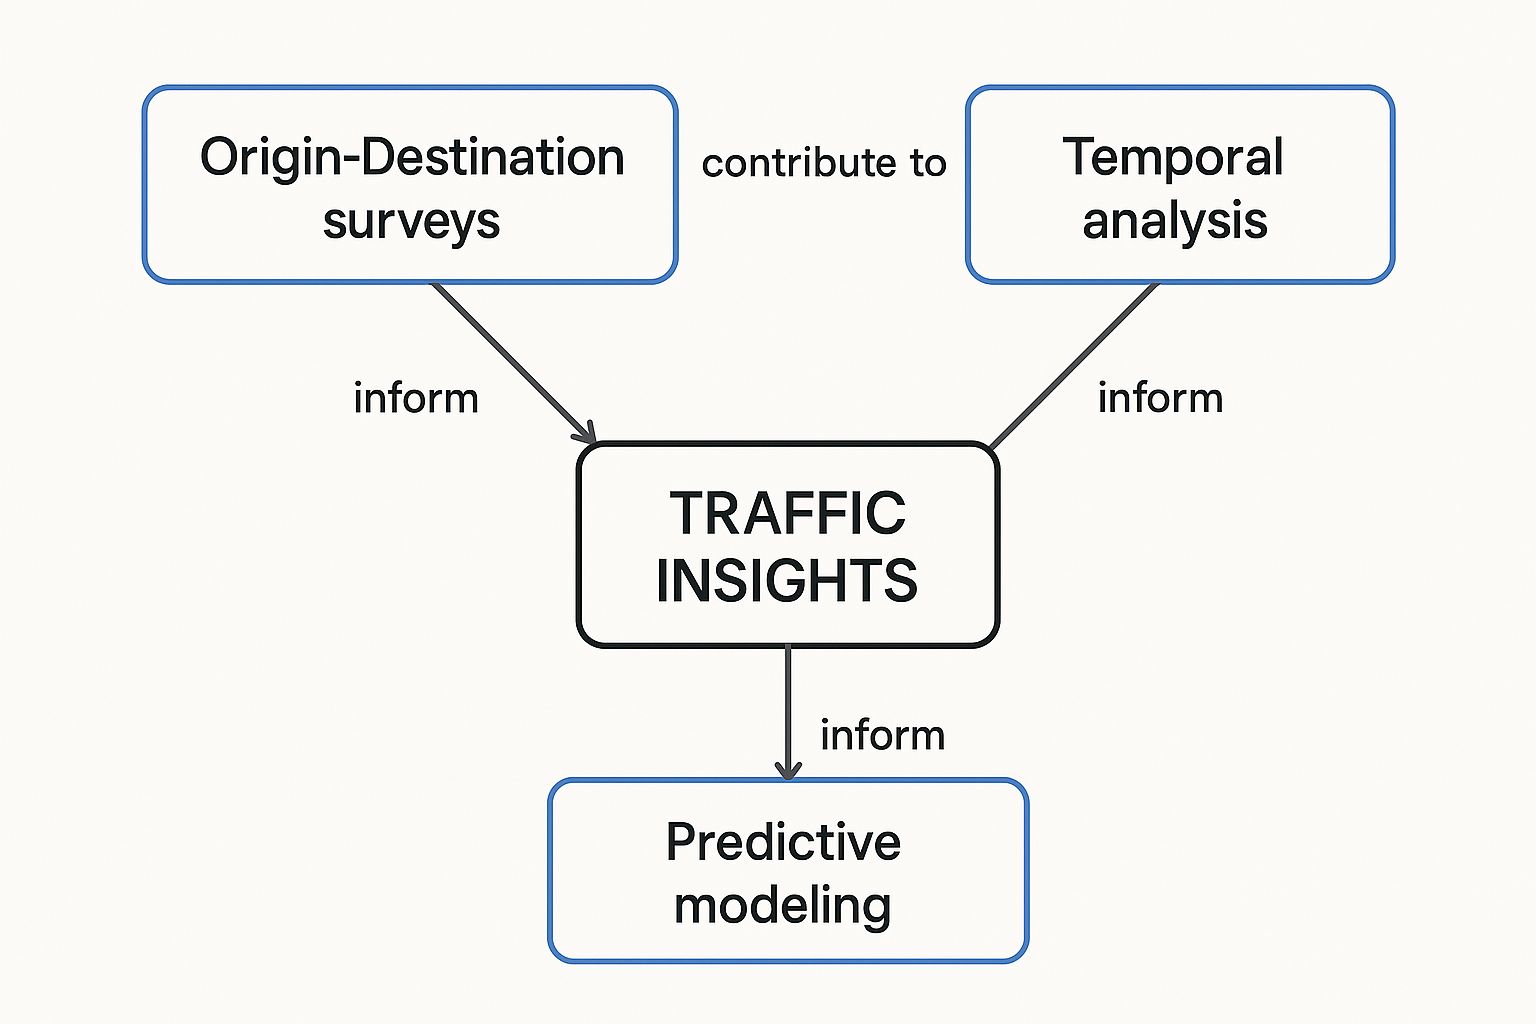
As you can see, techniques like O-D surveys, temporal analysis, and predictive modeling all feed into a central hub of actionable traffic insights.
Finding the Rhythm of the City
Next up is temporal analysis, which is all about timing. Every city has its own pulse—a daily, weekly, and even seasonal rhythm. Temporal analysis maps this out by looking at traffic volumes over different timeframes. It helps pinpoint not just that rush hour happens, but precisely when it kicks off, hits its peak, and finally dies down.
By analyzing traffic patterns hour-by-hour, experts can see how a Monday morning commute is totally different from a Friday afternoon getaway. This allows for dynamic solutions, like adaptive traffic signals that change their timing based on what’s happening on the road right now, not just a fixed schedule.
This approach is also great for revealing the impact of special events. A big concert or a football game can create traffic patterns that look nothing like a normal weekday. Understanding these one-off spikes is the key to managing them. This level of detail is a core part of learning how to analyze network traffic, as it brings patterns to light that you’d completely miss by only looking at daily averages.
Pinpointing Hotspots with Spatial Analysis
While temporal analysis is about the when, spatial analysis zeroes in on the where. This is like creating a heat map of a city’s road network, making the worst bottlenecks glow bright red. We’re talking about those chronic problem spots—the infuriating intersections, poorly designed on-ramps, and overloaded merges that cause the same delays, day in and day out.
For instance, a spatial analysis might reveal that a single, clumsy intersection is responsible for 40% of all traffic delays along a five-mile stretch of road. With that kind of precise data, engineers know exactly where to focus their energy and budget. The fix could be as simple as adding a new turn lane or as complex as building an overpass, but without spatial analysis, they’d just be guessing.
Predicting the Future of the Flow
Finally, we get to one of the most powerful tools in the box: predictive modeling. This technique uses historical data and machine learning to forecast what traffic will look like in the future. It’s not so different from how a meteorologist uses past weather patterns to tell you if you’ll need an umbrella tomorrow.
Predictive models can answer all sorts of “what-if” questions:
- What will the Tuesday morning commute look like if it’s pouring rain?
- How will that new office tower affect traffic on the surrounding streets?
- If a major highway closes for construction, which side roads are going to get slammed?
This ability to see around the corner is what allows cities to stop reacting to traffic jams and start preventing them. By anticipating problems before they happen, authorities can warn drivers, tweak signal timings, and get resources in place to keep everyone moving. It turns traffic pattern analysis from a backward-looking report card into a forward-looking game plan.
To bring it all together, here’s a quick look at how these techniques stack up against each other.
Comparing Traffic Analysis Techniques
This table breaks down the core traffic pattern analysis techniques, showing their main goal, the data they use, and a practical, real-world application for each one.
| Technique | Primary Goal | Common Data Sources | Practical Application |
|---|---|---|---|
| Origin-Destination (O-D) Survey | Understand the complete travel path of vehicles and people. | GPS data, mobile phone location data, roadside interviews. | Justifying a new public transit line between a popular suburb and a business district. |
| Temporal Analysis | Identify how traffic volumes change over time (hour, day, week). | Roadway sensors, traffic camera counts, historical data logs. | Implementing adaptive traffic signals that adjust timing for rush hour vs. off-peak hours. |
| Spatial Analysis | Pinpoint the exact physical locations of recurring congestion. | GIS data, accident reports, GPS-based bottleneck detection. | Redesigning a specific highway interchange known for causing daily backups. |
| Predictive Modeling | Forecast future traffic conditions based on historical patterns. | Historical traffic data, weather forecasts, event schedules. | Alerting drivers to use alternate routes an hour before a predicted traffic jam forms. |
Each of these methods provides a crucial piece of the puzzle. By combining them, planners and engineers can build a truly comprehensive understanding of a city’s traffic and make smarter, more effective decisions.
The Modern Toolkit for Traffic Analysis
Turning raw traffic data into clear, actionable intelligence isn’t a one-tool job. The modern analyst’s kit combines classic hardware with powerful new software to build a complete picture of how a city really moves. While old-school methods laid the groundwork, today’s tech gives us a level of detail and predictive power that was once pure science fiction.
The foundation often starts with physical sensors. You’ve probably driven over in-road loop detectors—those wires embedded in the pavement that register when a vehicle passes. They’re now complemented by traffic cameras that have evolved from simple counters into sophisticated AI-driven systems. These smart cameras can tell the difference between a car, a cyclist, and a pedestrian, feeding far richer data into safety and planning models.
The Rise of Advanced Data Sources
Beyond fixed hardware, traffic analysis now leans heavily on dynamic, widespread data sources. GPS tracking from fleet vehicles, delivery trucks, and even navigation apps gives us a real-time pulse of traffic flow across an entire metro area.
Newer tech like LiDAR (Light Detection and Ranging) is also being mounted on infrastructure to create incredibly precise 3D maps of intersections. This allows us to track vehicle movements with millimeter accuracy.
This flood of data has spurred the development of powerful software platforms designed to make sense of it all. Simulation software like PTV Vissim and Aimsun lets planners build virtual models of their cities. In these digital sandboxes, they can test the impact of a new bridge or a revised bus schedule without ever putting a single cone on a real street.
Simulating Reality with Traffic Mirroring
One of the most powerful tools to emerge is traffic mirroring and replay technology. Think of it as a flight simulator, but for an entire city’s transportation network.
These systems capture real, live traffic data and allow engineers to “replay” it in a safe, controlled test environment. This is where open-source tools like GoReplay really shine.
By replaying actual production traffic, engineers can subject new systems to the chaos and unpredictability of the real world—without any of the risk. It’s the ultimate stress test for ensuring system resilience and performance before a single user is affected.
This capability is a game-changer for validating major infrastructure changes. Imagine a city is about to open a new highway interchange. Instead of just hoping for the best on launch day, engineers can use a replay tool to simulate how thousands of real drivers would navigate the new layout. They can spot potential bottlenecks, tweak signal timing, and fix design flaws before they ever cause a real-world jam. The same approach is critical for testing disaster response plans, making sure emergency routes hold up under extreme conditions.
This visual from GoReplay’s site shows how it sits between live users and an application, silently recording interactions that can be used for incredibly robust testing.
You can explore a variety of network traffic analysis tools in our detailed guide to see how different platforms tackle this challenge.
Integrating Tools for a Complete View
No single tool holds all the answers. The real power comes from integration. Data might be collected by roadside LiDAR units, fed into a simulation platform like PTV Vissim for modeling, and then validated using a replay tool like GoReplay to test the system’s software under realistic load.
This multi-faceted approach ensures that decisions are based on a complete and accurate understanding of traffic behavior. By combining hardware sensors, advanced data sources, and sophisticated simulation software, today’s analysts can move from just observing traffic to actively shaping it for a safer, more efficient future. The ability to safely test and validate changes is what turns a good idea into a successful real-world solution.
Putting Traffic Analysis into Action
All this data is great, but turning it into real-world improvements is where traffic pattern analysis truly shines. Moving from theory to practice isn’t magic; it requires a structured approach. Without a clear roadmap, teams can easily get lost in the data, and projects lose focus.
Think of it like building a house. You wouldn’t just start laying bricks and hope for the best. You start with a detailed blueprint. For traffic analysis, that blueprint is a four-stage process that guides you from a simple question to a measurable solution.
Step 1: Define Clear Objectives
First things first: you have to know what you’re trying to achieve. A vague goal like “improve traffic” is a dead end because you can’t measure it. Your objectives need to be specific, measurable, achievable, relevant, and time-bound (SMART).
A solid objective is your north star. For instance, instead of that fuzzy goal, a city planner might aim to: “Reduce morning commute times along Main Street by 10% within six months.” That clarity instantly tells you what data you need and which techniques will get you there.
Step 2: Collect the Right Data
Once you know your goal, it’s time to gather the evidence. The tools and sources you choose must directly map back to your objective. If you’re trying to improve pedestrian safety at a busy intersection, vehicle counts alone won’t cut it.
Your data collection strategy might need a mix of sources:
- Video Analytics: To see how pedestrians actually cross and spot near-misses.
- Sensor Data: To measure how fast cars are approaching the intersection.
- Manual Observation: To catch real driver behaviors, like illegal turns or failing to yield.
Picking the wrong data is a classic mistake that can sink a project before it even starts. The key is to gather information that specifically answers the question your objective is asking.
Step 3: Analyze and Uncover Insights
This is where the real detective work begins. Using the data you’ve collected, you’ll apply techniques like spatial and temporal analysis to dig into the root causes of the problem.
Let’s go back to our Main Street example. Your analysis might reveal that the biggest delays are happening between 7:45 AM and 8:15 AM. Why? Because a poorly timed traffic light near a highway on-ramp is causing a massive bottleneck. This is the kind of insight that turns raw numbers into a clear, actionable story.
The goal of analysis isn’t just to find patterns; it’s to find the leverage points within the system. These are the specific, targeted areas where a small change can produce a significant, positive impact on the entire network.
Step 4: Implement and Monitor Feedback
Now it’s time to act on your insights and, just as importantly, see if they worked. Based on the analysis, the city might adjust the traffic light timing on Main Street or even redesign the on-ramp. But you’re not done yet.
After making a change, you have to go back to Step 2 and collect new data. Did commute times actually drop by 10%? This cycle of implementation and monitoring is crucial. It ensures your solutions are effective and lets you fine-tune them over time. This proactive approach is a big reason the global traffic flow systems market is now estimated to be worth $15 billion. You can read more research on the growing traffic systems market to understand its drivers.
By sticking to this structured process, you can sidestep common traps like using bad data or letting one-off events skew your results. A methodical approach ensures every traffic pattern analysis project moves from a well-defined problem to a validated solution that makes a real difference.
Where All This Is Headed
Today’s traffic pattern analysis isn’t just about fixing the bottlenecks we have now; it’s about laying the groundwork for a completely different kind of city. The insights we’re gathering are literally building the foundation for a future where traffic flows with an intelligence that feels like science fiction. This isn’t a distant dream—it’s being actively shaped by a handful of interconnected technologies that are set to redefine how we all get around.
Leading the charge are autonomous vehicles (AVs). When cars drive themselves, they can also talk to each other and to the city’s infrastructure in a constant, high-speed dialogue. This is what the industry calls Vehicle-to-Everything (V2X) communication.
Self-Optimizing Traffic Grids
Think about what this really means. Imagine cars approaching an intersection and coordinating their movements so perfectly that they flow through without ever needing a red light. It would look like a synchronized dance, and it would practically eliminate the traffic jams caused by simple human hesitation and error. V2X technology lets the entire grid act like a single, cooperative organism instead of a million individual drivers all competing for the same patch of asphalt.
That’s when we get to the next big leap: self-optimizing traffic grids powered by AI and machine learning. These systems will act like a city’s central nervous system, constantly taking in real-time data from countless sources—every vehicle, every road sensor, even weather reports.
If a minor fender-bender happens, the AI won’t just log a slowdown. It will instantly predict the ripple effect that accident will have across the network and start rerouting other vehicles before a jam even gets a chance to form. It will adjust signal timings on the fly to handle the disruption, keeping the entire system fluid and efficient.
This kind of proactive management is a world away from the reactive fixes we use today. It’s a fundamental shift from trying to ease congestion to preventing it from ever happening in the first place.
Perfecting the Future with Digital Twins
So, how do you test a system this complex without unleashing total chaos on actual city streets? The answer is something called a digital twin. A digital twin is exactly what it sounds like: a perfect, virtual replica of a city’s entire transportation network, running in a sophisticated simulation.
It’s the ultimate sandbox. Inside this digital world, city planners can get radical and test huge ideas with zero risk:
- AV Integration: They can drop thousands of autonomous vehicles into the simulation to see how they interact with existing human-driven traffic.
- New Infrastructure Modeling: Planners can see exactly how a new light rail line or bridge would change travel patterns across the entire city, long before a single shovel ever hits the ground.
- Emergency Preparedness: They can run disaster scenarios, like a city-wide evacuation, to find the flaws in their emergency plans and perfect them.
The traffic pattern analysis we’re doing right now is what fuels these digital twins. It provides the incredibly rich, detailed data needed to make these virtual worlds accurate reflections of reality. By truly understanding how our cities move today, we’re drawing up the blueprints for the smarter, more efficient, and far more livable cities of tomorrow.
Common Questions About Traffic Pattern Analysis
Jumping into traffic pattern analysis always brings up a few key questions. As more businesses and cities lean on this data, it’s good to get a handle on the basics—what it’s for, how it works, and what it means for you.
Let’s clear up some of the most common curiosities. Getting these fundamentals right helps you see how raw data about movement turns into smarter, safer, and more efficient systems for everyone.
What Is the Primary Goal Here?
At its core, the goal is to figure out exactly how, when, and where people and goods move through a system. It’s not just about counting cars; it’s about decoding the real-world behaviors and patterns that drive movement.
This insight gives city planners, engineers, and logistics experts the power to make decisions based on solid data. The endgame is to improve public safety, cut down on frustrating congestion, and make the whole network run more smoothly.
How Is My Privacy Protected?
This is a big one, and modern traffic analysis is built with privacy front and center. The focus is almost always on aggregated and anonymized data, never on the movements of a specific person.
Information from sources like GPS navigation or mobile apps gets stripped of all personal identifiers long before it’s ever analyzed. The analysis looks at broad trends, like the total volume of vehicles traveling between two neighborhoods during rush hour.
By focusing on the collective “what” and “where” instead of the individual “who,” traffic analysis delivers powerful insights while sticking to strict privacy standards. It’s about understanding the forest, not tracking individual trees.
Can This Really Predict Traffic Jams?
Yes, and with surprising accuracy. By feeding historical data into AI-powered predictive models, systems can forecast traffic conditions with a high degree of confidence. These models look at everything—time of day, weather, holidays, and even special events like concerts or games.
This predictive power opens the door to proactive traffic management. For instance, authorities can adjust traffic light timing along a route before it gets slammed with cars or send alerts to drivers suggesting other routes long before a jam even forms. It’s a shift from reacting to gridlock to preventing it in the first place.
Ready to eliminate risks and validate system performance with real-world traffic? GoReplay provides the tools to capture and replay live production traffic, ensuring your updates are robust and reliable before they go live. Learn more and get started for free at goreplay.org.