Top 7 Network Traffic Analysis Tools for 2025
In an increasingly interconnected infrastructure, understanding the flow of data across your network is no longer a reactive task-it’s the cornerstone of performance, security, and stability. From pinpointing elusive application bottlenecks to detecting anomalous behavior that could signal a security breach, granular network insight is critical. Without it, IT teams, developers, and DevOps professionals are essentially flying blind, unable to diagnose issues before they impact end-users or escalate into major outages. The right network traffic analysis tools transform raw data packets into actionable intelligence, providing a clear map of who is talking to whom, what they are saying, and how much bandwidth they are consuming.
This comprehensive guide moves beyond generic feature lists to deliver a practical comparison of the industry’s leading solutions. We’ll explore seven powerful tools, from open-source packet sniffers to enterprise-grade flow analyzers, each with its unique strengths. Our goal is to help you cut through the noise and identify the platform that best fits your specific environment, technical requirements, and budget. Whether you need to troubleshoot performance for a critical application, bolster your security posture, or plan for future network capacity, this article will equip you with the necessary details.
For each tool reviewed, you will find:
- A detailed breakdown of its core capabilities and ideal use cases.
- Actionable pros and cons to simplify your evaluation process.
- Direct links and illustrative screenshots to see the platform in action.
We’ve structured this roundup to be direct and to the point, enabling you to quickly compare options like SolarWinds, Wireshark, Auvik, and others to make an informed decision for your organization. Let’s dive in.
1. GoReplay
GoReplay stands out as a powerful, open-source network traffic analysis tool specifically engineered for capturing and replaying live HTTP traffic. Its core strength lies in transforming real production user interactions into actionable tests, enabling development, QA, and DevOps teams to validate system changes under authentic conditions. By mirroring production traffic with exceptional accuracy, it eliminates the guesswork often associated with synthetic testing, ensuring new deployments are robust and performant.
Trusted by over 100 enterprise teams and boasting an impressive 18,000+ stars on GitHub, GoReplay has cemented its reputation as a reliable solution for continuous testing and infrastructure validation. It provides a definitive way to answer the critical question: “How will our system behave under a real production load?” before a single line of new code goes live.

Key Features and Capabilities
GoReplay distinguishes itself from other network traffic analysis tools with a feature set focused on realistic simulation and deep performance insights. It moves beyond simple packet capture to offer context-aware traffic replication.
- Session-Aware Traffic Replay: Unlike basic replay tools, GoReplay understands user sessions. It intelligently groups requests from the same user, maintaining state and replaying interactions in their original sequence. This is crucial for accurately testing applications with complex user workflows, such as e-commerce checkouts or multi-step forms.
- High-Fidelity Load Testing: By using a copy of your actual production traffic, you can generate load tests that precisely mimic real-world usage patterns, including traffic spikes and complex request distributions. This approach provides a far more accurate measure of application resilience and scalability compared to simulated scripts.
- Detailed Monitoring and Analytics: The platform provides real-time visibility into application performance during replay. You can monitor key metrics, detect performance anomalies, and receive proactive alerts, allowing you to identify and resolve bottlenecks before they impact end-users. For a deeper understanding of monitoring techniques, explore GoReplay’s guide to API monitoring essentials.
- Enterprise-Grade Enhancements (Pro Version): For organizations with advanced requirements, the Pro version offers features like traffic storage for later use, data masking to protect sensitive user information, and priority support from GoReplay experts.
Ideal Use Cases and Practical Application
GoReplay is exceptionally versatile, but it truly excels in scenarios where system stability and performance are non-negotiable.
Success Story Spotlight: Companies like ResDiary and PagesJaunes have leveraged GoReplay to execute seamless infrastructure migrations and validate system stability with zero downtime. By replaying production traffic against new environments, they could confidently verify performance and functionality before making the final switch.
Common implementations include:
- Pre-Deployment Validation: Replay production traffic against a staging environment to catch bugs, performance regressions, and breaking changes before they are deployed.
- Infrastructure Migration: Safely migrate to a new cloud provider, data center, or architecture by validating the new setup with real traffic.
- Performance Benchmarking: Objectively compare the performance of two application versions or infrastructure configurations using identical, real-world traffic loads.
Getting Started and Platform Access
GoReplay is available in two tiers: a powerful, free open-source version and a commercially licensed Pro version. The open-source tool is accessible directly from the GoReplay website and its GitHub repository, making it easy for any developer or team to get started. Setting it up involves a command-line interface, so some familiarity with shell commands is beneficial. The Pro version, which includes advanced features and dedicated support, is available through enterprise licensing.
Pros & Cons
| Pros | Cons |
|---|---|
| Captures and replays live HTTP traffic with high fidelity, ensuring realistic test scenarios. | Enterprise-grade features and priority support are exclusive to the paid Pro version. |
| Enables accurate load testing using real-world traffic patterns, improving application resilience. | Optimal use of advanced features requires some familiarity with command-line tools. |
| Offers extensive monitoring and real-time analytics for proactive issue detection. | |
| Backed by a large open-source community and trusted by major enterprises. | |
| Pro version adds crucial features like data masking and traffic storage for enterprise needs. |
2. SolarWinds NetFlow Traffic Analyzer (NTA)
SolarWinds NetFlow Traffic Analyzer (NTA) stands out as one of the most comprehensive network traffic analysis tools available, transforming complex flow data into easy-to-understand charts and tables. It excels at collecting, correlating, and analyzing traffic data from a wide range of flow protocols, including NetFlow, J-Flow, sFlow, NetStream, and IPFIX. This allows network administrators to see exactly which users, applications, and protocols are consuming the most bandwidth.
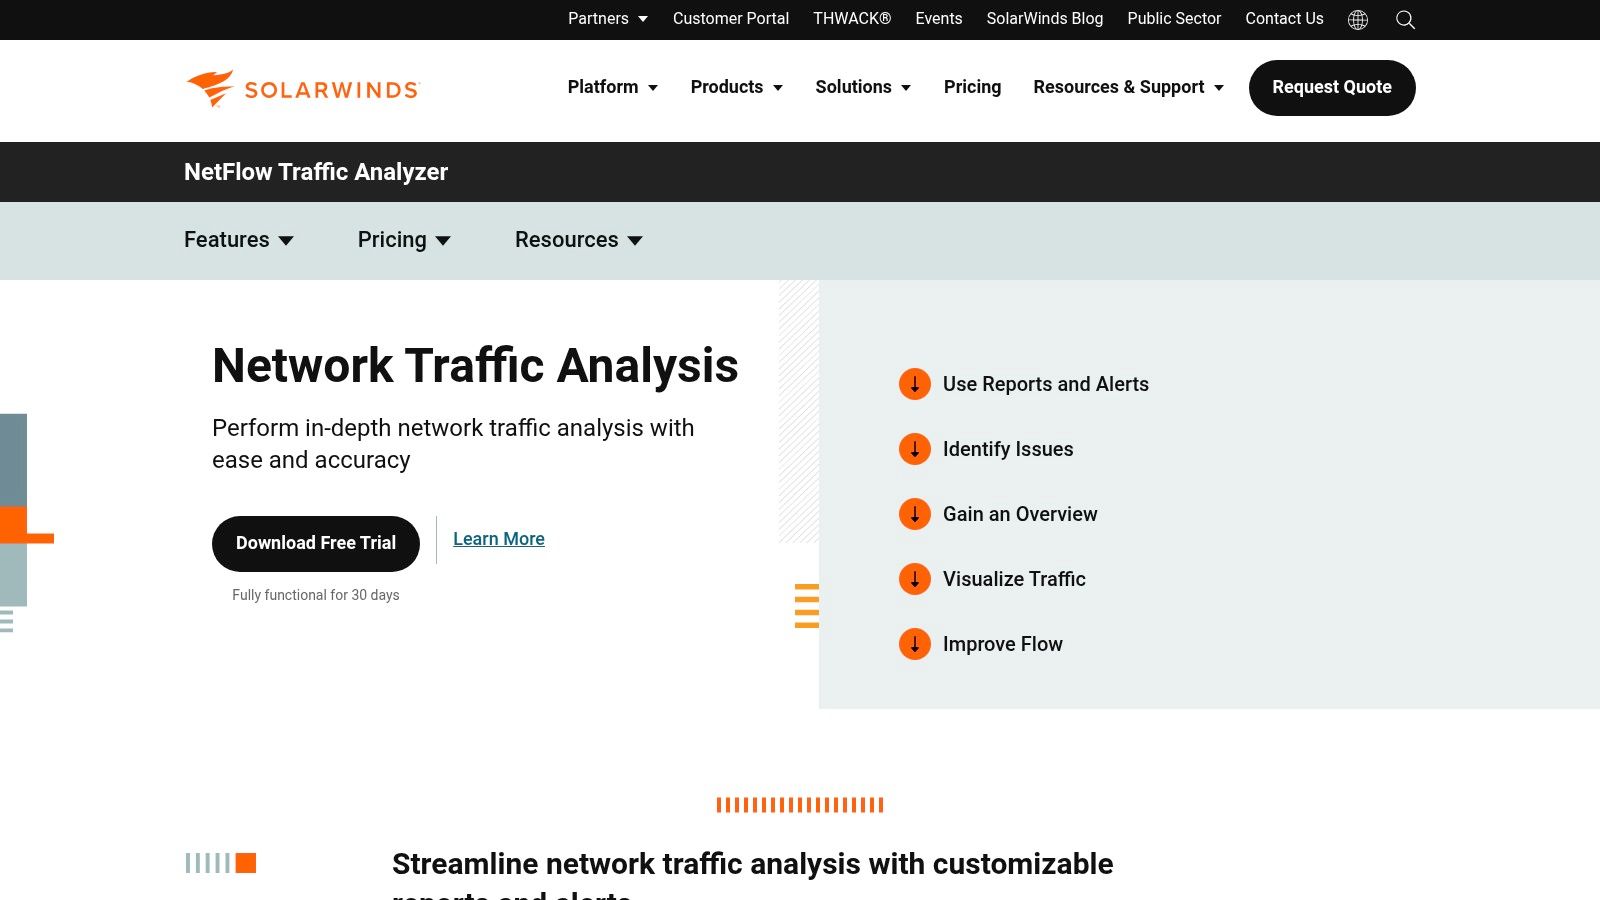
The platform is renowned for its user-friendly, web-based interface that provides deep visibility into network traffic patterns. You can drill down into specific traffic segments, view conversation data between specific IP addresses, and identify potential network bottlenecks or security anomalies in near real-time. This level of detail helps teams proactively manage network performance rather than reactively troubleshooting issues.
Key Features and Capabilities
SolarWinds NTA offers a robust feature set designed for in-depth analysis. Its ability to integrate with the broader SolarWinds Orion Platform makes it a powerful, unified monitoring solution.
- Bandwidth Monitoring: Identify top talkers and applications consuming network bandwidth. You can track traffic arriving from designated ports, source IPs, destination IPs, and even specific protocols.
- Multi-Vendor Support: NTA isn’t locked into a single ecosystem. It seamlessly collects and analyzes flow data from devices manufactured by Cisco, Juniper, Huawei, Extreme, and many others.
- Customizable Dashboards and Alerts: Create personalized views that highlight the metrics most important to your organization. Set up intelligent alerts that trigger based on specific thresholds, such as unusual spikes in traffic from a particular application, helping you detect issues before they impact end-users.
- Security Analysis: By analyzing flow data, NTA can help identify malicious or suspicious activity, such as traffic from unauthorized ports or communication with known bad actors.
Expert Insight: A key requirement for using NTA is its integration with SolarWinds Network Performance Monitor (NPM). NTA acts as an add-on module to NPM, leveraging NPM’s node details and device polling to provide a complete picture of network health. While this adds to the overall cost, the combined functionality provides unparalleled insights that standalone tools often miss.
Practical Use Case: Throttling a Bandwidth Hog
Imagine an employee is unknowingly running a peer-to-peer file-sharing application, consuming a significant portion of the company’s internet bandwidth and slowing down critical business applications.
- Detection: Using the NTA dashboard, you notice an unusual spike in bandwidth usage.
- Investigation: You drill down into the “Top 10 Applications” view and identify the file-sharing application as the culprit.
- Identification: By clicking on the application, NTA shows you the specific user endpoint (IP address) responsible for the traffic.
- Action: With this information, you can contact the user, address the policy violation, or implement a QoS policy to throttle the non-essential application traffic, restoring performance for everyone.
Pricing and Access
SolarWinds NTA is a commercial product with pricing based on the license level of the required SolarWinds NPM. Pricing is not publicly listed and requires a custom quote based on the number of monitored elements (nodes, interfaces, etc.). While it represents a significant investment compared to open-source alternatives, its scalability and deep feature set provide substantial value for medium to large enterprises. A fully functional 30-day free trial is available for evaluation.
Learn More: SolarWinds NetFlow Traffic Analyzer
3. Auvik
Auvik delivers a cloud-based approach to network management, making it one of the more modern and accessible network traffic analysis tools on the market. Its powerful TrafficInsights feature leverages NetFlow, J-Flow, and IPFIX to provide deep visibility into traffic patterns across your network. By collecting and analyzing this flow data, Auvik helps IT teams understand who is on their network, what they are doing, and where their traffic is going, all without requiring on-premises hardware.
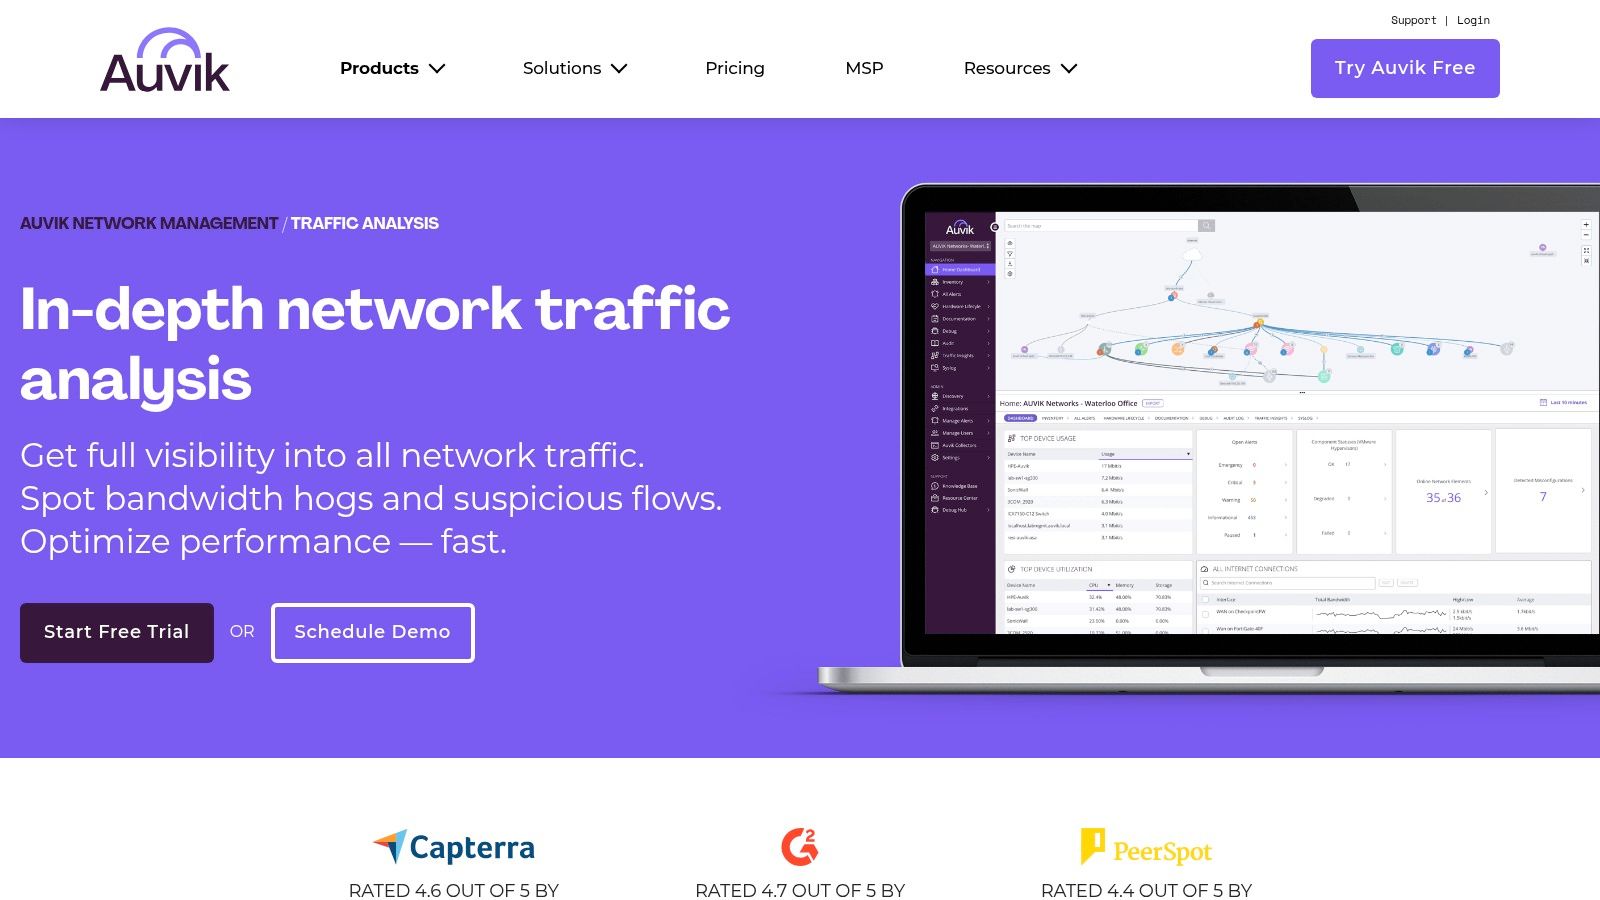
The platform is particularly known for its automated network discovery and mapping, which provides an always-up-to-date topology diagram. This visual context, combined with its traffic analysis capabilities, allows administrators to quickly pinpoint sources of congestion or unusual behavior. Its cloud-native architecture makes it highly scalable, catering to everyone from small businesses to large enterprises and Managed Service Providers (MSPs) looking for a multi-tenant solution.
Key Features and Capabilities
Auvik’s TrafficInsights is designed to make complex traffic data simple to interpret and act upon. The focus is on providing actionable intelligence through a clean, intuitive interface.
- Cloud-Based Traffic Analysis: Deploys quickly without the need for dedicated servers. It securely collects flow data from your network devices and presents the analysis in a centralized, web-based dashboard accessible from anywhere.
- Application and Service Identification: Automatically identifies the applications and services consuming the most bandwidth. You can see traffic broken down by source/destination IP, conversations, and protocols.
- Automated Network Mapping: Auvik automatically discovers network devices and builds a real-time Layer 2 topology map. When investigating a traffic issue, you can see exactly where the problematic device is located on the network.
- Multi-Vendor Device Support: It supports a wide range of network hardware, collecting flow data from manufacturers like Cisco, Juniper, Fortinet, and more, ensuring comprehensive coverage.
Expert Insight: Auvik’s key differentiator is its blend of simplicity and power, especially for MSPs. The multi-tenant dashboard allows service providers to manage multiple client networks from a single pane of glass. Its automated discovery and documentation features dramatically reduce the manual effort required to onboard and manage new clients.
Practical Use Case: Identifying Unapproved Cloud Application Usage
An organization has a strict policy against using unsanctioned cloud storage services to prevent data leaks. Auvik can help enforce this policy.
- Detection: From the TrafficInsights dashboard, you sort traffic by application and notice significant data flows to a non-standard cloud service, like a personal file-hosting site.
- Investigation: Clicking on the application reveals a list of all internal IP addresses communicating with the service’s external IPs.
- Identification: You identify the top talkers, pinpointing the specific workstations and users who are violating the company’s acceptable use policy.
- Action: Armed with this data, you can approach the users, re-educate them on the policy, and block the unauthorized service at the firewall to prevent future occurrences, securing company data.
Pricing and Access
Auvik uses a quote-based pricing model that depends on the number of billable devices (like routers, switches, and firewalls) being monitored. It offers different tiers, “Essentials” and “Performance,” with TrafficInsights included in the Performance tier. While pricing is not public, its cloud-based nature eliminates hardware and maintenance costs associated with on-premises solutions. A free 14-day trial is available for evaluation.
Learn More: Auvik Network Traffic Analysis Software
4. ManageEngine NetFlow Analyzer
ManageEngine NetFlow Analyzer is another powerful, web-based platform that stands as a top contender among network traffic analysis tools. It specializes in collecting, analyzing, and reporting on what your network bandwidth is being used for and by whom. By harnessing leading flow technologies like NetFlow, sFlow, J-Flow, IPFIX, and AppFlow, it provides deep visibility into traffic patterns, making it an essential tool for optimizing network performance across multi-vendor environments.
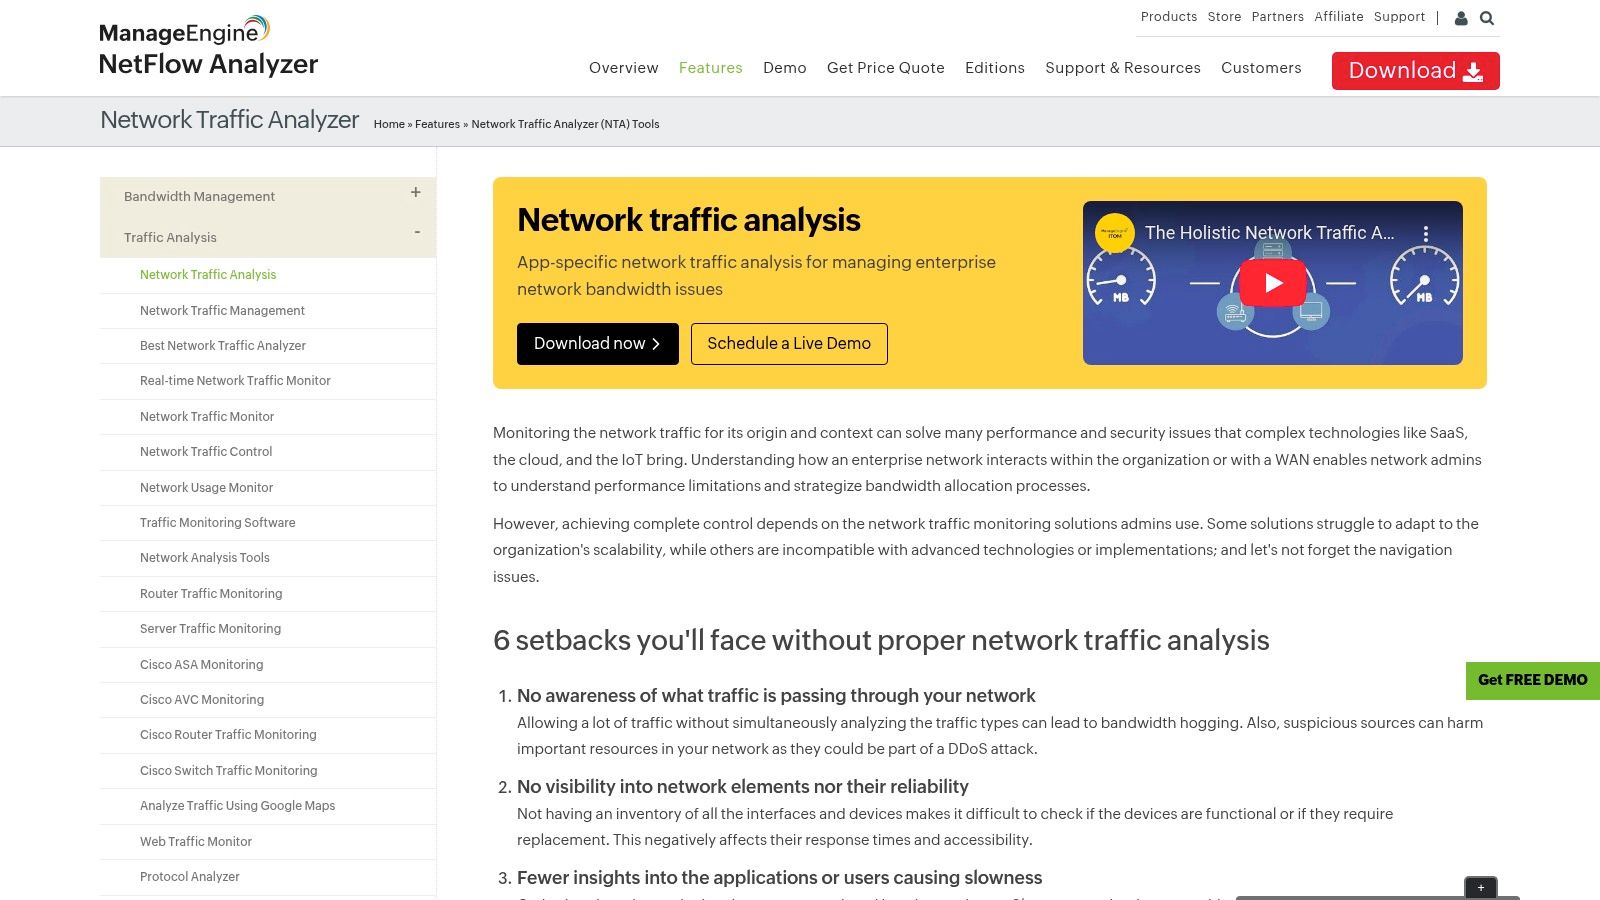
The platform is recognized for its comprehensive, yet user-friendly interface that allows IT professionals to move from a high-level overview of network traffic to granular, conversation-level details in just a few clicks. This real-time visibility helps teams proactively identify bandwidth hogs, troubleshoot slowdowns, and enforce security policies. ManageEngine focuses on presenting complex data in an actionable format, empowering teams to make informed decisions quickly.
Key Features and Capabilities
ManageEngine NetFlow Analyzer delivers a robust suite of features designed for holistic network traffic monitoring and security. Its standalone nature and extensive flow protocol support make it a flexible choice for organizations of all sizes.
- Real-time Bandwidth Monitoring: Track bandwidth usage across devices, interfaces, and applications in real-time. The tool helps you pinpoint which applications are consuming the most resources and identify top talkers on the network instantly.
- Application and Protocol Monitoring: Gain insight into application-level traffic with Layer 7 application visibility using Cisco NBAR. This allows you to recognize and categorize both standard and custom applications to understand their impact on network performance.
- Customizable Dashboards and Reports: Build personalized dashboards that display the most critical metrics for your operations. Generate a wide variety of reports, from capacity planning and traffic forensics to on-demand billing, which can be automated and scheduled.
- Security Analytics: The built-in Advanced Security Analytics Module (ASAM) leverages flow data to detect a wide range of external and internal security threats. It identifies network anomalies, DDoS attacks, and policy violations by baselining normal traffic behavior.
Expert Insight: Unlike some competitors that require a separate performance monitoring platform, ManageEngine NetFlow Analyzer operates as a standalone solution focused purely on flow analysis. While it integrates seamlessly with other ManageEngine products like OpManager, its ability to function independently makes it a more accessible and cost-effective entry point for organizations prioritizing deep traffic visibility.
Practical Use Case: Investigating a Network Slowdown
Suppose users are complaining about slow access to a critical internal server, but traditional device health metrics (CPU, memory) appear normal.
- Detection: In the NetFlow Analyzer dashboard, you observe high traffic volume directed at the affected server’s IP address.
- Investigation: You drill down into the traffic details for that server and use the “Conversation” view. This reveals that an unrecognized, low-priority backup process from another department is flooding the server with data packets.
- Identification: The tool shows the exact source IP, destination port, and protocol being used by the rogue process, confirming it is not business-critical traffic.
- Action: You can use this information to create an ACL to block the disruptive traffic or apply a QoS policy to deprioritize it. Alternatively, you can contact the responsible team to reschedule the backup for off-peak hours, immediately restoring performance for critical applications.
Pricing and Access
ManageEngine NetFlow Analyzer is a commercial product with a straightforward, transparent pricing model based on the number of interfaces being monitored. It offers different editions, including a free edition that monitors up to two interfaces, making it ideal for small businesses or for evaluation purposes. The Professional and Enterprise editions scale to thousands of interfaces to support large, distributed networks. A 30-day free trial of the Professional edition is available, which automatically reverts to the free edition after the trial period.
Learn More: ManageEngine NetFlow Analyzer
5. Paessler PRTG Network Monitor
Paessler PRTG Network Monitor is a comprehensive, all-in-one monitoring solution that provides powerful network traffic analysis tools within its unified platform. It stands out for its unique sensor-based approach, allowing IT professionals to monitor everything from bandwidth and traffic to device health and application performance. By supporting multiple technologies, including SNMP, WMI, packet sniffing, and flow protocols like NetFlow and sFlow, PRTG offers a highly flexible way to gain visibility into network activity.
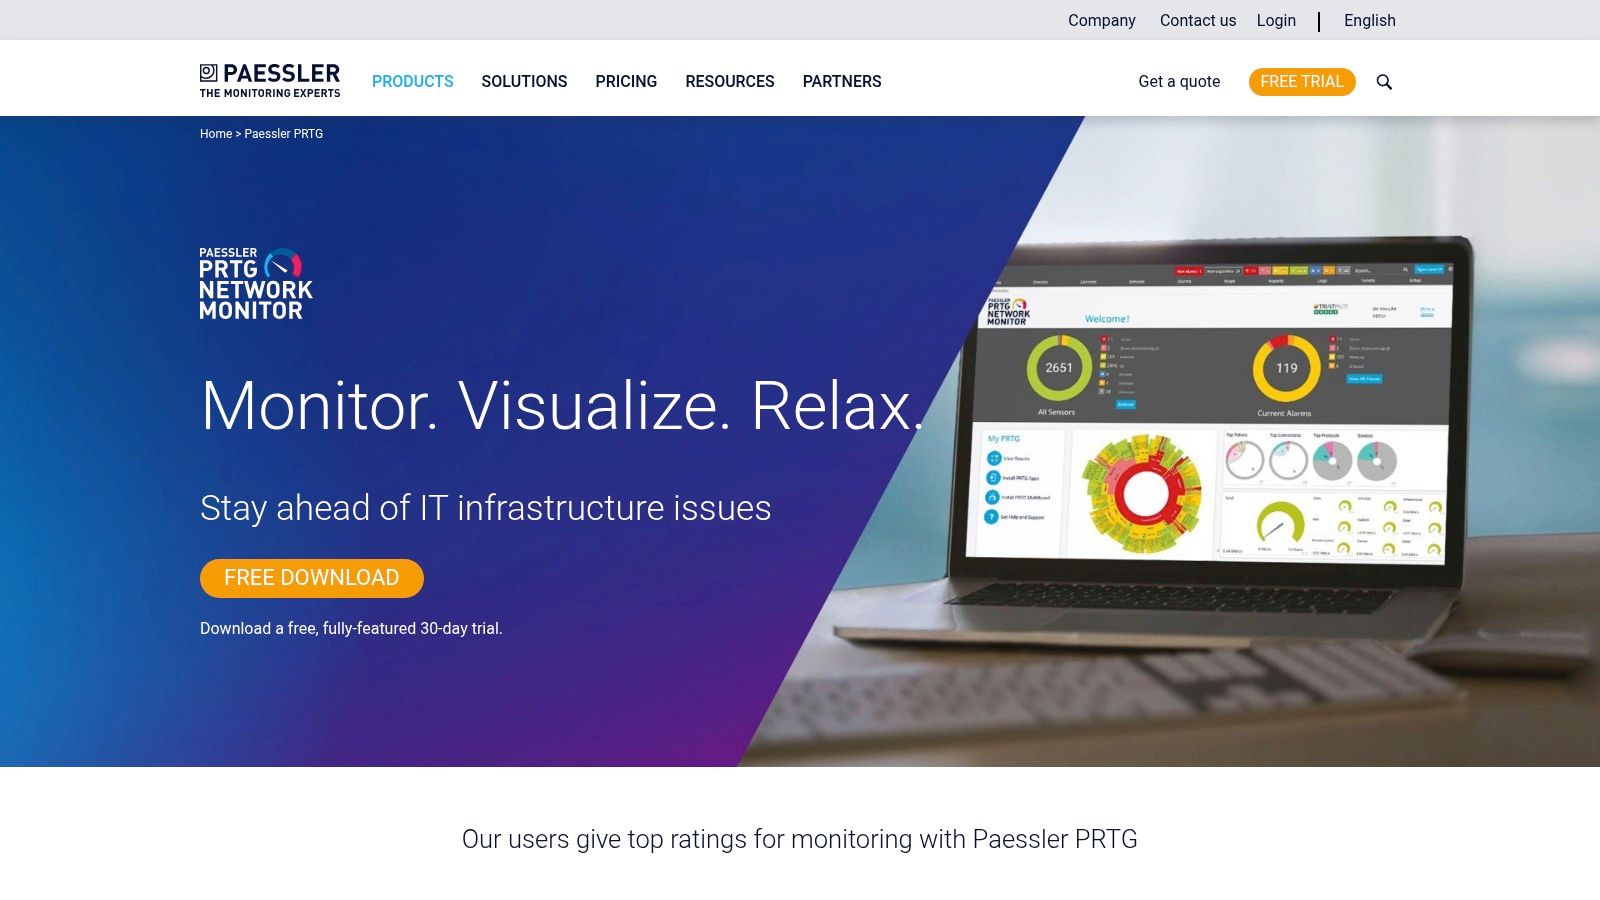
The platform is celebrated for its user-friendly interface, which features a distinctive “sunburst” dashboard for at-a-glance status checks and customizable maps for visualizing your entire network infrastructure. This makes it easier for administrators to quickly identify traffic bottlenecks, unusual bandwidth consumption, or failing devices without navigating through complex menus. PRTG’s strength lies in its ability to consolidate diverse monitoring needs into a single tool, making it a favorite among teams who value simplicity and breadth of coverage.
Key Features and Capabilities
PRTG’s feature set is built around its core concept of sensors, where each sensor monitors one specific aspect of a device or service. This granular approach allows for highly tailored monitoring setups.
- Multi-Technology Support: PRTG is not limited to a single protocol. It can analyze traffic using packet sniffing to see data content, flow protocols (NetFlow, sFlow, J-Flow, IPFIX) for bandwidth usage, and SNMP for device metrics, providing a complete 360-degree view.
- Customizable Dashboards and Maps: Create real-time dashboards that display the exact information you need. The unique map designer lets you build custom network diagrams with live status information, reflecting the physical or logical layout of your environment.
- Flexible Alerting System: Configure detailed and specific alerts based on sensor thresholds, states, or values. Alerts can be delivered via email, SMS, push notifications to the PRTG mobile app, or even trigger scripts for automated remediation.
- All-in-One Monitoring: Beyond traffic analysis, PRTG can monitor servers, virtual machines, cloud services, databases, and applications. This eliminates the need for multiple disparate monitoring tools, simplifying management and reducing costs. You can learn more about the broader benefits of this type of all-encompassing solution and explore the different monitoring strategies available.
Expert Insight: PRTG’s licensing model is a key differentiator. You purchase packs of sensors, and the first 100 sensors are free forever. This makes it incredibly accessible for small businesses or for monitoring a lab environment. However, for large networks, calculating the required number of sensors can be complex, as a single device might require 5-10 sensors just for basic monitoring.
Practical Use Case: Identifying Unauthorized Service Usage
Imagine you suspect that an unauthorized streaming service is being used on the corporate network, impacting performance during business hours.
- Detection: You configure a packet sniffer sensor on PRTG to monitor traffic passing through your core switch or firewall.
- Investigation: You set up the sensor to filter for common streaming protocols or IP addresses associated with popular services. The PRTG dashboard soon flags a high volume of traffic matching this filter.
- Identification: By analyzing the sensor’s data, you can pinpoint the source IP address of the endpoint consuming the streaming service and the destination IP it is connecting to.
- Action: Armed with this evidence, you can update firewall rules to block the service’s IP addresses and communicate with the responsible user to enforce company policy, thereby freeing up valuable bandwidth for business-critical operations.
Pricing and Access
Paessler PRTG offers a straightforward, sensor-based pricing model. The initial 100 sensors are perpetually free, making it an excellent no-cost option for smaller environments. For larger needs, commercial licenses are available starting from 500 sensors (PRTG 500) and scale up to unlimited sensors for very large enterprises. Pricing is transparent and listed on their website, varying by the number of sensors and whether you need a perpetual license or a subscription. A 30-day free trial of the unlimited version is also available.
Learn More: Paessler PRTG Network Monitor
6. Wireshark
Wireshark is arguably the world’s foremost and most widely-used network traffic analysis tool, setting the standard for packet-level inspection. As a free and open-source utility, it allows you to capture and interactively browse the traffic running on a computer network. It is the de facto standard across many commercial and non-profit enterprises, government agencies, and educational institutions for troubleshooting network problems, examining security issues, and developing new communication protocols.
Unlike flow-based analyzers that provide a high-level overview of traffic, Wireshark operates at the microscopic level, capturing individual data packets. This granular detail is invaluable for deep-dive diagnostics, allowing you to see the exact data being exchanged between two points. The platform’s power lies in its ability to decode hundreds of protocols, presenting the encapsulated data in a human-readable format.
Key Features and Capabilities
Wireshark’s strength comes from its powerful feature set, which has been refined over decades by a global community of developers. It provides unparalleled depth for raw packet analysis.
- Deep Packet Inspection: Capture and analyze live data from Ethernet, IEEE 802.11, PPP/HDLC, ATM, Bluetooth, USB, and many other network types. You can also import capture files from other tools for offline analysis.
- Rich Protocol Support: Wireshark understands an immense number of protocols, with new ones being added constantly. This enables detailed dissection of everything from common web traffic (HTTP/S, DNS) to complex enterprise protocols.
- Powerful Display Filters: The platform includes an extensive filtering language that lets you zero in on the exact traffic you need to see. You can filter by IP address, protocol, port number, packet content, and hundreds of other specific fields.
- Cross-Platform Availability: Wireshark runs on Windows, Linux, macOS, Solaris, FreeBSD, and other operating systems, making it a versatile tool for any environment.
Expert Insight: Wireshark’s greatest strength, its granularity, can also be its biggest challenge. It generates a massive amount of data, which can be overwhelming without a clear objective. The key to using it effectively is to start with a specific problem or question and leverage its powerful filters to isolate relevant packets, rather than trying to analyze an entire raw capture.
Practical Use Case: Diagnosing a Slow Application Response
Imagine users are complaining that a critical internal web application is periodically slow, but server-side monitoring tools show no issues with CPU or memory.
- Detection: You decide to capture traffic directly from an affected user’s machine to see the network conversation.
- Investigation: You start a Wireshark capture and have the user replicate the slowness. You stop the capture and filter the results for traffic between the user’s IP and the application server’s IP.
- Identification: By examining the TCP conversation, you notice numerous “TCP Retransmission” and “Duplicate ACK” packets. Using Wireshark’s “Expert Information” tool, you see that the network is experiencing significant packet loss, causing the TCP protocol to constantly resend data and slowing down the application.
- Action: Armed with this evidence of packet loss, you can escalate the issue to the network infrastructure team to investigate faulty switches, cables, or network card configurations that were not visible through high-level monitoring.
Pricing and Access
Wireshark is completely free and open-source, available for anyone to download and use under the GNU General Public License (GPL). There are no licensing fees, subscriptions, or premium features. It is maintained by a large community of volunteers and sponsored by several organizations. Its accessibility makes it an essential tool for students, hobbyists, and professionals alike.
Learn More: Wireshark
7. Nagios Network Analyzer
Nagios Network Analyzer is a powerful commercial-grade application that extends the Nagios ecosystem, providing an in-depth, granular view of network traffic and bandwidth utilization. As one of the more versatile network traffic analysis tools, it allows administrators to go beyond simple up/down monitoring to understand the “who, what, and where” of their network data. It processes NetFlow and sFlow data sources to deliver a comprehensive picture of network health and potential security threats.
The tool is designed to integrate seamlessly into an existing Nagios XI monitoring environment, creating a centralized command center for all infrastructure monitoring. Its strength lies in its ability to quickly pinpoint network traffic issues, from bandwidth-hogging applications to suspicious conversations with external IP addresses. The web-based interface provides customizable dashboards, views, and reports that can be tailored to specific operational needs.
Key Features and Capabilities
Nagios Network Analyzer offers a robust set of features focused on deep visibility and forensic analysis. Its integration with Nagios XI is a key differentiator, providing a unified monitoring and alerting framework.
- Comprehensive Traffic Analysis: Delivers detailed insights into network traffic, allowing you to identify top talkers, bandwidth-consuming applications, and unusual traffic patterns. It supports NetFlow and sFlow protocols from a wide range of network hardware.
- Advanced Security Views: The platform includes specific views designed for security analysis, helping to detect compromised machines, strange network behavior, and potential DDoS attacks by highlighting anomalous traffic flows.
- Customizable Dashboards and Reports: Users can build custom, high-level dashboards that provide an at-a-glance overview of network health. It also allows for the creation of specialized reports for capacity planning and security auditing.
- Automated Alerting: Configure alerts to notify you of abnormal network activity, such as when a specific source exceeds a bandwidth threshold or when unusual port activity is detected, enabling proactive problem resolution.
Expert Insight: One of the main draws of Nagios Network Analyzer is its tight integration with Nagios XI. While it can function as a standalone tool, its true power is unlocked when combined with XI. This allows teams to correlate network traffic data directly with server performance metrics, providing a holistic view of an application’s entire delivery chain.
Practical Use Case: Investigating a Slow Application
An internal web application has become sluggish, and users are complaining about slow load times. Initial checks on the server show normal CPU and memory usage.
- Detection: In Nagios Network Analyzer, you create a new “Source” to monitor traffic flowing to and from the web application’s server IP.
- Investigation: You examine the traffic data for that source and notice a high volume of traffic on an unusual, non-standard port originating from an unknown external IP address.
- Identification: Drilling down into the “Flows” for that conversation reveals that a misconfigured service on the server is responding to a massive number of external requests, saturating the server’s network interface.
- Action: With this specific data, you can implement a firewall rule to block the malicious IP and work with the development team to correct the misconfigured service, immediately restoring application performance.
Pricing and Access
Nagios Network Analyzer is a commercial product available in two tiers: Standard Edition and Enterprise Edition. The Standard Edition offers a single license, while the Enterprise Edition includes multiple licenses and technical support. Pricing starts at $995 for a Standard Edition license. A free, fully functional 60-day trial is available, allowing teams to evaluate its capabilities thoroughly before committing.
Learn More: Nagios Network Analyzer
Network Traffic Analysis Tools Feature Comparison
| Tool | Implementation Complexity 🔄 | Resource Requirements ⚡ | Expected Outcomes 📊 | Ideal Use Cases 💡 | Key Advantages ⭐ |
|---|---|---|---|---|---|
| GoReplay | Moderate setup; CLI familiarity needed 🔄 | Moderate; more for testing environments ⚡ | Realistic traffic replay & load testing 📊 | Continuous testing, performance validation, release vetting | Accurate session-aware replay; real-world scenarios ⭐ |
| SolarWinds NetFlow Traffic Analyzer (NTA) | Moderate; requires integration with NPM 🔄 | Moderate to high; full suite resource needs ⚡ | Detailed network traffic insights 📊 | Bandwidth monitoring, anomaly detection in enterprise networks 💡 | Multi-flow support, user-friendly web UI ⭐ |
| Auvik | Low to moderate; cloud-based ease 🔄 | Low on-prem infra; cloud-hosted ⚡ | Real-time traffic visibility & optimization 📊 | Scalable network environments, bandwidth management 💡 | Cloud deployment, scalable, intuitive UI ⭐ |
| ManageEngine NetFlow Analyzer | Moderate setup; technical knowledge needed 🔄 | Moderate; standard deployment ⚡ | Real-time bandwidth & application monitoring 📊 | Traffic pattern monitoring, application & security analytics 💡 | Multi-protocol support, security analytics ⭐ |
| Paessler PRTG Network Monitor | Moderate to high; sensor setup complexity 🔄 | High in large deployments ⚡ | Comprehensive network monitoring and reporting 📊 | All-in-one network monitoring, flexible licensing 💡 | Versatile tech support, flexible licensing ⭐ |
| Wireshark | High; steep learning curve for beginners 🔄 | Low to moderate; depends on usage ⚡ | Detailed packet-level network troubleshooting 📊 | Protocol analysis, troubleshooting, development 💡 | Free, extensive protocol support, cross-platform ⭐ |
| Nagios Network Analyzer | Moderate to high; setup complexity 🔄 | Moderate; needs Nagios XI integration ⚡ | Network traffic visibility & flow analysis 📊 | Centralized network monitoring with Nagios tools 💡 | Integration with Nagios XI, scalable ⭐ |
Making the Right Choice: From Analysis to Action
Navigating the landscape of network traffic analysis tools can feel overwhelming, but as we’ve explored, the right solution is the one that aligns precisely with your unique operational needs, technical stack, and business objectives. We’ve journeyed through a spectrum of powerful tools, from the open-source precision of Wireshark and the innovative traffic shadowing of GoReplay to the comprehensive, enterprise-grade monitoring suites offered by SolarWinds, Auvik, and ManageEngine. Each platform brings a distinct philosophy to the table, whether it’s the deep, granular packet inspection for debugging or the high-level, flow-based analysis for capacity planning and security monitoring.
The core takeaway is that network traffic analysis is no longer just a reactive, forensic exercise. Modern tools empower teams to be proactive, transforming raw data into predictive insights, streamlined performance, and a more resilient infrastructure. The key is to shift your mindset from simply monitoring traffic to strategically interpreting it to drive business outcomes.
Finalizing Your Toolkit: A Strategic Checklist
Choosing the right tool is a critical decision that impacts everything from developer productivity to customer satisfaction. Before making a final commitment, use this checklist to guide your evaluation process and ensure your chosen solution is a perfect fit for your environment.
-
Define Your Primary Use Case: Are you troubleshooting elusive bugs in a microservices architecture? Your needs will differ vastly from a team focused on identifying bandwidth hogs or detecting anomalous security threats. Pinpoint your number one pain point first.
- Performance Debugging: Tools like Wireshark and GoReplay excel here, offering granular packet-level detail and real-world traffic simulation.
- Capacity Planning: Flow-based tools like SolarWinds NTA, ManageEngine NetFlow Analyzer, and Paessler PRTG provide the high-level visibility needed to forecast future needs.
- Security Monitoring: Look for features like anomaly detection and threat identification, prominent in solutions like Nagios Network Analyzer and SolarWinds NTA.
-
Assess Your Team’s Skillset: The most powerful tool is useless if your team finds it inaccessible.
- Deep Technical Expertise: If your team is comfortable with command-line interfaces and deep packet analysis, Wireshark and GoReplay are powerful, flexible options.
- Generalist IT/DevOps Teams: User-friendly dashboards and automated reporting from platforms like Auvik or Paessler PRTG can lower the barrier to entry and deliver faster value.
-
Evaluate Your Existing Infrastructure: How will a new tool integrate with your current systems?
- Compatibility: Ensure the tool supports your network devices (Cisco, Juniper, etc.) and flow protocols (NetFlow, sFlow, J-Flow).
- Scalability: Consider your growth. Will the tool handle a 10x increase in traffic and devices without a significant performance hit or cost explosion? This is a crucial consideration for platforms like SolarWinds and ManageEngine.
-
Consider the Total Cost of Ownership (TCO): Look beyond the initial license fee.
- Implementation & Training: Factor in the time and resources required to deploy the tool and train your team.
- Maintenance & Support: Account for ongoing subscription costs, support contracts, and the internal manpower needed to maintain the system. Open-source tools like Wireshark may be free, but they require in-house expertise to manage effectively.
Ultimately, the goal is to select a network traffic analysis tool that becomes an integral part of your workflow, not just another dashboard to check. The right tool will provide clear, actionable intelligence that empowers your developers, strengthens your security posture, and ensures your network is a powerful enabler of your business goals, not a bottleneck.
Ready to move beyond passive analysis and start actively testing your systems with real user traffic? GoReplay offers a unique approach by capturing and replaying production traffic, allowing you to rigorously test new releases, conduct performance benchmarks, and shadow traffic in a safe environment. Discover a more resilient way to build software with GoReplay.