Stress Test Website: How to Achieve Maximum Reliability

To really stress test a website, you have to push it past its normal limits until you find the breaking point. This isn’t just about throwing a bunch of traffic at it; it’s about understanding how your system behaves under extreme pressure, finding the bottlenecks, and making sure it can recover without completely falling over. The most effective way to do this today is with real traffic replay.
Why Modern Website Stress Testing Is So Important
In the old days, stress testing was often an afterthought, a box-ticking exercise done right before a launch. Teams would write simple, predictable scripts to hit the homepage or a few product pages over and over again. But that’s not how real users behave. Real users are chaotic. They take weird journeys through your site, hit unexpected API endpoints, and create a messy traffic mix that simple scripts could never dream of replicating.
When your website goes down during a big product launch or a Black Friday sale, you’re losing money and trust with every passing second. Old-school tests often fail to predict these outages because they don’t mirror the complex reality of how people actually use your site.
This is where the game has changed.
The Shift To Realistic Traffic Replay
Modern strategies have moved on, and traffic replay is leading the charge. Instead of guessing at user behavior, these techniques capture a copy of your actual production traffic—all the messy, unpredictable, and complicated user journeys that make up your real-world load. By replaying that traffic in a safe test environment at 5x or 10x the original speed, you can uncover hidden weaknesses that synthetic tests almost always miss.

This approach ensures you’re testing against how your users actually behave, not just how you think they do.
Key Takeaway: A modern stress testing strategy is a core business function, not just an item on a DevOps checklist. It transforms performance testing from a hypothetical exercise into a realistic simulation that truly prepares your application for high-stakes events.
Let’s look at the two main approaches side-by-side.
Synthetic vs Real-Traffic Stress Testing
| Aspect | Synthetic Testing (e.g., JMeter) | Real-Traffic Replay (e.g., GoReplay) |
|---|---|---|
| Traffic Source | Scripted, predictable user journeys | A direct copy of real, live user traffic |
| Realism | Low. Fails to capture user complexity. | High. Includes all edge cases and chaotic behavior. |
| Weakness Detection | Finds obvious bottlenecks (e.g., homepage load). | Uncovers hidden issues in specific APIs or user flows. |
| Setup Time | High. Requires extensive script writing and maintenance. | Low. Capture traffic and point it to a test environment. |
| Confidence Level | Moderate. You’ve tested something, but not reality. | Very high. You know the system can handle its actual load. |
The difference is clear: replaying real traffic gives you a far more accurate picture of your system’s resilience.
The Business Case For Realistic Testing
In today’s world, stress testing is completely non-negotiable, especially for events that you know will cause a traffic spike. A new product launch can easily trigger a 150% traffic surge in just a few hours, overwhelming unprepared systems and leading to costly outages. We’ve seen teams that adopt traffic replay reduce their production incidents by up to 40%—a massive jump in reliability.
A solid testing process brings a few huge benefits:
- Finds the True Breaking Points: You can pinpoint the exact component—whether it’s the database, a specific microservice, or a third-party API—that cracks first under extreme load.
- Validates Scalability: It confirms whether your auto-scaling policies actually work as intended or if they need some tuning. This is a crucial part of any serious capacity planning for web applications.
- Improves System Resilience: You get to see how your site recovers from failures, which helps you build a better user experience even when things go partially wrong.
If you want to go deeper into building responsive and stable systems, this detailed guide on performance engineering is a great resource.
Ultimately, this guide is all about walking you through how to plan, run, and analyze tests that make your website genuinely ready for whatever the real world throws at it.
Building Your Realistic Stress Test Plan
Before you touch a single command line or config file, you need a plan. This isn’t just about dotting i’s and crossing t’s; a solid, realistic plan is what separates a controlled experiment from a chaotic, useless one. Without it, you’re just generating noise and hoping for the best.
The first move is to define sharp, specific objectives. Goals like “see if the site can handle more traffic” are far too vague to be helpful. You need to frame them around real business scenarios.
For instance, are you getting ready for a predictable surge, like a Black Friday sale where you expect 5x your normal traffic? Or are you just trying to validate that your new auto-scaling rules actually kick in when you launch that new feature?
A well-defined objective becomes your North Star. It dictates the kind of test you run, what you measure, and how you’ll know if you’ve succeeded. A test to validate a new caching layer looks completely different from one designed to find the absolute breaking point of your database.
Mapping Realistic User Journeys
With clear goals in hand, it’s time to map out the user journeys that actually matter. A classic mistake is to just hammer the homepage over and over. That approach completely misses the complex, resource-heavy actions that bring systems to their knees under pressure.
Think about what real people do on your site. A realistic stress test needs to include multi-step flows that mimic that behavior.
Here are a few examples to get you thinking:
- E-commerce Checkout Flow: A user browses a few product categories, adds three different items to their cart, maybe applies a discount code, and then goes through the entire multi-page checkout process.
- Account Creation and Setup: A new user signs up, verifies their email, logs in for the first time, and then completes their profile by uploading an avatar and filling out five different fields.
- Complex Search and Filter: A user on a marketplace site runs a search, then applies three separate filters—like price range, brand, and customer rating—to drill down into the results.
Each one of these journeys puts a unique kind of strain on different parts of your infrastructure, from the web server and application code to the database and even third-party APIs.
Building Your Load Profile
Once you’ve mapped out the journeys, you need to build a load profile that mirrors reality. This is where you dig into your existing analytics or server logs to see what your traffic is actually made of. What’s the ratio of people just browsing versus those actually buying something? What are your peak requests per minute? This data is gold—it helps you build a test that reflects how your site is really used.
Finally, you have to tackle the crucial legal and ethical groundwork. Any test plan worth its salt must include steps for data masking. Replaying raw production traffic without scrubbing sensitive data like names, emails, or session tokens is a massive compliance risk. You need to be sure your plan isn’t just effective, but responsible, too.
Configuring Your Environment and Tools
With your stress test plan mapped out, it’s time to get your hands dirty and set up the testing ground. The first big decision is where you’ll actually run these tests. Ideally, you want an exact replica of your production setup—same hardware, same network, same software versions—but completely isolated. This is the only way to ensure your results are truly accurate without putting live users at risk.
A dedicated staging environment is what most teams use. It might not be a perfect 1:1 match with production, but it gives you a safe sandbox to unleash hellish amounts of traffic. The key is to get it as “production-like” as possible, otherwise, the bottlenecks you find might just be artifacts of a weaker test setup. For a deeper dive, check out our guide on the best practices for setting up testing environments.
Capturing Real Traffic with GoReplay
To really put your website through its paces, you need realistic traffic, not just synthetic pings. This is where a tool like GoReplay becomes absolutely essential. It’s an open-source tool that lets you “listen” to your live production traffic, record it, and then replay it against your test environment.
The beauty of this process is how non-intrusive it is. GoReplay sits passively, sniffing network packets without adding a millisecond of latency or any overhead to your live application. You can safely record real user interactions, and your customers will never even know it’s happening.
This approach has completely changed how we think about software resilience. GoReplay’s 18.3k GitHub stars show just how dominant it’s become for replaying real HTTP traffic to generate ultra-realistic loads. It can process tens of thousands of requests per second on standard servers, thanks to Go’s lock-free queues for zero-copy efficiency—perfect for today’s Kubernetes clusters. In fact, enterprise teams often report 40% fewer incidents after adopting it.
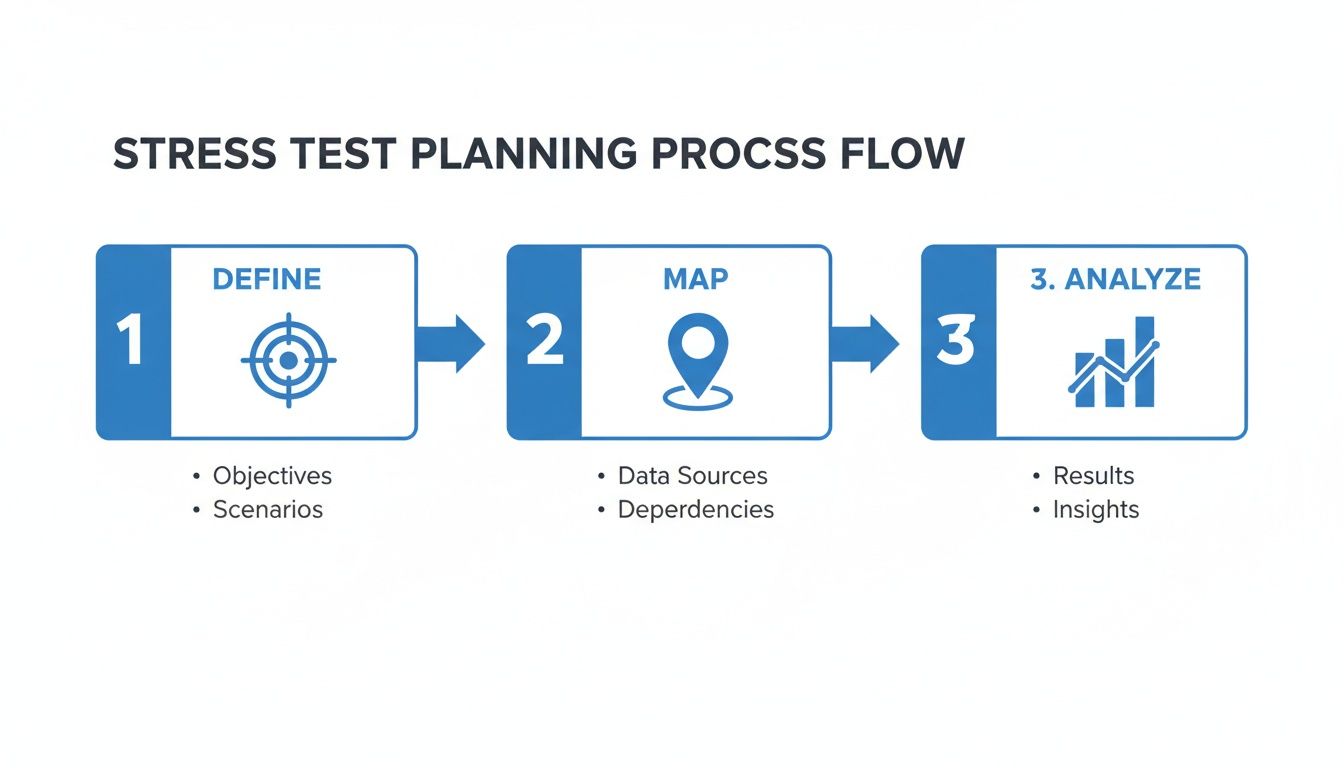
This whole process—defining what you need to test, mapping out how users actually behave, and analyzing traffic—is the foundation you build on before you even think about capturing a single packet.
Replaying Traffic to Simulate Load
Once you have a recording of your production traffic, you can start having some fun. At first, you might replay it against your staging environment at its original speed just to get a baseline and validate that everything works.
The real power, though, comes from amplification. GoReplay lets you multiply the traffic, replaying it at 2x, 5x, or even 10x the original speed. This is how you find your system’s true breaking point by simulating a massive traffic spike from a product launch or a viral marketing campaign.
Getting started is surprisingly straightforward. You can fire up a simple command on your production server to start capturing traffic and save it to a file. Then, on another machine, you use a second command to replay that file against your staging server’s address, telling it exactly how much to ramp up the load. This direct, hands-on approach gives you full control over your stress test.
Running the Test and Monitoring Key Metrics
With your environment configured and traffic ready to go, it’s time to actually run the stress test.
This isn’t about just hitting a big red “start” button and crossing your fingers. It’s a methodical process. Your very first run should always be a baseline test, where you replay traffic at its original speed (1x) to establish a performance benchmark. Think of it as a sanity check to make sure everything works before you crank up the dial.
Once that baseline looks solid, you can start ramping up the load. We typically push traffic to 2x, then 5x, and beyond, carefully watching how the system behaves as the pressure mounts. The whole point is to keep pushing until you either hit your predefined performance goals or, more interestingly, find the system’s breaking point.
Beyond Average Response Times
When you’re in the thick of a stress test, it’s incredibly tempting to just stare at the average response time. But be warned: that single number can be dangerously misleading. A great “average” can easily mask a terrible experience for a huge chunk of your users, making it a classic vanity metric under pressure.
Instead, you need to be looking at the metrics that tell the real story about user experience and system health. This means digging into server-side vitals, application health, and—most critically—user-facing latency percentiles.
These key metrics give you the complete picture:
- Server-Side Vitals: Keep a close eye on CPU Utilization, Memory Usage, and Disk I/O. A sudden spike in any of these is often the first sign of an impending bottleneck, long before users ever feel the slowdown.
- Application Health: You’ll want to track Throughput (requests per second) and Error Rates (especially HTTP 5xx errors). If you see throughput flatten out while the error rate starts to climb, you’ve probably just found your performance ceiling.
The Power of Latency Percentiles
The most honest indicators of performance you can track are latency percentiles—specifically, the p95 and p99 metrics. The p95 latency shows you the response time felt by 95% of your users, which immediately cuts out the fastest outliers and gives you a much better sense of the typical experience.
But the p99 metric is even more telling. It represents the experience of your worst-off 1% of users. During a traffic surge, this is the number that will go through the roof first, acting as your canary in the coal mine. If your p99 latency suddenly jumps from 200ms to 5 seconds, you have a serious problem on your hands, even if the average still looks okay.
Essential Stress Test Metrics to Monitor
Watching the right numbers is half the battle. This table breaks down what you should be monitoring, why it’s important, and when you should start getting worried.
| Metric Category | Specific Metric | Why It Matters | Typical ‘Red Flag’ Threshold |
|---|---|---|---|
| User Experience | p95 & p99 Latency | Reflects the experience of the majority and worst-off users, not just the average. | A sudden, sharp increase (e.g., > 2-3x baseline) |
| Application Health | HTTP 5xx Error Rate | Indicates server-side failures; a rising rate means the system is breaking. | Any rate consistently above 0.1% under load |
| Application Health | Throughput (RPS) | Shows how many requests your system can handle. If it flattens, you’ve hit a limit. | Throughput stops increasing as load is added |
| System Resources | CPU Utilization | High CPU can be a primary bottleneck, slowing down all processing. | Sustained usage above 80-90% |
| System Resources | Memory Usage | Running out of memory leads to swapping and severe performance degradation. | Nearing 95% capacity with little free space |
| System Resources | Disk I/O Wait Time | High wait times mean your storage can’t keep up, often blocking processes. | Consistently high wait times causing application delays |
Ultimately, a solid monitoring strategy lets you connect the dots between a symptom (like slow response times) and its root cause (like a maxed-out database connection pool).
Historical data from major cloud outages has shown 99th percentile response times jumping from 200ms to over 10 seconds under stress—more than enough to frustrate users and destroy trust. Diving into API stress testing reveals why percentiles always trump averages, especially when you have a large user base.
Monitoring isn’t just about watching graphs wiggle. It’s about correlating events. When you see that p99 latency spike, you should be able to look at your other dashboards and spot a corresponding jump in database CPU or a surge in application errors. This is how you turn raw data into an actionable starting point for a real fix.
Turning Test Data Into Actionable Fixes
Alright, the test is done. The virtual users have clocked out, and your dashboards are lit up with graphs and numbers. This is where the real work begins—turning all that raw data into actual, meaningful improvements for your site. Just knowing where your website breaks isn’t enough; you need a clear plan to fix it.

The first thing to do is connect the dots. A solid analysis traces a symptom, like a sudden spike in p99 latency, right back to its root cause. By correlating your application metrics with your server metrics, you can usually pinpoint the exact moment things started to go sideways.
Connecting Symptoms to Causes
Your goal here is to build a story from the data. For example, maybe you notice that every time your throughput shot past 5,000 requests per minute, the p99 latency for the /api/checkout endpoint leaped from an acceptable 200ms to a painful 4,000ms.
Digging a little deeper, you check the database metrics for that exact time window. Lo and behold, the active connections count slammed into its configured maximum. Just like that, you’ve tied a user-facing slowdown to a specific bottleneck: database connection pool exhaustion. That’s the level of detail you need to get things fixed.
The true value of a stress test isn’t in the final report; it’s the specific, evidence-backed story you can tell your dev team. “The checkout is slow” is a complaint. “The checkout API’s p99 latency spikes when the database connection pool is maxed out” is an actionable diagnosis.
Common Bottlenecks and Their Fixes
After you’ve run a few of these tests, you start to see the same old culprits popping up. Certain problems just love to rear their heads when a system is under pressure. Here are a few common ones I see all the time and what to do about them:
- Database Overload: If your slow query logs are blowing up, it’s a dead giveaway that you’ve got inefficient queries or missing indexes. The fix is usually some good old-fashioned query optimization or a few schema tweaks.
- Inefficient Caching: Seeing high latency on requests for data that doesn’t change much? That often points to a poorly configured cache. You might need to increase cache TTLs, implement a distributed cache like Redis, or just make sure you’re caching the right things to begin with.
- Microservice Saturation: In a distributed system, it only takes one overloaded microservice to start a domino effect. Identifying which service is the weak link allows you to scale it up on its own or dive into its code to optimize it.
Creating a Prioritized Action Plan
Once you’ve identified the bottlenecks, the final piece is to boil down your findings into a concise report that everyone can get behind. Please, don’t just dump a pile of raw data on your stakeholders. Instead, give them a prioritized list of fixes.
I like to use a simple framework to rank issues by impact and effort:
- Critical Fixes: These are your high-impact, low-effort wins. Think adding a missing database index or tweaking a cache setting. Get these done first.
- Strategic Improvements: These are the high-impact, high-effort changes. This could be a bigger project like re-architecting a service or rolling out a new caching layer.
- Minor Optimizations: Low-impact issues that are nice to have but aren’t on fire. These can be tackled when the team has some downtime.
This structured approach is what makes the whole exercise worthwhile. It ensures your stress testing efforts lead directly to a tougher, more reliable website that’s ready for whatever comes its way.
Got Questions About Stress Testing?
When you’re diving into performance testing, a few common questions always seem to pop up. Getting straight answers is key to making smart decisions and planning tests that actually deliver value. Let’s tackle some of the ones I hear most often.
How Often Should I Run These Tests?
You absolutely need to run a full-scale stress test before any big event. Think new product launches, a major infrastructure migration, or that massive marketing campaign you’re banking on. And don’t leave it until the last minute—give yourself time to fix what you find.
But it shouldn’t stop there. For teams practicing CI/CD, the real magic happens when you bake smaller, automated performance tests right into your builds. This catches performance dips early on, long before they snowball into production nightmares. It shifts reliability from a one-off panic event to a daily practice.
Can I Just Test on My Live Website?
Please don’t. Stress testing your live, production website is like testing a parachute by jumping out of a plane with it for the first time. It’s incredibly risky. You could easily slow down the site for actual users or, worse, cause a complete outage, which is exactly what you’re trying to prevent.
The best way to do this is to set up a staging environment that’s a dead ringer for production. This is where tools like GoReplay shine. You can safely capture real traffic from your live site and replay it in your isolated staging environment. You get to find all the weak spots without a single customer ever knowing.
What’s the Difference Between Load Testing and Stress Testing?
People often use these terms interchangeably, but they’re really two sides of the same coin, each answering a different question about your system’s performance.
-
Load Testing: This is all about seeing how your system handles an expected amount of traffic. Think of it as a dress rehearsal for your busiest day. It answers the question, “Can we handle the rush we’re anticipating?”
-
Stress Testing: This is where you push things past the expected peak to find the actual breaking point. The goal isn’t just to see if it breaks, but to understand how it breaks and, just as importantly, how it recovers. This answers the question, “Where’s our absolute limit?”
What if I Don’t Have Much Traffic to Test With?
Even a trickle of live traffic is gold. It represents real human behavior—the exact clicks, user journeys, and API calls that your synthetic test scripts will almost certainly miss. It’s the difference between a scripted dialogue and a real conversation.
You can take that small but authentic sample and use a tool’s traffic multiplication feature to crank up the volume. This lets you simulate what a future growth spurt or a sudden traffic spike will look like far more accurately than just making up traffic from scratch.
GoReplay gives you the power to capture and replay real user traffic, making your stress tests as realistic as they can be. Find and fix your bottlenecks before your customers do. Check it out at https://goreplay.org.