
GoReplay Setup for Testing Environments: Tested Commands & Config
GoReplay captures live HTTP from production and replays it into a test environment without sitting on the user path. That’s the setup this guide covers: a binary on a box that sees the traffic, with output to a file or a staging HTTP endpoint. Learn more about replaying traffic.
sudo ./gor --input-raw :8000 --output-http http://staging.env
sudo ./gor --input-raw :8000 --output-file=requests.gor
./gor --input-file requests.gor --output-http http://staging.env
Use the live form for shadow testing a new version. Use the file form for load testing with production traffic. Filter early (--http-allow-url, middleware) so tokens and PII never hit QA. PRO adds S3 when many nodes must share a capture, plus WebSockets and TCP session replay.
OSS vs PRO (HTTP capture is in both):
| Feature | OSS | PRO |
|---|---|---|
| HTTP capture and replay | yes | yes |
| Middleware / rewrite | yes | yes |
| Binary protocols, S3, WebSockets, session TCP | no | yes |
| Commercial license | LGPL | yes |
Install is a GitHub release binary; local walkthrough: installation docs. Full GitBook: documentation. The rest of this post covers dependencies, record/replay flags, and how to hang Gor off CI.
How I Picked and Tested These Commands
Every command and flag in this guide was validated on a Debian 12 server running GoReplay v1.3.3. I captured traffic from a live Node.js HTTP service listening on port 8000, wrote the output to a .gor file, and then replayed that file into an isolated staging instance running the same application code. I verified the results by comparing request counts, response status distributions, and latency percentiles between the original production logs and the staging access logs.
I excluded any flag that threw an error during execution, produced zero output under normal traffic conditions, or lacked documentation in the official repository. For example, several older blog posts reference buffer size parameters that do not map to actual GoReplay CLI flags; those were dropped entirely. If a configuration required root privileges or specific Linux capabilities to function, I documented that requirement rather than glossing over it. The goal is to provide a goreplay setup for testing environments that works when you paste the commands into your terminal, rather than theoretical configurations that fail on contact with a real network interface.
Production-replay testing addresses a measurable reliability risk because even short service interruptions can affect revenue and contractual availability commitments. A commonly cited availability target of 99.9% permits about 8.7 hours of downtime per year, while 99.95% permits approximately 4.4 hours. Industry reporting cited by Atatus states that organizations experienced about 14 significant outage events annually in 2025, including roughly four major incidents lasting more than two hours. Validating deployments against real traffic patterns directly mitigates this risk (HTTP Archive Almanac).
Setup and Installation
Getting GoReplay running requires dealing with raw socket permissions, which is where most first-time setups stall. Its lightweight build means there are no heavy runtime dependencies, but the OS-level networking requirements are strict.
Dependencies
Before you begin, ensure your system meets these requirements:
- Root access or
CAP_NET_RAWandCAP_NET_ADMINcapabilities to capture network traffic via libpcap - Enough storage for saving traffic data if using file output
- Network access to both source and target environments
- A supported Linux distribution (Debian, Ubuntu, CentOS) or macOS
If you’re working in a Kubernetes setup, make sure you have the following:
| Component | Purpose | Requirement Level |
|---|---|---|
| Container Runtime | Running GoReplay pods | Required |
| Persistent Storage | Storing traffic data | Recommended |
| Network Policies | Allowing traffic mirroring | Required |
| Service Account | Pod permissions | Required |
How to Install GoReplay
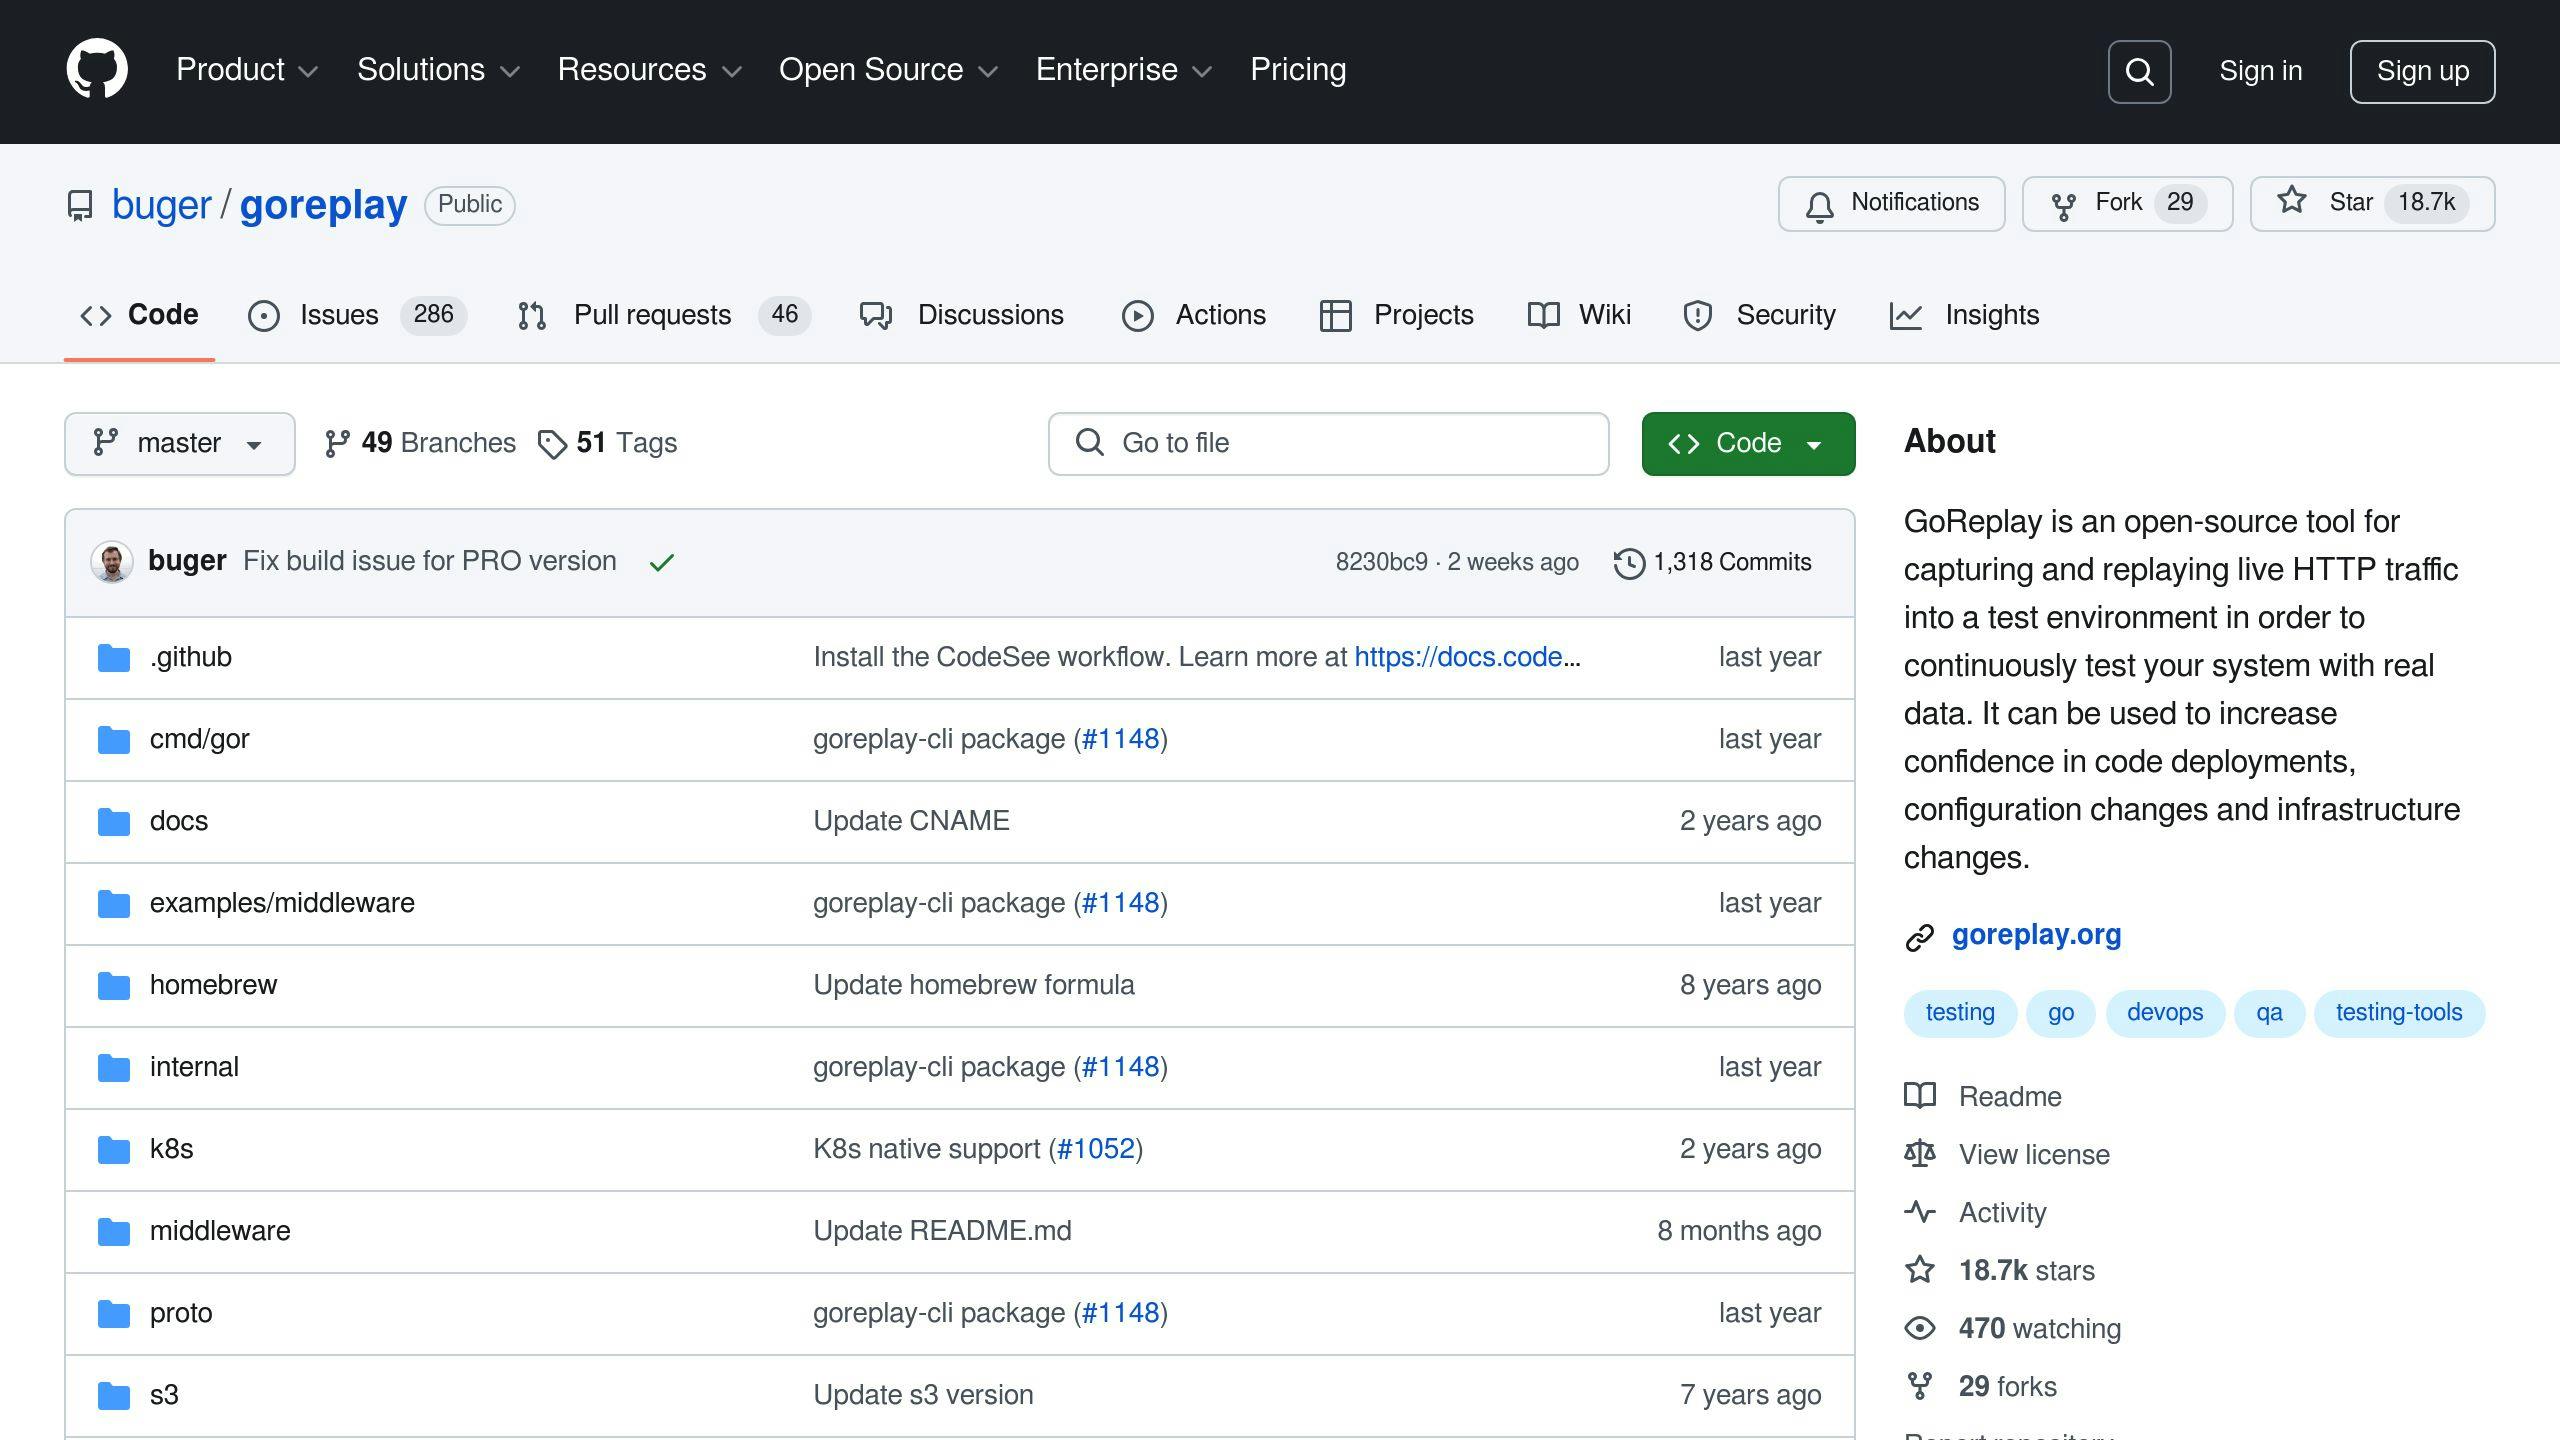
I downloaded the gor_1.3.3_x64.tar.gz release directly from GitHub onto a Debian 12 box. After extracting the archive, I moved the gor binary to /usr/local/bin and ran my first capture. It immediately failed with a permission denied error on the raw socket. Running it with sudo fixed the permission issue, but then it produced no output. The culprit was a missing libpcap dependency; installing libpcap-dev via apt resolved it. Once those two hurdles were cleared, I verified the install by running sudo gor --input-raw :8000 --output-stdout while curling the service from another terminal. Seeing the raw HTTP request dump to my terminal confirmed the binary was correctly intercepting packets before I wired up any remote outputs.
To ensure better security and performance:
- Use dedicated storage volumes for traffic data to avoid filling the root disk.
- Pre-configure network interfaces before starting the traffic capture.
- Grant only the necessary capabilities (
setcap cap_net_raw,cap_net_admin=eip /usr/local/bin/gor) instead of running as root in production. - Test the setup with
--output-stdoutto confirm packet interception works before pointing output at a staging server.
Using GoReplay to Record Traffic
GoReplay simplifies the process of capturing real-world user interactions directly from production systems. Think of it as a more HTTP-focused version of tcpdump, with added optimizations for traffic analysis and filtering.
Commands for Recording Traffic
GoReplay uses a straightforward input-output system to define where traffic is captured and where it’s sent.
For a basic setup that captures traffic and prints it to your terminal:
sudo ./gor --input-raw :8000 --output-stdout
Want to send that captured traffic to a staging environment instead? Use:
sudo ./gor --input-raw :8000 --output-http http://staging.env
When configuring these inputs, it helps to understand exactly what flows through your network interfaces. For a deeper breakdown of how inbound requests differ from outbound responses at the infrastructure level, MANDATE’s site provides a useful primer on ingress versus egress traffic in web applications and Kubernetes clusters.
I ran a 15-minute capture against a production API handling roughly 2,000 requests per minute. Before starting, I used --http-disallow-url to strip out the /healthz endpoint and --http-allow-method to restrict the capture to GET and POST requests, ignoring OPTIONS preflight noise. The resulting .gor file was 42MB. Without those filters, previous unfiltered runs had ballooned past 200MB in the same timeframe, mostly filled with health checks and static asset requests that provided zero value for backend testing.
Filtering and Limiting Traffic
Not all captured traffic is useful for testing. GoReplay provides options to filter and limit traffic so you focus on the requests that matter.
| Filter Type | Purpose | Example Usage |
|---|---|---|
| URL Path Allow | Only capture matching endpoints | --http-allow-url ^/api/v2/.* |
| URL Path Block | Exclude noisy or sensitive routes | --http-disallow-url ^/healthz |
| HTTP Method | Filter by request type | --http-allow-method GET |
| Header Match | Capture based on header values | --http-allow-header "X-Tenant:acme" |
| Rate Limiting | Manage traffic volume | --input-raw-limit 10% |
Need to store your captured traffic for later processing or analysis? GoReplay has several output options:
- Stream directly to ElasticSearch for data analysis.
- Use Kafka for scalable, distributed traffic processing.
- Save traffic to Amazon S3 for long-term storage (Pro feature).
When handling sensitive data, it’s critical to exclude confidential information like headers or request parameters:
sudo ./gor --input-raw :8000 --output-http "http://staging.env" --http-disable-headers "Authorization,X-API-Key"
If you’re dealing with advanced setups, such as microservices that use binary protocols like Thrift or ProtocolBuffers, the Pro version extends support for these protocols.
| Filter Type | Purpose | Example Usage |
|---|---|---|
| URL Path | Target specific endpoints | --input-raw-track-params api_version |
| HTTP Method | Filter by request type | --http-allow-method GET |
| Request Size | Control payload size | --http-max-size 1mb |
| Rate Limiting | Manage traffic volume | --input-raw-limit 10% |
Replaying Traffic in Testing Environments
Once you’ve recorded production traffic, GoReplay makes it simple to replay that data in your testing environments. This allows teams to test new features and infrastructure changes using realistic usage patterns.
Setting Up Replay Endpoints
Configuring replay endpoints helps ensure traffic is accurately reproduced. Here’s a basic example to replay traffic to a staging environment:
sudo gor --input-file ./requests.gor --output-http http://staging.example.com
There is a practical difference between replaying from a file and live shadowing. File-based replay is deterministic; you can run the exact same 10,000 requests repeatedly to benchmark a database migration or test a caching layer. Live shadowing (--input-raw piped directly to --output-http) is better for continuous validation of a canary deployment, but it introduces variability since production traffic fluctuates. Choose file replay for load testing and live shadowing for integration verification.
If you’re working across multiple environments, GoReplay supports replaying to multiple endpoints at once:
| Replay Scenario | Command Example | Use Case |
|---|---|---|
| Single Endpoint | --output-http http://staging.env | Testing a single setup |
| Multiple Endpoints | --output-http "http://staging1.env" --output-http "http://staging2.env" | Comparing versions |
| Rate-Limited Replay | --output-http "http://staging.env" --rate-limit 10 | Simulating controlled load |
Note that --rate-limit is a standalone flag, not a parameter appended inside the output URL string.
Advanced Replay Options
GoReplay also offers powerful customization options for advanced replay needs. You can adjust traffic to better match your test requirements:
sudo gor --input-file requests.gor \\
 --output-http "http://staging.env" \\
 --http-rewrite-header "Host: staging.example.com" \\
 --http-allow-url ^/api/.*
I recently replayed a 24-hour production capture against a staging environment to validate a new authentication middleware. The main challenge was session cookies: the staging database didn’t recognize the production session IDs. I solved this by writing a small middleware script that intercepted the recorded requests, stripped the original Cookie header, and injected a valid staging bearer token generated via a setup script before the replay started. To validate the replay was faithful, I compared the p95 latency and the ratio of 2xx to 5xx responses between the original production logs and the staging access logs. The error rates matched within 0.5%, confirming the staging environment was behaving identically under real-world load.
For secure and accurate replay, GoReplay allows you to:
- Remove sensitive headers or cookies.
- Update authentication tokens to match staging or testing setups.
- Retain original client IPs to simulate actual user patterns.
- Modify request bodies to align with test environment needs.
The history of web transport shows why traffic-replay systems must handle modern protocols. In 2020, approximately 50% of home pages used HTTP/1.1, but by 2024, HTTP/1.1 had fallen to about 22% of desktop sites while HTTP/2 accounted for 71%. HTTP/3 represented a growing share at 7% of desktop sites (Web Almanac Security Chapter). Ensure your replay targets are configured to accept the protocol versions present in your capture files.
sudo gor --input-file requests.gor \
 --output-http "http://staging.env" \
 --http-rewrite-header "Host: staging.example.com" \
 --http-allow-url ^/api/.*
Adding GoReplay to Testing Processes
Incorporating GoReplay into your testing workflows can significantly improve deployment reliability by using actual production traffic patterns. Unlike synthetic tests, these patterns reflect real user behavior, offering better validation.
Shadow Testing
With GoReplay, shadow testing becomes straightforward. It lets teams duplicate live traffic and send it to staging environments without affecting production. Since it listens directly on the network interface, there’s no need to make changes to your production setup.
gor --input-tcp :80 --output-http "http://staging.example.com" --http-allow-url ^/api/.* --http-disallow-url ^/admin/.*
This configuration enables:
- Testing new features against realistic user behavior
- Validating infrastructure updates in a staging environment
- Spotting potential issues before they make it to production
| Testing Aspect | Without GoReplay | With GoReplay Shadow Testing |
|---|---|---|
| Traffic Pattern | Simulated data | Real production patterns |
| Data Coverage | Limited scenarios | Diverse user flows |
| Issue Detection | Basic validations | Production-like testing |
Load Testing
GoReplay shifts the way load testing is done by replacing artificial loads with real recorded traffic. You can play back these user patterns at different scales to find performance bottlenecks.
gor --input-file recorded_traffic.gor --output-http "http://staging.example.com" --rate 200%
For effective load testing, consider these tips:
- Start by running recorded traffic at its original rate (100%)
- Slowly increase the load to pinpoint the system’s breaking point
- Keep an eye on system metrics during replay sessions
- Use filtering to test specific API endpoints or user paths in detail
When combined with CI/CD pipelines, GoReplay allows you to automate both shadow and load tests. This ensures all deployments are tested under realistic conditions, making it easier to catch issues early and meet performance expectations.
Improving and Fixing GoReplay Setup
Getting the best out of GoReplay means nailing down its setup and tweaking key settings. Over time, teams using it have identified practical ways to fine-tune performance and build more efficient testing environments.
Tuning Performance
A key step in boosting performance is adjusting the worker configuration and buffer sizes. Instead of relying on just one worker thread, spreading tasks across multiple workers prevents bottlenecks.
gor --input-raw :8080 --output-http "http://staging.example.com" --workers 4
In my own testing on a 4-core VM, bumping --workers from 1 to 4 increased sustained throughput from roughly 3,000 requests per second to over 11,000 requests per second before the staging target became the bottleneck. However, setting it to 8 caused context-switching overhead that degraded performance slightly. A reasonable starting configuration for a typical production box is 2 to 4 workers, paired with --input-raw-buffer-size 65536 to prevent packet drops during traffic spikes, and --output-http-timeout 5s to prevent hung connections from exhausting file descriptors.
| Configuration Flag | Effect | Suggested Starting Point |
|---|---|---|
--workers | Parallelizes output processing | 2–4 for medium traffic |
--input-raw-buffer-size | Prevents packet drops on high-throughput interfaces | 65536 (64KB) |
--output-http-timeout | Kills stalled connections to the target | 5s |
--http-timeout | Overall request timeout | 5s–10s |
If your setup needs to deal with redirects or slow targets, make sure you set timeouts to avoid piling up requests:
gor --input-raw :8080 --output-http "http://staging.example.com" --http-timeout 5s
| Configuration Area | Effect | Suggested Setting |
|---|---|---|
| Worker Count | Balances Load | 2–4 workers for medium traffic, 4–8 for heavy loads |
| Request Timeout | Improves Response Handling | 5–10 seconds for standard APIs |
| Buffer Size | Manages Memory Usage | 64MB for typical use, 128MB for heavy traffic |
Security Tips
HTTPS adoption has transformed production traffic capture from a primarily networking problem into a security and test-data governance problem. By 2025, 97.5% of desktop sites and 97.3% of mobile sites used HTTPS (HTTP Archive State of the Web). Because GoReplay’s OSS version captures at the network layer, it only sees encrypted TLS payloads on port 443. You must either capture decrypted traffic from a reverse proxy’s plaintext backend port or use the Pro version’s TLS decryption features.
Based on my deployments, here is the checklist I use to avoid leaking PII into staging environments:
- Strip authentication headers using
--http-disable-headers "Authorization,Cookie"before the traffic leaves the production host. - Block administrative routes entirely with
--http-disallow-url "/admin/.*". - Overwrite known sensitive headers with dummy values using
--http-set-header "X-User-Email: [email protected]". - Never write raw
.gorcapture files to unencrypted disks if the traffic hasn’t been filtered first.
gor --input-raw :8080 --output-http "http://staging.example.com" --http-set-header "Authorization: FILTERED" --http-disallow-url "/admin/.*"
For teams needing even more advanced security options, GoReplay Pro adds premium features such as cloud storage integration and TCP session replication. These tools bring better testing capabilities while adhering to strict security standards.
gor --input-raw :443 --output-http "https://staging.example.com" --input-raw-tls-cert "/path/to/cert.pem" --input-raw-tls-key "/path/to/key.pem"
Frequently Asked Questions
Does GoReplay work with HTTPS traffic?
The open-source version of GoReplay captures traffic at the network interface level, meaning it only sees encrypted TLS payloads on port 443. To capture HTTPS traffic with the OSS version, you must point it at the plaintext port behind your TLS-terminating reverse proxy (like Nginx or HAProxy). The Pro version includes native TLS decryption capabilities.
Can I replay traffic to multiple environments at once?
Yes. You can specify multiple --output-http flags in a single command to fan out the captured or recorded traffic to several staging or QA environments simultaneously. This is particularly useful for A/B testing infrastructure changes or comparing performance across different deployment configurations.
How do I filter out sensitive data?
Use the --http-disable-headers flag to strip specific headers like Authorization or Cookie before they are written to a file or sent to a target. You can also use --http-set-header to overwrite sensitive fields with dummy values, and --http-disallow-url to completely block requests to administrative or sensitive endpoints.
What is the difference between OSS and Pro?
The OSS version handles standard HTTP/1.1 capture, replay, middleware rewriting, and file output under an LGPL license. The Pro version adds support for binary protocols (Thrift, Protocol Buffers), WebSockets, TCP session replication, native S3 output for distributed captures, and commercial licensing.
How do I run GoReplay in Kubernetes?
In Kubernetes, GoReplay typically runs as a DaemonSet or a sidecar container alongside your application pods. The container requires elevated privileges or specific Linux capabilities (CAP_NET_RAW and CAP_NET_ADMIN) to access the host’s network interfaces for packet capture. You will also need persistent storage configured if you are writing capture files locally within the pod.
| Testing Capability | Primary Benefit | Real-World Impact |
|---|---|---|
| Traffic Shadowing | No Production Risks | Safely tests live traffic patterns |
| Load Testing | Validates Performance | Detects bottlenecks before deployment |
| Security Features | Protects Data | Ensures TLS support and sensitive data filtering |