
Logging and Monitoring Guide for DevOps Teams
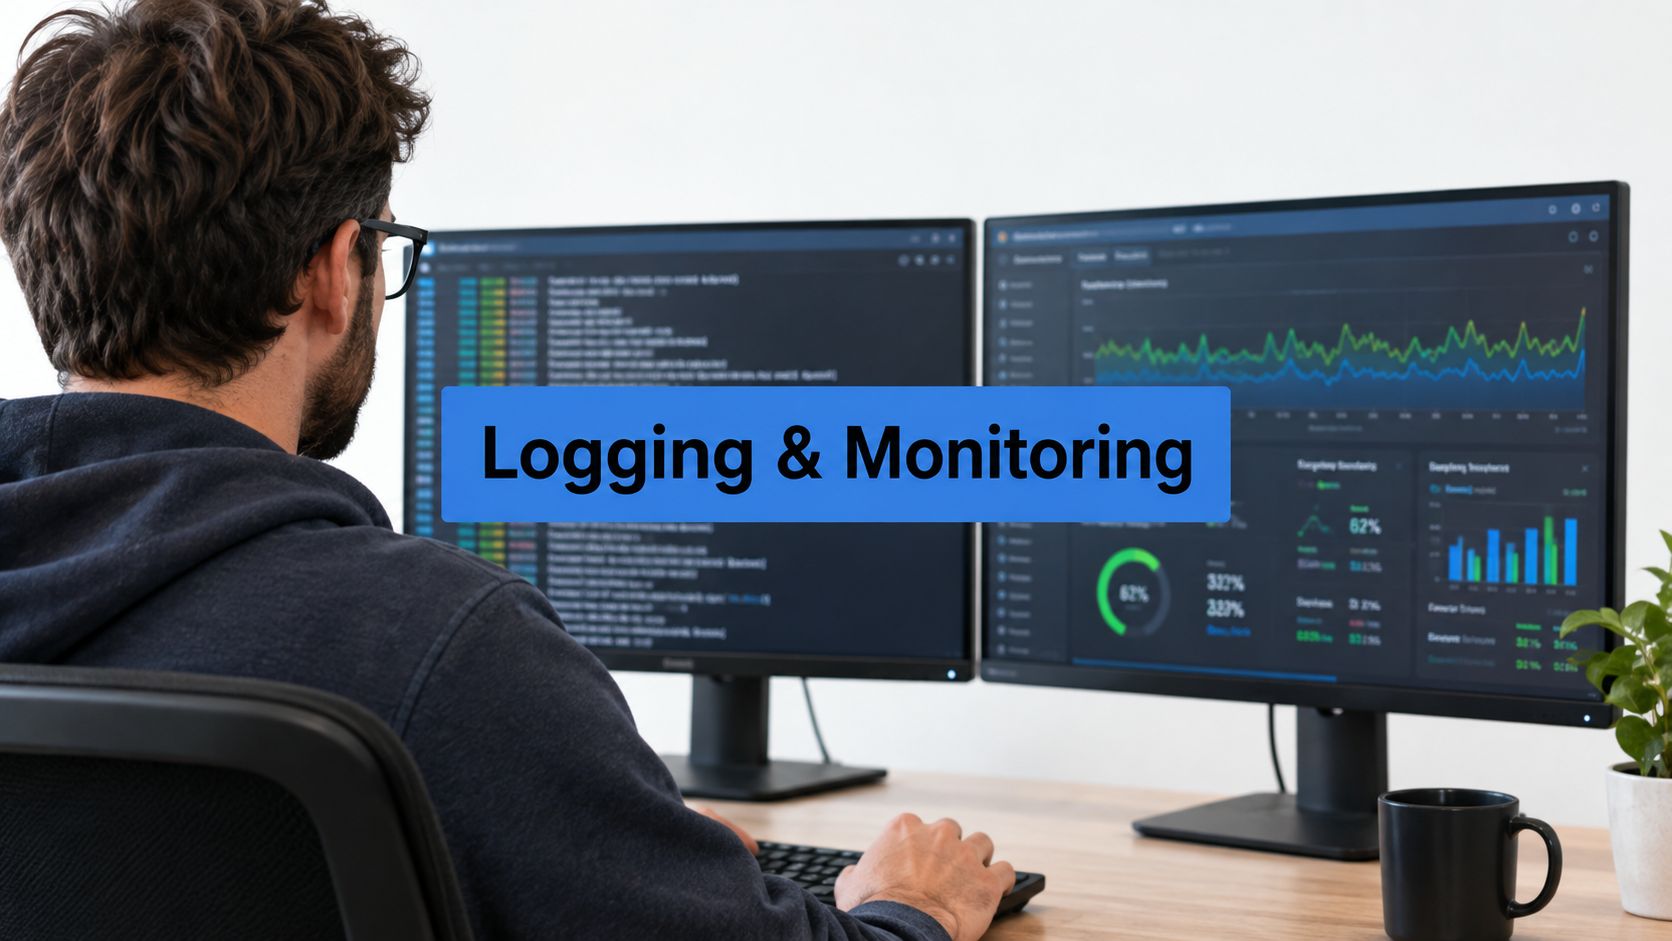
Logging records discrete events for diagnosis, while monitoring tracks system health metrics for detection. Both are required because monitoring can’t explain every failure, and logs can’t reliably tell an on-call engineer that a system is degrading right now.
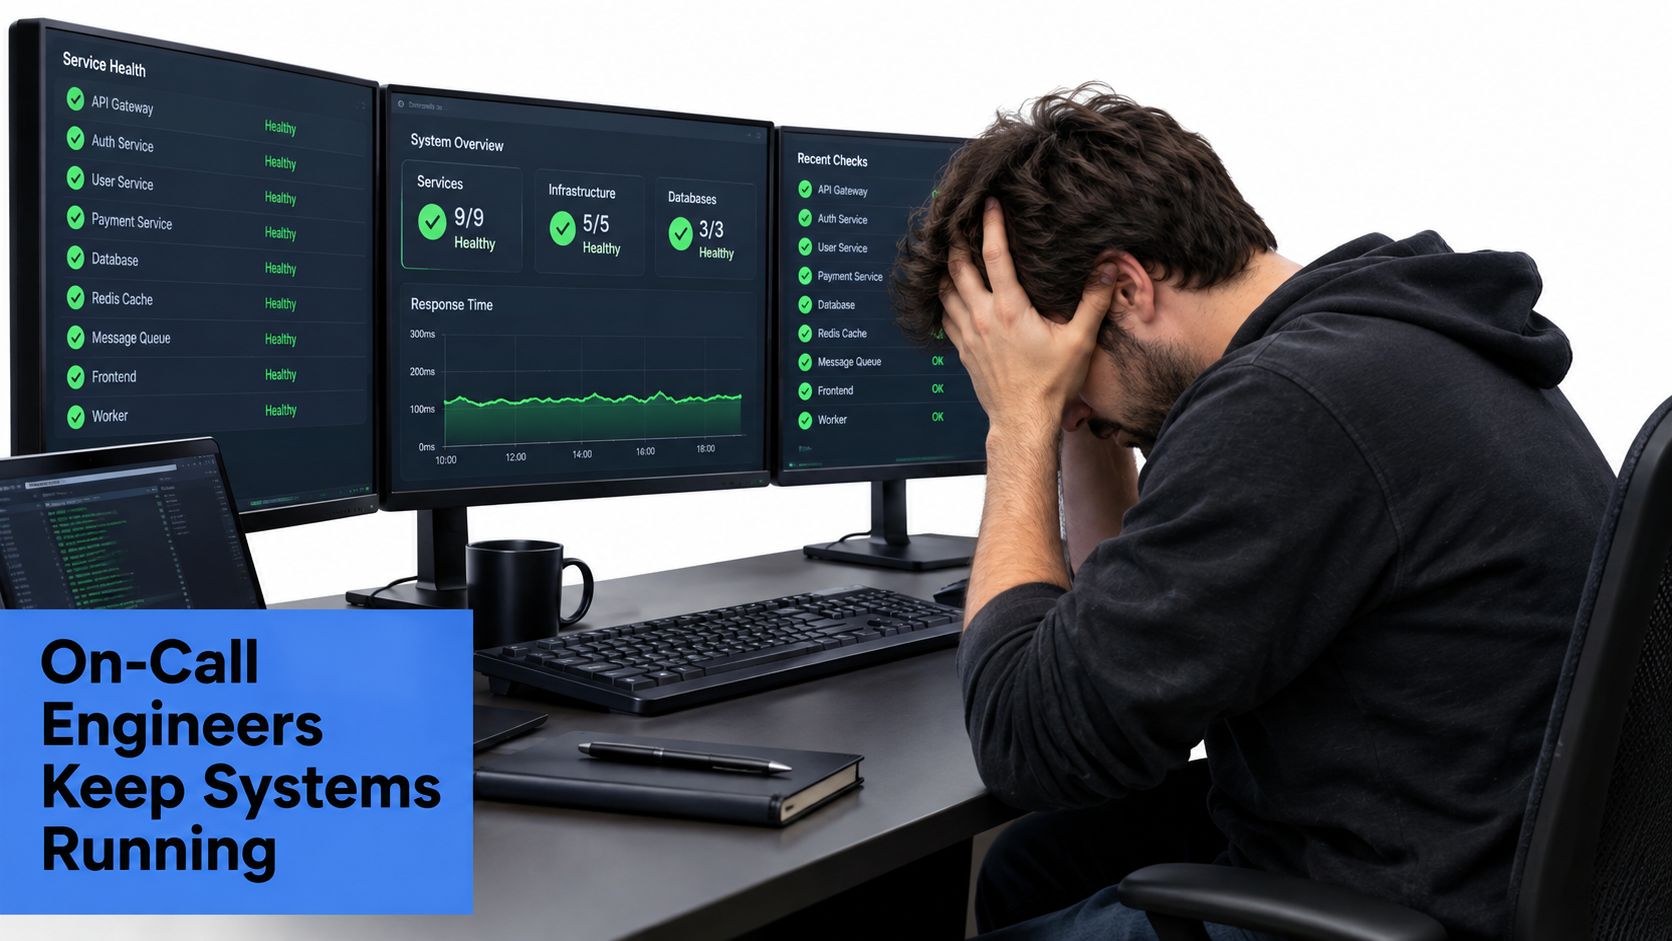
A familiar incident starts with a reassuring dashboard. Request volume looks normal, infrastructure health is green, and no obvious threshold has been crossed. Yet customers are receiving broken responses, a downstream dependency is rejecting requests, and the on-call engineer is searching through incomplete logs that contain no correlation context.
That gap is where incident response slows down. Monitoring tells you that a user journey or service is unhealthy. Logging helps explain which request, dependency, state change, or malformed response caused the problem. In distributed systems, neither source is enough by itself.
Why Your Incident Response Is Missing Critical Context
An outage rarely announces itself in a perfectly labeled error message. A request can return a technically successful response while delivering incorrect content. A queue can grow gradually before CPU becomes concerning. One tenant or payload class can fail while aggregate application metrics remain within their normal range.
Suppose an application release changes response serialization. The service still accepts traffic, returns responses, and consumes resources normally. The monitoring dashboard reports healthy availability, but users see incomplete data. Without structured logs containing the endpoint, response classification, payload context, and request correlation ID, the investigation becomes guesswork.
Detection and diagnosis answer different questions
Monitoring answers questions such as:
- Is demand changing? Traffic may rise, fall, or shift between endpoints.
- Is the service responding quickly enough? Latency distributions reveal slow requests that averages conceal.
- Are requests failing? Error metrics identify explicit failures and selected correctness failures.
- Is capacity tightening? Saturation shows pressure on CPU, memory, queues, storage, or database connections.
Logging answers a different set of questions:
- Which request failed?
- What did the service receive and return?
- Which dependency or state transition was involved?
- Can responders reconstruct the event sequence?
A dashboard full of aggregate metrics can show that a problem exists without exposing the affected user journey. A log platform can contain the relevant evidence but offer no timely signal that someone should investigate. The operational design must connect the two.
Practical rule: Use metrics to wake people up and structured logs to help them make the next decision.
The volume of data makes manual inspection unrealistic. A useful logging and monitoring system narrows the search automatically, preserves the context needed for diagnosis, and avoids burying responders under irrelevant events. That means defining the evidence required for known failure modes before an incident, then testing whether the system produces it.
Understanding the Difference Between Logging and Monitoring
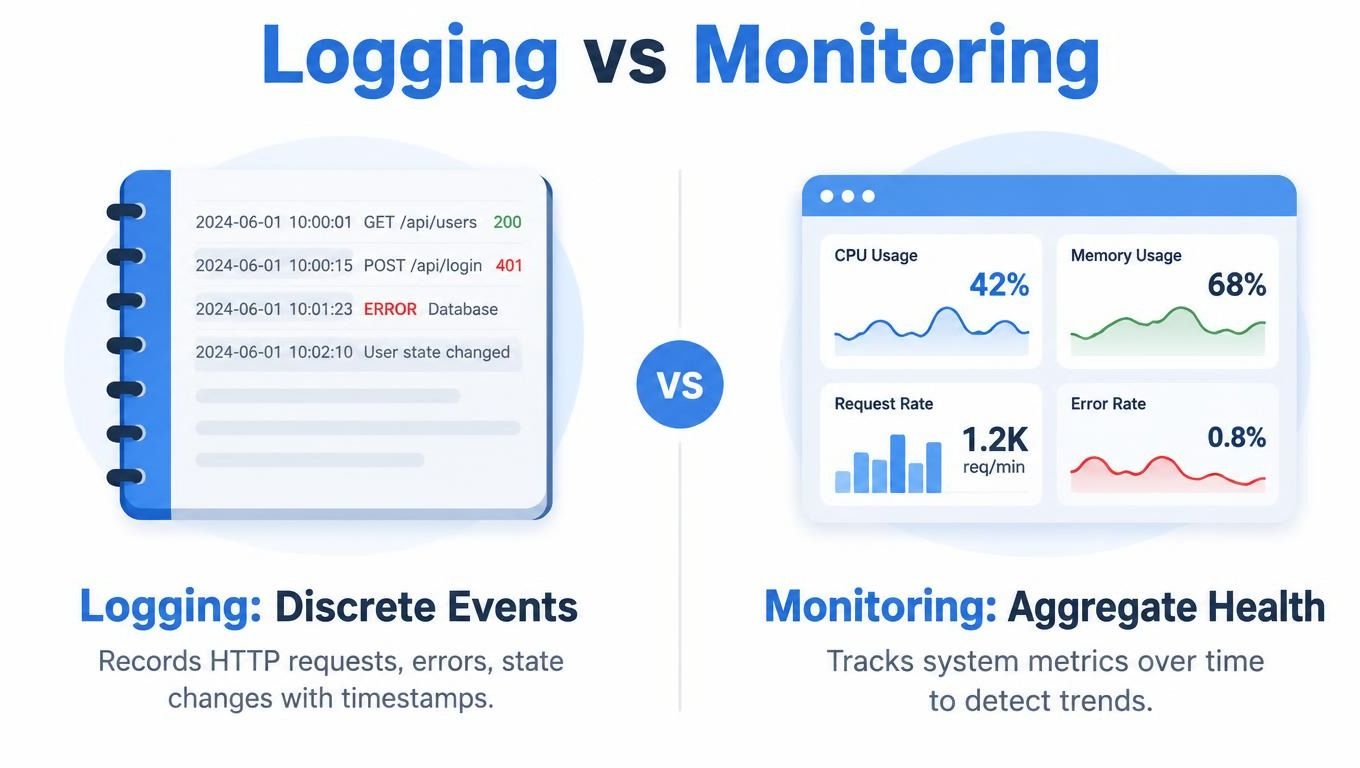
Logging records discrete events with timestamps. Typical events include HTTP requests, authentication decisions, dependency failures, configuration changes, queue operations, and application state transitions. Logs are detailed evidence, usually queried after a metric, alert, customer report, or deployment comparison identifies an area of concern.
Monitoring tracks aggregate health over time. It turns events and measurements into signals such as traffic volume, error rate, response-time distributions, and resource utilization. Monitoring is designed for detection, trend analysis, and alerting, not for preserving every detail of an individual transaction.
The difference is similar to a car dashboard and a black box recorder. The dashboard shows speed, warnings, and fuel status while you’re driving. The recorder preserves detailed events that can be examined afterward. A dashboard warning can prompt immediate action, but the recorder may reveal whether the driver braked, when the engine changed state, or what happened immediately before the fault.
Choose the primary tool by question
| Investigation question | Primary source | Why |
|---|---|---|
| Is the service receiving its expected demand? | Monitoring | Aggregate traffic shows changes in load and usage. |
| Are slow requests affecting users? | Monitoring | Histograms and percentiles expose response-time behavior. |
| Which request produced an incorrect response? | Logging | Event-level fields preserve request and response context. |
| Which dependency failed first? | Logging with correlation context | Related events can be followed across services. |
| Is a resource approaching a limit? | Monitoring | Resource and queue measurements support detection. |
| What changed during the incident? | Logs and deployment records | Timestamped events support reconstruction. |
Metrics alone can’t diagnose every root cause. Logs alone aren’t a dependable paging mechanism, especially when ingestion is delayed or the data is noisy. During a controlled traffic replay, GoReplay can help teams observe both sides of the system, comparing replay demand and response metrics while retaining request-level evidence for failed or mismatched responses.
The practical boundary is simple. Monitor the conditions that require attention, and log the details that let an engineer act once attention has been drawn.
The Four Golden Signals Every Team Should Track
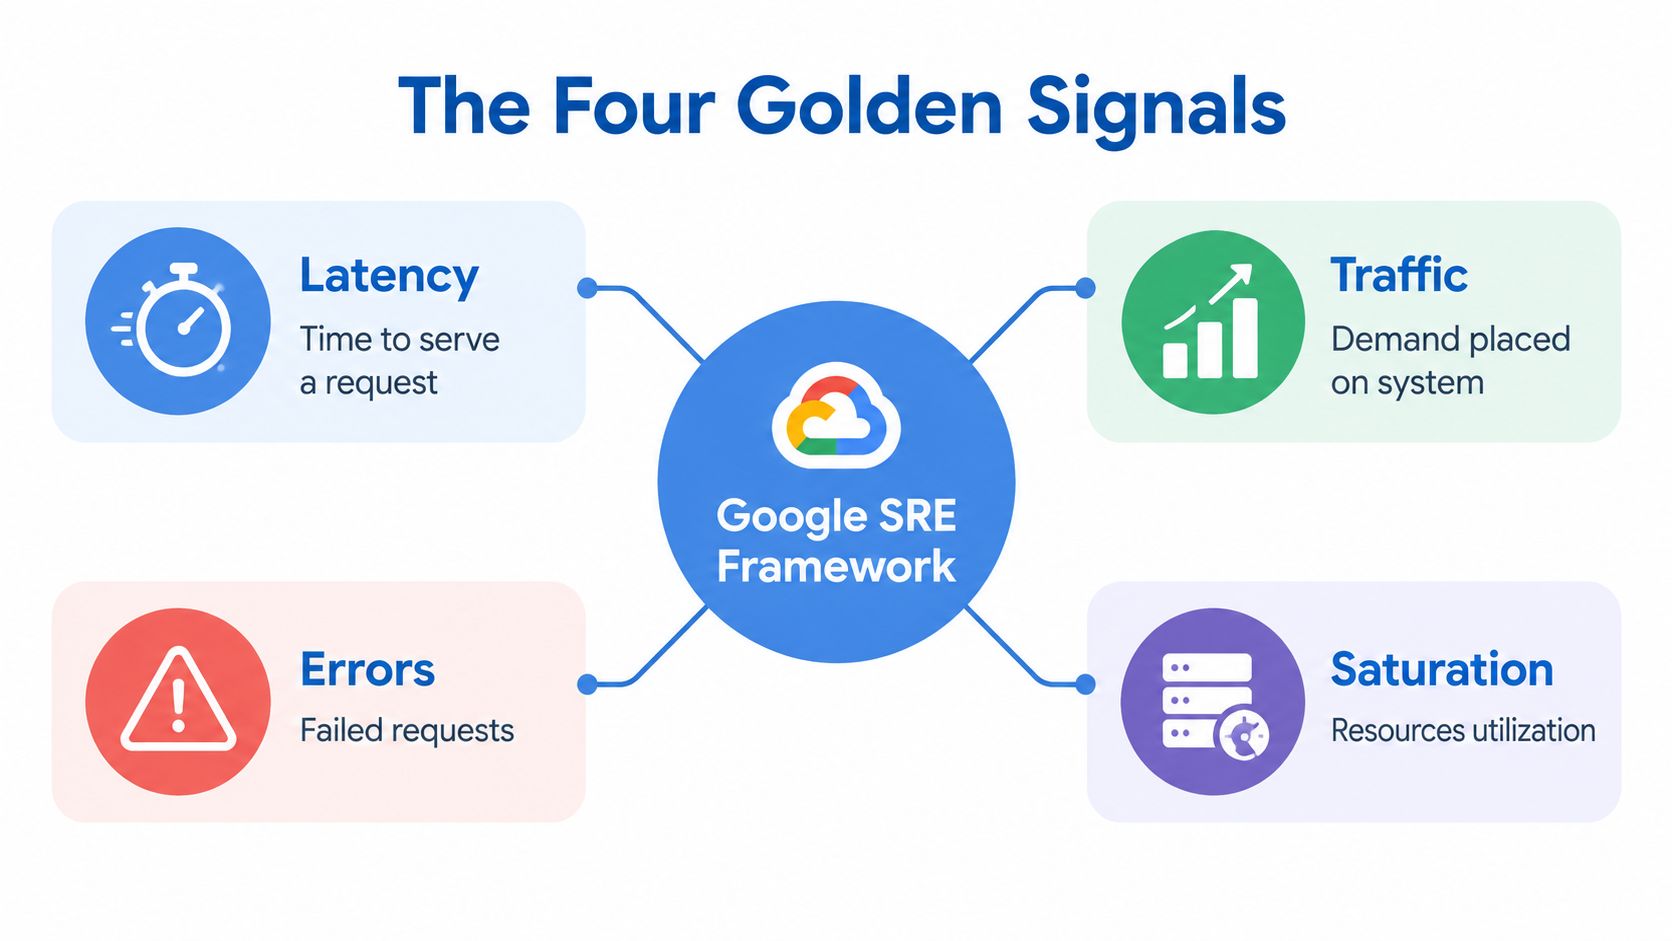
Google’s SRE monitoring framework provides a compact baseline for distributed systems: latency, traffic, errors, and saturation. Together, these signals describe responsiveness, demand, correctness, and remaining capacity.
Latency
Latency measures the time required to serve a request. Track it as a distribution, not just an average. Google’s practical alerting guidance explains why distributions and histograms expose tail behavior that an average can hide.
Separate successful and failed requests. A service that fails quickly may appear fast unless those failures are analyzed independently. During replay, preserve endpoint, method, status code, payload class, and relevant tenant or geographic context. A comparison between production and replay latency can reveal queueing, connection-pool exhaustion, or backend pressure.
Useful log fields include:
- Request timing: Start time, completion time, and measured duration.
- Request identity: Correlation ID, endpoint, method, and service name.
- Classification: Status code, payload class, tenant context, and dependency outcome.
Traffic
Traffic measures demand. Depending on the service, that may mean HTTP requests per second, transactions per second, or concurrent sessions. For replay testing, captured request volume becomes a realistic demand profile rather than an abstract load script.
Traffic needs context. An overall request count may look stable while one endpoint receives an unusual surge and another loses demand. Break the signal down by operation and preserve enough request metadata to explain the distribution without logging sensitive payload content unnecessarily.
Errors
Errors include explicit failures such as HTTP 500 responses and timeouts, but they also include technically successful responses that deliver incorrect content. That last category is easy to miss if the monitoring design counts status codes only.
Replay makes correctness testable. Compare expected and observed status codes, response structure, selected business fields, and dependency outcomes. Log mismatches with a correlation ID and a safe representation of the relevant request class, so engineers can investigate without retaining raw sensitive data.
Saturation
Saturation measures how close the constrained resource is to its limit. The bottleneck might be CPU, memory, disk, I/O, queues, or database connections. A service can show acceptable average latency while a queue or connection pool is steadily losing headroom.
During replay, monitor the target’s resource behavior alongside response metrics. Record resource pressure with enough labels to identify the affected service and test phase. The point isn’t to collect every host statistic. It’s to identify the resource that explains degraded behavior and determine whether the release remains safe under realistic demand.
Mapping replay volume to traffic, response distributions to latency, mismatches to errors, and resource utilization to saturation turns raw HTTP streams into evidence. That evidence is far more useful than a pass or fail result from a synthetic script that never exercises real request relationships.
Why Collecting Everything Makes Observability Worse
More telemetry sounds safer until the team has to search, index, retain, and pay attention to it. A 2025 Sawmills observability study reports that respondents actively used only 13% of collected telemetry, while 84% used less than one-quarter of what they gathered; the same study says 70% identified log ingestion and indexing as the largest contributors to rising observability costs. The study’s observability findings support an uncomfortable conclusion: unused data isn’t automatically harmless.
Over-collection creates operational trade-offs. Storage and indexing costs rise, queries become harder to focus, and teams may shorten retention or disable indexing to keep the system affordable. Once that happens, the organization can have broad nominal coverage and still lack the evidence needed during an incident.
Design logging around failure decisions
Start with the question an incident responder must answer. If the failure mode is high latency, a duration metric and a structured event for slow or anomalous requests may be more useful than logging every successful request at full detail. If the failure mode is a correctness mismatch, preserve the identifiers and response classification that allow the mismatch to be reproduced.
A useful policy distinguishes between:
- Always-on operational signals: Low-cardinality metrics for traffic, latency, errors, and saturation.
- Diagnostic events: Structured logs containing correlation IDs, dependency results, payload classes, and state transitions.
- High-cardinality detail: Data enabled selectively during controlled tests or incidents.
- Audit evidence: Records retained because a security, compliance, or operational decision depends on them.
The right retention period depends on incident patterns, legal obligations, and recovery needs. It shouldn’t be chosen merely because a logging platform makes a default setting convenient.
Measure evidence, not volume
Teams should ask whether a retained event changed an incident decision. A practical internal measure is detection value per gigabyte, assessed by linking logs to alerts, investigations, replay scenarios, and post-incident findings.
Traffic replay provides a safe way to challenge a logging policy before expanding it in production. Send representative request patterns through a test environment, inspect which fields explain mismatches or slow paths, and remove fields that add cost without improving a decision. The GoReplay observability best practices guide offers a relevant starting point for connecting traffic behavior with observability design.
The target isn’t minimal telemetry. It’s evidence that remains searchable, timely, understandable, and economically sustainable when people need it.
Alerting Best Practices That Reduce Operational Noise
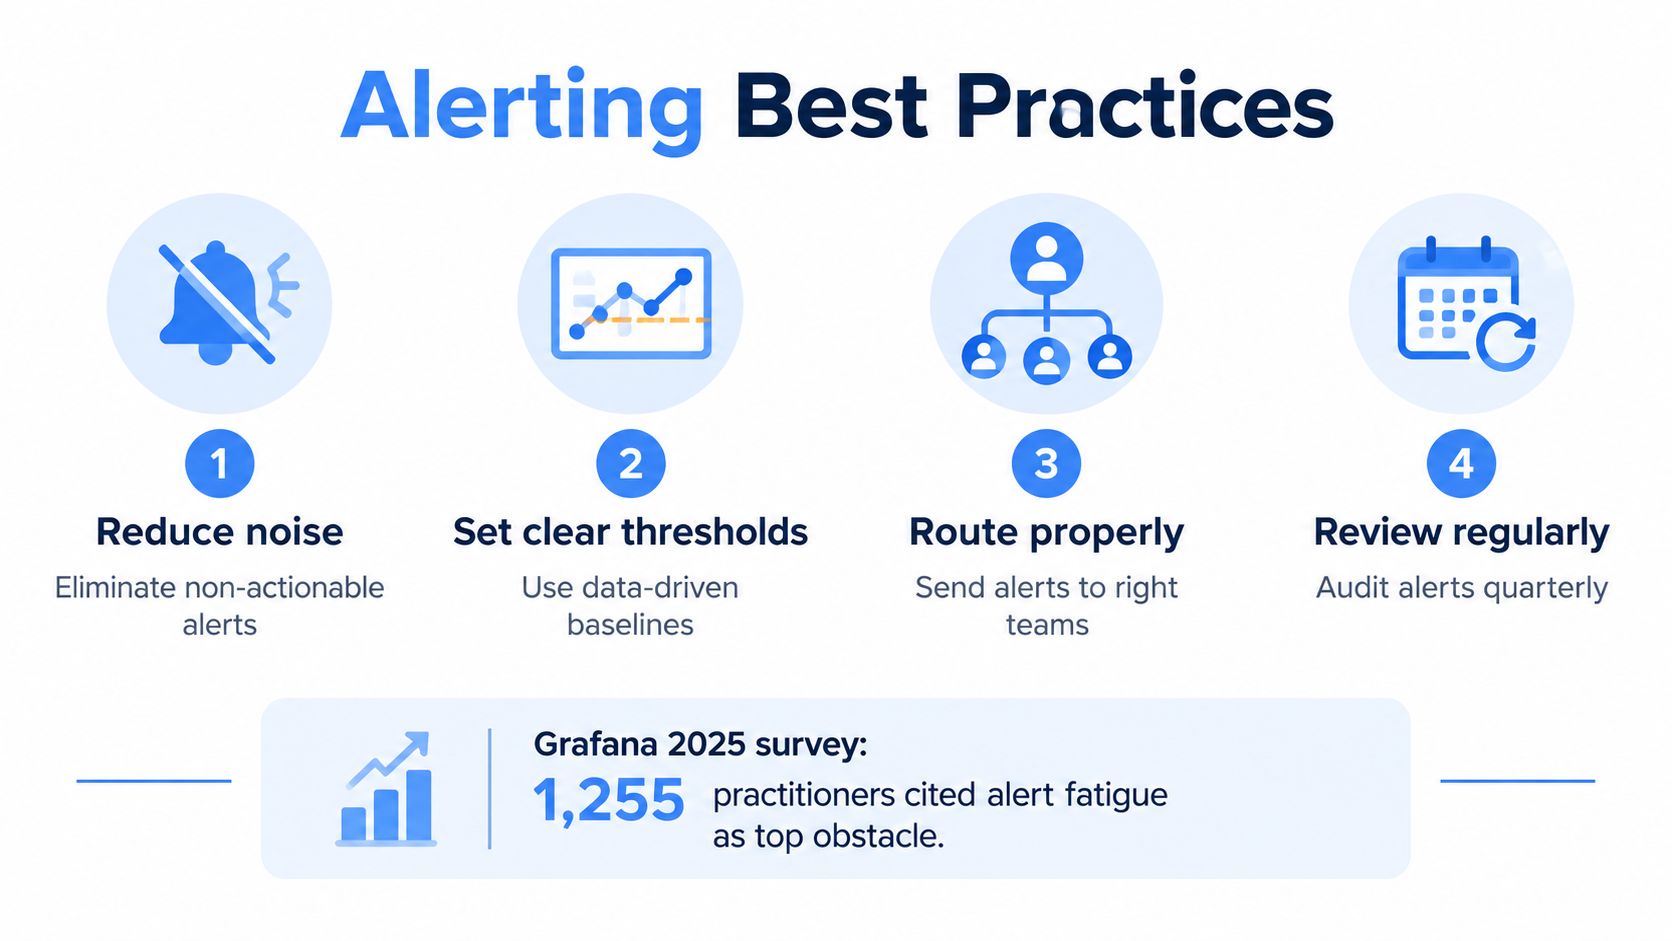
An alert is useful only when it changes what someone does. Grafana Labs’ global 2025 survey of 1,255 observability practitioners and leaders found that alert fatigue was the leading obstacle to faster incident response, ranking nearly twice as high as the next obstacle. Grafana’s survey takeaways point to a governance problem, not just a threshold problem.
More alerts can reduce response quality. Duplicate notifications compete with the original signal, unclear ownership delays acknowledgment, and maintenance activity can trigger warnings that nobody should act on. A smaller set of well-tested alerts is often more valuable than broad coverage that responders have learned to ignore.
Define what action an alert requires
Every alert should identify the affected service, the responsible team, the evidence that triggered it, and the first useful action. If no responder can describe what to do after receiving the notification, the condition may belong on a dashboard or in a trend report instead.
Review alerts against these operational questions:
- Precision: How often does the alert represent a real condition worth attention?
- Acknowledgment: Do responders recognize and accept it promptly?
- Escalation: Does it reach the person who can act?
- Duplication: Are multiple rules reporting the same underlying failure?
- Ownership: Is a current team responsible for maintaining it?
- Suppression: Do maintenance windows prevent expected, non-actionable notifications?
Use metrics for immediate detection when the event can be represented as a counter or distribution. Keep detailed structured logs for diagnosis and audit. Google’s monitoring workbook also emphasizes telemetry freshness, because stale data can delay incident response and logs may have inherent visibility delays.
Test alerts under realistic conditions
Synthetic checks are useful, but they don’t reproduce every interaction between endpoints, sessions, queues, and dependencies. A controlled replay can test whether a latency or error alert fires at the intended condition, whether the notification contains enough context, and whether the escalation route reaches the right team.
Test the failure path, not only the happy path. Introduce a known dependency failure, response mismatch, or capacity constraint in a safe environment, then verify that the alert fires once, carries actionable context, and resolves when the condition clears. If the alert doesn’t produce a useful response, change or remove it rather than adding another notification.
Using GoReplay to Validate Your Logging and Monitoring Pipelines
A release can pass unit tests and scripted load tests while failing under the sequence of requests that real users generate. Session-dependent behavior, endpoint interactions, connection reuse, queue buildup, and unusual payload classes often don’t appear in a carefully prepared synthetic scenario.
Traffic replay connects release validation with observability validation. Capture representative HTTP traffic, remove or mask sensitive data, and replay it against a test target while collecting the same operational signals used to judge production safety. The objective isn’t only to measure capacity. It’s to learn whether the telemetry explains what the system did.
Validate the signal chain
A practical replay exercise should check four layers:
- Request fidelity: Confirm that endpoint, method, session relationships, payload class, and relevant timing behavior are represented.
- Metric behavior: Compare traffic, latency distributions, errors, and saturation between the reference traffic and the target.
- Log usefulness: Verify that failed or mismatched requests contain correlation IDs, response classification, dependency context, and safe diagnostic fields.
- Alert response: Introduce controlled failure conditions and check precision, routing, acknowledgment, escalation, and recovery behavior.
GoReplay is one option for capturing and replaying live HTTP traffic into testing environments, where teams can inspect request outcomes and feed metrics or logs into their existing observability systems. Its testing environment setup guidance is useful when building a repeatable workflow around capture, masking, replay, and analysis.
The same principle applies outside software operations. Teams that monitor live systems, such as services tracking event performance, need trustworthy data that distinguishes current conditions from historical records. For readers evaluating that kind of dashboard, trusted live stats for CS2 provides an example of a resource centered on current event information rather than retrospective summaries.
A production-safety checklist
Before relying on a logging and monitoring pipeline, confirm that:
- Requests are safe to replay: Sensitive values are masked, and the target cannot affect real customers or production data.
- Time is comparable: Capture agents and test systems have synchronized clocks, and ingestion lag is measured.
- Context survives the path: Correlation IDs and request classifications remain available from capture through diagnosis.
- Distributions are visible: Percentiles and histograms expose tail latency instead of hiding it behind averages.
- Alerts are owned: Each notification has a responsible team, an action, an escalation path, and a review decision.
- Retention has a purpose: Every retained field supports detection, diagnosis, audit, or a documented business requirement.
- Replay changes decisions: The exercise demonstrates whether a release is safe and whether the telemetry is sufficient to explain the result.
Logging and monitoring work best when teams test them as part of the system, not as separate products configured after deployment. Use realistic traffic to identify missing context, noisy alerts, and expensive fields before those weaknesses appear during a customer-facing incident.
GoReplay captures and replays live HTTP traffic into testing environments, giving DevOps teams a practical way to validate request behavior, metrics, logs, and alerts before deployment. Visit GoReplay to evaluate how realistic traffic replay can make your logging and monitoring pipeline more actionable and production-safe.