Observability Best Practices: Improve System Reliability
In today’s complex, distributed systems, traditional monitoring is no longer enough. The ability to ask arbitrary questions about your system’s state without prior knowledge, the core of observability, has become critical for ensuring reliability, performance, and a superior user experience. Achieving this level of insight requires more than just installing tools; it demands a strategic approach grounded in proven observability best practices. Moving from reactive firefighting to proactive system optimization is a fundamental shift that separates high-performing engineering teams from the rest.
This guide provides a definitive roadmap. We will explore nine essential practices that modern engineering teams are adopting to master system visibility. You’ll get actionable insights on implementing the foundational pillars of metrics, logs, and traces, as well as advanced techniques like context-aware alerting and observability-as-code. We will also cover the cultural shifts necessary to embed these principles across your organization. Prepare to gain practical implementation details and real-world examples to build a robust observability strategy, ensuring your systems are not just running, but are truly understood. This listicle is designed to equip you with the knowledge to make immediate, impactful improvements to how you manage and comprehend your software.
1. Implement the Three Pillars of Observability
The foundation of any robust monitoring strategy rests on the “three pillars of observability”: metrics, logs, and traces. This framework, popularized by industry leaders like Cindy Sridharan and platforms such as Honeycomb, provides a holistic view of your system’s health by collecting and correlating three distinct but complementary data types. Adopting this as one of your core observability best practices ensures you can move from asking “Is the system down?” to “Why is the system slow for this specific user segment?”

This approach is not just theoretical; it’s a proven strategy used by top tech companies. Netflix, for instance, relies on all three pillars to diagnose issues within its complex microservices architecture, ensuring uninterrupted streaming for millions. Similarly, Uber correlates traces with metrics to fine-tune its ride-matching algorithms in real time.
How to Implement the Three Pillars
To get started, focus on collecting each data type and, most importantly, linking them together.
- Metrics: These are numerical representations of system health over time (e.g., CPU usage, error rates, request latency). Start here for a high-level overview and to establish performance baselines.
- Logs: These are immutable, time-stamped records of discrete events. They provide granular, context-rich details about what happened at a specific point in time, such as an error stack trace or a detailed user action.
- Traces: These track the entire lifecycle of a request as it travels through multiple services in a distributed system. A trace provides the “why” by showing the end-to-end journey, identifying bottlenecks, and illustrating service dependencies.
Key Insight: The real power emerges when you can seamlessly pivot between pillars. A spike in a metric (like latency) should allow you to drill down into the relevant traces, which then point you to the specific logs containing the root-cause error message. Use a universal correlation ID across all three data streams to make this connection possible.
2. Adopt Service Level Objectives (SLOs)
Beyond simply collecting data, a mature observability strategy focuses on what truly matters: the user experience. This is where Service Level Objectives (SLOs) come in. Popularized by Google’s Site Reliability Engineering (SRE) team, SLOs are specific, measurable targets for service reliability and performance that are defined from the perspective of your users. This practice shifts the conversation from internal metrics (like CPU load) to business-impactful outcomes (like successful user logins).

This user-centric approach is a cornerstone of reliability for major tech companies. Google applies SLOs across all its services, often targeting 99.9% availability. Dropbox uses SLOs to strike a critical balance between shipping new features and maintaining system stability, while Slack uses them to ensure its core message delivery performance consistently meets customer expectations. Adopting SLOs is one of the most impactful observability best practices for aligning technical work with business goals.
How to Implement SLOs
To begin, identify critical user journeys and define measurable indicators (SLIs) for them.
- Identify SLIs (Service Level Indicators): Start with simple, user-facing metrics. Good starting points include availability (e.g., the proportion of successful HTTP requests) or latency (e.g., the percentage of requests served under 300ms).
- Define Your SLO: Set a target for your SLI over a specific period. For example, “99.9% of homepage requests will be successful over a rolling 28-day window.”
- Calculate Your Error Budget: The SLO automatically creates an “error budget,” which is the amount of unreliability you can tolerate (100% - SLO). For a 99.9% SLO, your error budget is 0.1%. This budget empowers teams to decide when to innovate and when to focus on reliability.
- Review and Iterate: Start with a conservative SLO, perhaps just below your current performance, to get comfortable with the process. Review and adjust your SLOs quarterly to reflect evolving business needs and user expectations.
Key Insight: Error budgets are the most powerful outcome of setting SLOs. They provide a data-driven framework for making trade-off decisions. If you have a healthy error budget remaining, your team can confidently ship new features or perform risky maintenance. If the budget is depleted, all efforts should pivot to improving reliability until the SLO is met again.
3. Implement Structured Logging with Context
Traditional logs, often just lines of plain text, become nearly impossible to search and analyze at scale. Structured logging solves this by enforcing a consistent, machine-readable format like JSON. This practice transforms logs from chaotic strings into queryable datasets, making it one of the most impactful observability best practices. By enriching these logs with rich contextual data-such as user IDs, request IDs, and business transaction details-you can pinpoint issues with surgical precision.

This approach is championed by platforms like Elastic and Splunk because it unlocks powerful analytics. For example, GitHub uses structured logging to monitor complex Git operations and API requests, allowing them to quickly filter logs by repository or user. Similarly, Stripe embeds detailed context into its logs to trace payment processing issues across its distributed systems, drastically reducing debug time.
How to Implement Structured Logging
Adopting this practice requires standardization and a focus on enriching data at the source.
- Standardize Your Schema: Define an organization-wide logging standard that includes required fields like
timestamp,service_name,log_level, and acorrelation_id. This ensures consistency across all teams and services. - Enrich with Context: Go beyond basic fields. Include business-specific context, such as
user_id,tenant_id, ororder_id. This allows you to search for all log events related to a specific user’s failed transaction. - Use Logging Libraries: Create or adopt standardized logging libraries for your programming languages. This makes it easy for developers to generate compliant, structured logs without boilerplate code, ensuring consistency.
Key Insight: The goal is to make your logs as valuable as your metrics and traces. A well-structured log with a
correlation_idshould link directly back to a specific trace, enabling you to see the exact state and context of a service at the moment an error occurred. This turns your logs from a last resort into a primary diagnostic tool.
4. Deploy Distributed Tracing
While metrics tell you that a problem exists and logs tell you what happened at a single point, distributed tracing tells you why and where a request slowed down or failed across your entire system. This monitoring technique is crucial for modern, complex microservices architectures. It tracks a single request as it travels through multiple services, databases, and APIs, creating a complete, end-to-end visualization of its journey. This makes it an indispensable observability best practice for debugging performance issues.
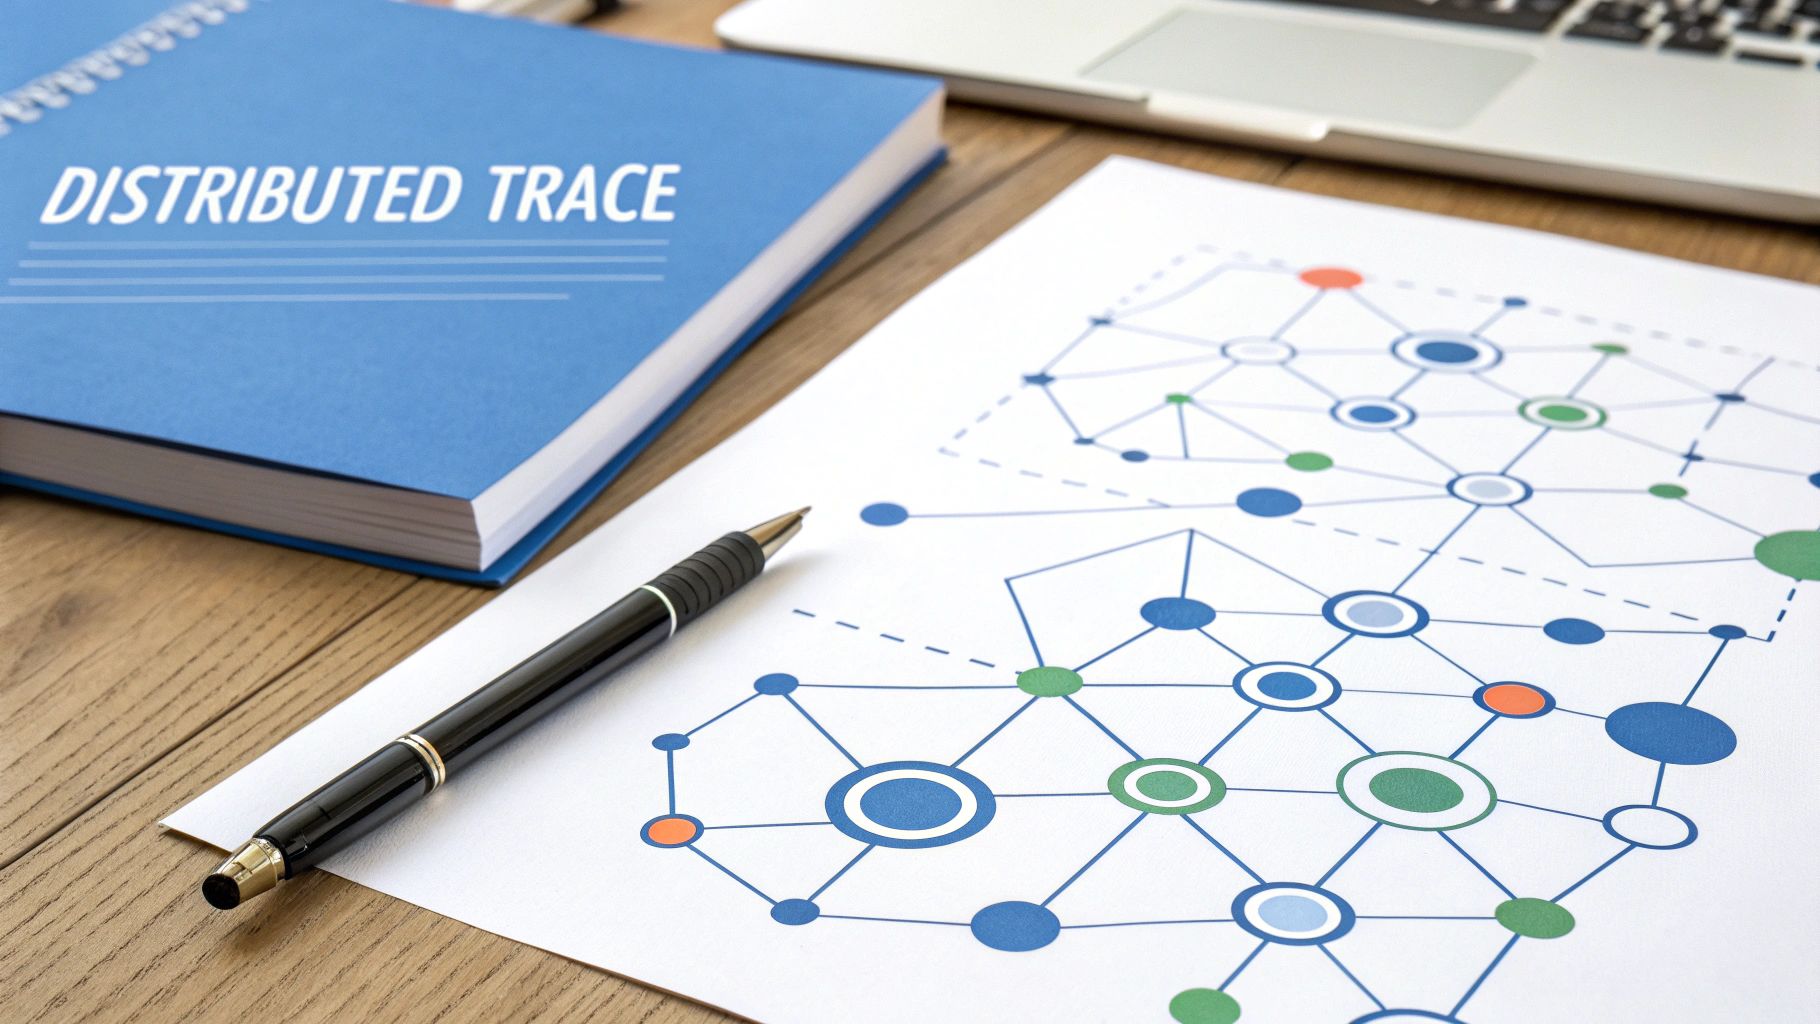
Pioneered by concepts like Google’s Dapper and projects like Twitter’s Zipkin, this practice is now a standard for tech leaders. Lyft, for instance, uses Jaeger (an open-source project started by Uber) to trace and optimize ride requests as they propagate across more than 100 microservices. Similarly, Shopify leverages tracing to pinpoint and resolve bottlenecks in its critical checkout flow, ensuring a smooth customer experience.
How to Implement Distributed Tracing
Effective tracing implementation involves strategic instrumentation and data management. Start by focusing on the most critical user-facing paths to gain immediate value.
- Start with High-Value Flows: Don’t try to trace everything at once. Begin by instrumenting critical, user-facing request paths like user login, product search, or the payment process. This provides the most significant impact on user experience.
- Use OpenTelemetry: Adopt OpenTelemetry for vendor-neutral instrumentation. This open-source framework allows you to instrument your code once and send telemetry data to any compatible backend, avoiding vendor lock-in and future-proofing your observability stack.
- Implement Intelligent Sampling: Tracing every single request can be prohibitively expensive and generate overwhelming amounts of data. Use intelligent sampling strategies (e.g., head-based or tail-based sampling) to capture a representative subset of traces, focusing on slow or erroneous requests.
Key Insight: The goal of distributed tracing is not just to see the path but to analyze it. Focus on critical path analysis to identify which service calls in a long chain contribute the most to overall latency. This allows you to prioritize optimization efforts where they will have the greatest effect on performance.
5. Establish Context-Aware Alerting
An effective alerting strategy moves beyond simple, static thresholds to become context-aware. This advanced approach reduces alert fatigue by considering multiple signals, environmental context, and business impact before triggering notifications. Instead of a noisy alert for a momentary CPU spike, a context-aware system asks, “Does this spike correlate with increased user-facing errors or a drop in conversions?” This is one of the most critical observability best practices for teams looking to focus on signals that genuinely matter.
This methodology is championed by industry leaders who manage complex, large-scale incidents. PagerDuty, for example, uses machine learning to cluster related alerts into single, context-rich incidents. Similarly, Datadog allows engineers to create composite monitors that only fire when multiple conditions are met simultaneously, such as high latency and a low success rate on a critical API endpoint.
How to Implement Context-Aware Alerting
Start by enriching your alert triggers with additional data points to make them smarter and more actionable.
- Correlate Technical and Business Metrics: Don’t just alert on CPU usage. Trigger an alert when high CPU usage correlates with a drop in completed user checkouts. This directly connects system health to business impact.
- Implement Composite and Multi-Window Alerts: Create rules that require multiple failures before firing. For example, alert only if the p99 latency for your
/api/v1/loginendpoint exceeds 500ms for more than five consecutive minutes. This avoids alerts for transient, self-correcting blips. For a deeper dive into this, you can explore this essential guide to API monitoring. - Factor in System State and Time: A non-critical service failing during a planned maintenance window at 3 AM should not wake up the on-call engineer. Alerts should be intelligent enough to understand deployment schedules, dependencies, and business hours.
Key Insight: The goal is to evolve from “is something broken?” to “is something broken that matters right now?” Start with simple composite rules and gradually incorporate more sophisticated context, like anomaly detection based on historical patterns. Regularly review your alert rules and tune them based on the false positive rate and team feedback.
6. Implement Observability as Code
To ensure that your monitoring is as reliable and scalable as your applications, it’s crucial to adopt Observability as Code (OaC). This practice involves managing observability configurations, including dashboards, alerts, and instrumentation, through version-controlled code rather than manual UI clicks. Treating your observability setup with the same discipline as your application code is one of the most advanced observability best practices, enabling code reviews, automated testing, and repeatable deployments.
This approach brings the principles of Infrastructure as Code to the world of monitoring. For example, GitLab manages all its Prometheus configurations and Grafana dashboards as code, ensuring consistency across environments. Similarly, Shopify uses Terraform to deploy and configure its monitoring infrastructure alongside the applications it supports, preventing configuration drift.
How to Implement Observability as Code
Getting started with OaC involves gradually codifying your monitoring components and integrating them into your existing CI/CD pipelines.
- Version Control Everything: Start by defining your alerting rules and dashboard configurations in a declarative format (like JSON or YAML) and committing them to a Git repository. This provides a clear audit trail and rollback capabilities.
- Use Provisioning Tools: Leverage tools like Terraform, Ansible, or specialized Kubernetes operators (e.g., the Prometheus Operator) to automate the deployment and management of your observability stack.
- Create Reusable Templates: Develop standardized templates and libraries for common observability patterns. For instance, create a Terraform module that deploys a service along with its pre-configured dashboards and alerting rules, ensuring consistency for every new microservice.
Key Insight: Observability as Code transforms monitoring from a manual, error-prone task into a systematic, automated process. The key is to integrate observability configuration into your development lifecycle. When a developer adds a new feature, the corresponding monitoring checks and dashboard panels should be included in the same pull request, ensuring observability keeps pace with development.
7. Practice Intelligent Sampling and Data Management
As systems scale, the volume of telemetry data can grow exponentially, leading to prohibitive storage costs and performance overhead. A critical observability best practice is to move beyond collecting all the data and instead focus on collecting the right data. Intelligent sampling and strategic data management allow you to capture high-value signals while discarding low-value, redundant information, ensuring your observability platform remains both insightful and cost-effective.
This strategy is championed by industry leaders like Honeycomb and Jaeger, who have built their platforms around the idea that not all data is created equal. For example, Honeycomb’s dynamic sampling retains 100% of traces containing errors or anomalies while intelligently sampling routine, successful requests. Similarly, the open-source Jaeger tracing system implements both probabilistic and adaptive sampling to manage data load in high-throughput environments without losing critical visibility.
How to Implement Intelligent Sampling
Effective sampling isn’t about random data reduction; it’s about making deliberate, context-aware decisions.
- Head-Based Sampling: This approach makes a sampling decision at the beginning of a trace, before all its spans have been collected. It’s simple to implement and useful for managing volume based on known patterns, like sampling 10% of all requests to a specific endpoint.
- Tail-Based Sampling: Here, the decision to keep or drop a trace is made after all its spans have been collected. This method is more resource-intensive but far more powerful, as it allows you to keep 100% of traces that exhibit interesting behavior, such as high latency or errors, regardless of their initial volume.
- Data Tiering and Retention: Not all data needs to be kept for the same duration. Implement tiered retention policies where critical data (like error traces) is stored for longer periods in hot, fast storage, while less critical summary data is moved to cheaper, cold storage or aggregated.
Key Insight: Your sampling strategy should never be “set it and forget it.” Always retain 100% of errors and anomalies. Regularly review post-incident reports to determine if your sampling rules caused you to miss important data. If so, adjust your configuration. The goal is to maximize insight per dollar spent, not just to reduce data volume.
8. Build Comprehensive Dashboards and Visualization
Raw observability data is only useful if it can be understood at a glance. Effective dashboards and visualizations are crucial for transforming streams of metrics, logs, and traces into actionable insights. This observability best practice involves creating layered, role-specific dashboards that provide different views of system health for various stakeholders, from high-level business metrics for executives to detailed technical diagnostics for engineers.
This approach, championed by visualization leaders like Grafana Labs and data expert Stephen Few, prevents information overload. For example, Etsy uses layered dashboards to connect business KPIs, such as sales volume, directly to underlying technical performance metrics. Similarly, Spotify creates tailored dashboards for product teams, infrastructure engineers, and even artist relations managers, ensuring everyone sees the data most relevant to their role.
How to Build Better Dashboards
The goal is to present information clearly and contextually, guiding users from a high-level overview to the root cause of an issue.
- Follow the Inverted Pyramid: Start dashboards with the most critical, high-level summary widgets at the top (e.g., overall service health, key business metrics). Allow users to drill down into more detailed, granular data visualizations as they scroll or click through.
- Design for Roles: Create specific dashboards for different teams. An SRE needs to see CPU saturation and latency percentiles, while a product manager might care more about user sign-up funnels and feature adoption rates.
- Provide Context: A number without context is meaningless. Display metrics alongside historical trends, defined thresholds (e.g., SLOs), and annotations for deployments or incidents. Use consistent color schemes to signify states like “healthy,” “warning,” and “critical.”
- Regularly Prune and Refine: Dashboards should be living documents. Regularly review usage analytics to identify and remove unused or confusing widgets. This keeps them relevant and reduces cognitive load for everyone.
Key Insight: A great dashboard tells a story. It should guide the viewer from a symptom to a cause without requiring them to manually cross-reference multiple systems. By designing with intent and focusing on clarity over density, you empower your teams to make faster, data-driven decisions.
9. Establish Observability Culture and Practices
Tools and technologies are only half the battle; the most effective observability best practices are deeply embedded in an organization’s culture. This means shifting from a reactive, tool-centric mindset to one where observability is a shared responsibility and a first-class citizen in the entire software development lifecycle. This cultural practice, championed by leaders like Charity Majors and the Google SRE team, transforms observability from a niche task for operations into a core competency for every engineer.
This approach is about creating a system where developers are empowered to understand the production behavior of their own code. For example, Spotify’s “Squad Model” gives autonomous teams end-to-end ownership, including the observability of their services. Similarly, Capital One established a Center of Excellence to standardize practices and evangelize the value of observability across the company, ensuring consistent, high-quality instrumentation.
How to Build an Observability Culture
Cultivating this mindset requires a deliberate, organization-wide effort that ties technical practices to business outcomes.
- Start Small and Showcase Wins: Identify a few enthusiastic early-adopter teams. Help them succeed and then widely publicize their wins, such as how they reduced incident resolution time or improved a key business metric.
- Integrate into Your “Definition of Done”: Make instrumentation and observability a non-negotiable part of feature development. A feature isn’t complete until it has adequate logging, metrics, and tracing to verify its behavior in production.
- Provide Hands-On Training: Go beyond theoretical presentations. Offer workshops, pairing sessions, and mentorship to teach engineers how to use observability tools effectively and ask the right questions of their systems. This complements other quality initiatives, much like modern software testing best practices.
Key Insight: Observability is not just for incident response; it’s a powerful tool for product development and business intelligence. When teams are trained to explore production data, they can validate hypotheses, understand feature adoption, and directly connect system performance to user experience, turning a technical practice into a strategic advantage.
Observability Best Practices Comparison
| Item | Implementation Complexity 🔄 | Resource Requirements ⚡ | Expected Outcomes 📊 | Ideal Use Cases 💡 | Key Advantages ⭐ |
|---|---|---|---|---|---|
| Implement the Three Pillars of Observability | High - Correlating metrics, logs, and traces | High - Significant storage & processing needed | Comprehensive system visibility & faster root cause analysis | Large-scale, complex distributed systems | Unified data correlation; industry-standard |
| Adopt Service Level Objectives (SLOs) | Medium - Requires SLI selection and target setting | Medium - Tracking and alerting infrastructure | Clear reliability targets; aligned engineering & business goals | User-centric reliability management | Focus on user impact; reduces alert fatigue |
| Implement Structured Logging with Context | Medium - Requires standardized formats & discipline | Medium - Increased log volume and storage | Enhanced querying, automated analysis, and debugging efficiency | Services needing rich contextual log insights | Powerful querying; better observability integration |
| Deploy Distributed Tracing | High - Instrumentation across all services | High - Large trace data and added latency | End-to-end request flow visibility; latency & bottleneck ID | Microservices with complex request flows | Precise latency analysis; service dependency insight |
| Establish Context-Aware Alerting | High - Complex correlation and contextual rules | Medium-High - Advanced tooling and expertise needed | Reduced false positives; improved incident response | Environments requiring targeted, business-aware alerts | Reduces alert fatigue; actionable notifications |
| Implement Observability as Code | Medium-High - Requires tooling and process changes | Medium - Development effort for automation | Consistent, auditable, and collaborative observability configs | Teams adopting DevOps; multi-environment setups | Consistency; audit trails; automated recovery |
| Practice Intelligent Sampling and Data Management | Medium - Tuning sampling & retention policies | Medium - Optimizes storage and query performance | Cost-efficient observability with critical data preserved | High-volume observability data environments | Cost reduction; scalable data management |
| Build Comprehensive Dashboards and Visualization | Medium - Designing layered and role-specific views | Medium - Ongoing maintenance and updates | Immediate and role-tailored system health insights | Organizations needing diverse stakeholder transparency | Faster problem resolution; data-driven decisions |
| Establish Observability Culture and Practices | High - Organizational change and training needed | Low-Medium - Investment in training & process | Sustainable observability; improved reliability & proactive ops | Enterprises embedding observability in culture | Shared ownership; reduces specialized dependencies |
Integrating Your Practices for Holistic Observability
Embarking on the path to mature observability is a transformative journey, not a destination with a finite end. We’ve explored a comprehensive suite of observability best practices, from the foundational three pillars to the cultural shifts required for sustained success. The true power of these concepts, however, is not realized in isolation but through their synergistic integration into a unified, cohesive strategy.
Adopting structured logging, for example, is a significant step forward. But when those structured logs are correlated with distributed traces, you unlock a new dimension of diagnostic power. A single trace ID can instantly connect a high-level user action to the specific log entries generated by every service involved, transforming a needle-in-a-haystack search into a direct, targeted investigation. This integration is where reactive problem-solving becomes proactive system improvement.
From Siloed Data to a Unified Narrative
The goal is to weave these individual practices into a single, compelling narrative about your system’s health and behavior. This narrative is built upon a continuous feedback loop where each practice strengthens the others:
- Logs and Traces Inform SLOs: The detailed data from logs and traces provide the raw material to define meaningful Service Level Objectives (SLOs). You can move beyond simple uptime to create nuanced SLOs based on specific user journey latencies or error rates for critical API endpoints.
- SLOs Drive Alerting: Your SLOs, in turn, become the backbone of a context-aware alerting strategy. Instead of reacting to arbitrary CPU spikes, your alerts fire based on a genuine threat to the user experience, as defined by your error budget consumption. This dramatically reduces alert fatigue and focuses your team on what truly matters.
- Dashboards Visualize the Whole Story: Comprehensive dashboards bring this all together. They don’t just display siloed metrics; they visualize SLO performance, highlight relevant traces when thresholds are breached, and provide deep links into your logging platform for root cause analysis.
This integrated approach shifts your organization’s posture from passive monitoring, where you wait for things to break, to active, insightful exploration. You empower your teams to ask novel questions of your systems and get immediate, data-backed answers.
Proactive Validation: The Final Piece of the Puzzle
The ultimate test of any observability strategy is its effectiveness in the face of real-world complexity. This is where proactive validation becomes indispensable. Tools that capture and replay real production traffic, such as GoReplay, close the loop between your observability setup and production reality.
By replaying real user traffic against a staging environment, you can pressure-test your entire observability stack. This practice allows you to identify blind spots before they impact users: a critical transaction without adequate tracing, a missing contextual field in your logs, or a dashboard that fails to represent a crucial failure mode. This final integration of proactive, realistic testing with your established observability best practices is what enables your teams to build, deploy, and operate complex systems with unwavering confidence and precision.
Ready to bridge the gap between your staging environment and production reality? GoReplay helps you capture and replay real user traffic to validate your observability instrumentation, test performance changes, and eliminate deployment risks. See how you can enhance your observability best practices by visiting GoReplay today.