
Elasticity Testing How to Plan Run and Evaluate at Scale

Your autoscaler says the service is healthy. The dashboard says capacity is increasing. Customers still see timeouts while new instances boot, readiness checks pass too early, and the policy scales back down before the traffic has settled. The system can scale, but it can’t scale in time.
That’s the operational gap elasticity testing needs to expose. A useful test doesn’t ask only whether a platform adds resources. It asks whether provisioned capacity follows real demand during a spike, step ramp, growth trend, and sustained load, then contracts without instability. This guide treats timing, traffic shape, probes, cooldowns, and production-traffic replay as first-class test variables.
What Elasticity Testing Really Validates
A service can pass a scalability test and still fail an elasticity test. The difference is timing. Scalability shows whether added resources increase capacity. Elasticity testing adds time to the question: does the system provision and remove capacity closely enough to follow changing demand before users experience degradation?
That distinction appears during a sudden campaign, a queue backlog, or a product launch. A service may have enough total capacity on paper but still fail while new instances start, readiness checks pass, or connections warm. It can also overreact, create excess capacity, and scale down while demand is still rising.
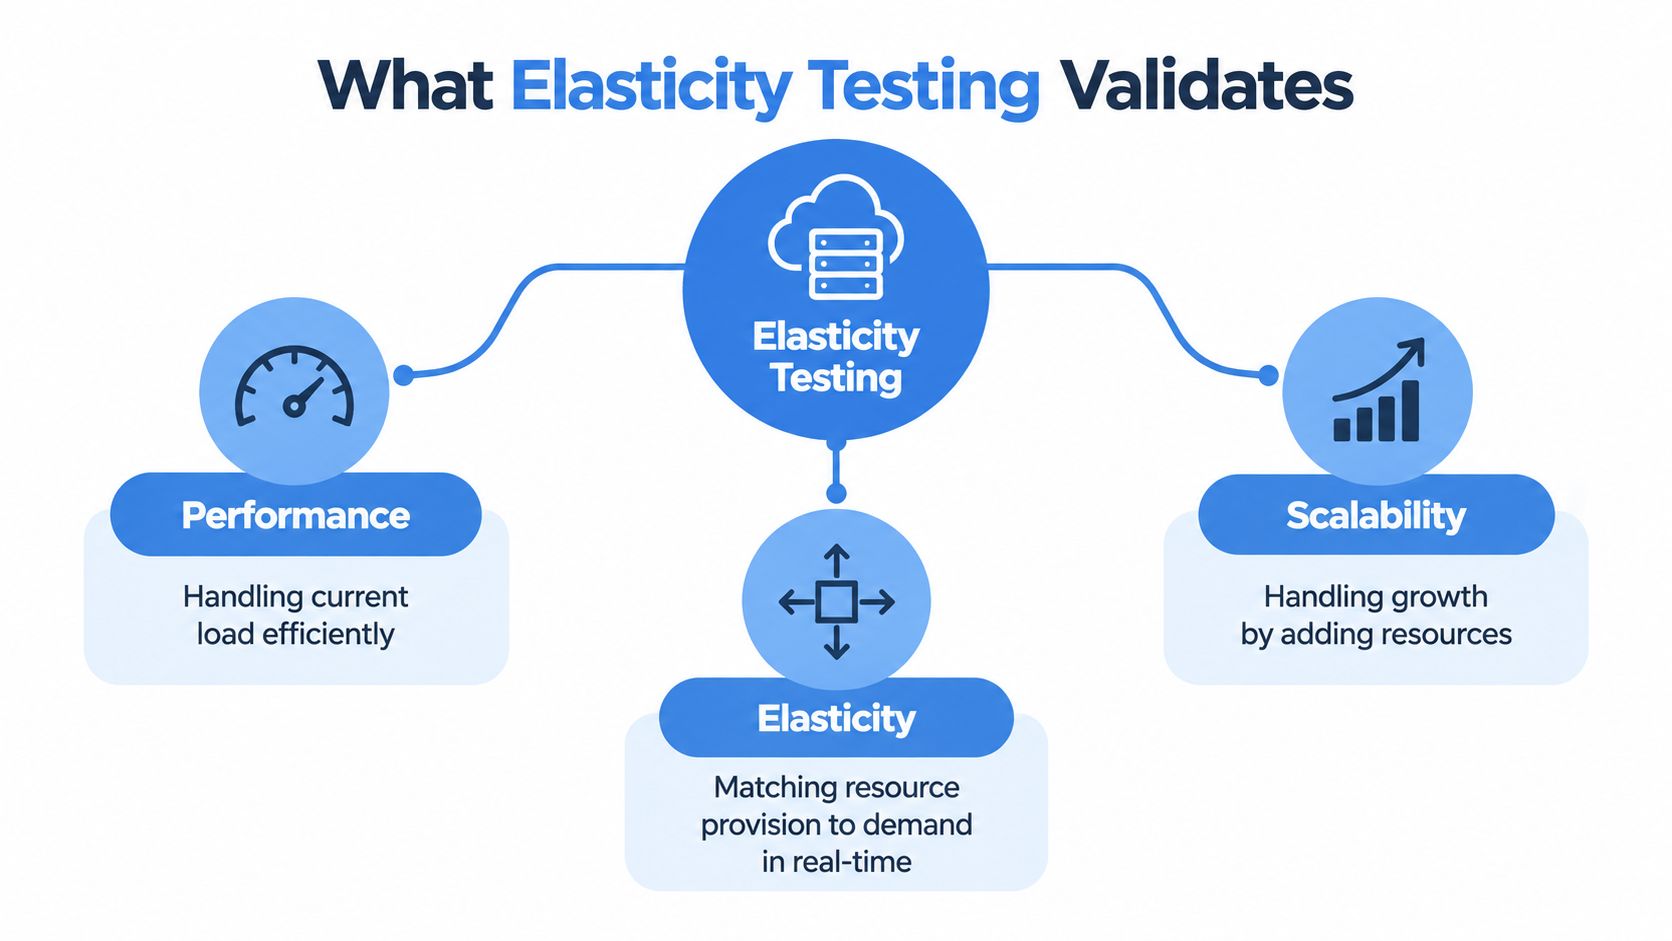
The three questions behind the test
Performance asks whether the current system handles its workload efficiently. Track latency, error rate, saturation, queue behavior, and the point at which user-facing performance starts to degrade.
Scalability asks whether capacity grows when resources are added. Compare a fixed deployment with a larger one, or measure how additional replicas change processing capacity under a stable workload.
Elasticity asks whether supply tracks demand dynamically. The system must provision and de-provision resources so available capacity follows demand closely enough for the service’s risk profile, a framing discussed in the SPEC Research elasticity benchmarking paper.
A useful test compares two timelines. One is demand generated, such as incoming requests, work entering a queue, or active sessions. The other is resource supply, including replicas, CPU, memory, connections, and ready capacity. Overlay them to expose reaction delay, overshoot, and premature scale-down. Test a sharp spike, a step increase, and a soak with production-traffic replay. Each shape exercises different probe and cooldown behavior.
Why measurement beats confidence
Autoscaling policies interact with startup time, readiness probes, metric windows, stabilization periods, and traffic distribution. A policy that looks correct in configuration can still react too late or oscillate under a changing workload. Measure those interactions instead of trusting the policy file or a capacity estimate.
The NIST overview of elasticity measurement methods describes static tests based on tension, compression, flexure, and torsion, alongside dynamic resonance methods. It also states that dynamic resonance methods are about five times as accurate as static techniques, showing that the measurement method affects confidence.
For software systems, good elasticity means scaling before user-facing degradation, staying stable as demand changes, and scaling down only after demand remains low. The resource graph does not need to mirror traffic perfectly. The lag, overshoot, errors, and recovery must be measured, understood, and acceptable.
Define Objectives Success Criteria and Observability
Start with the failure you’re trying to prevent, not with the autoscaler setting you want to exercise. “Test Kubernetes HPA” is an implementation task. “Keep checkout usable while traffic rises sharply” is an operational objective.
Write the objective in a way that connects a traffic condition to an outcome. For example, a team might test whether a public API remains within its latency budget during a sudden burst, or whether a worker service clears a growing queue without causing failed requests. The objective determines the workload shape, the metrics, and the environment.
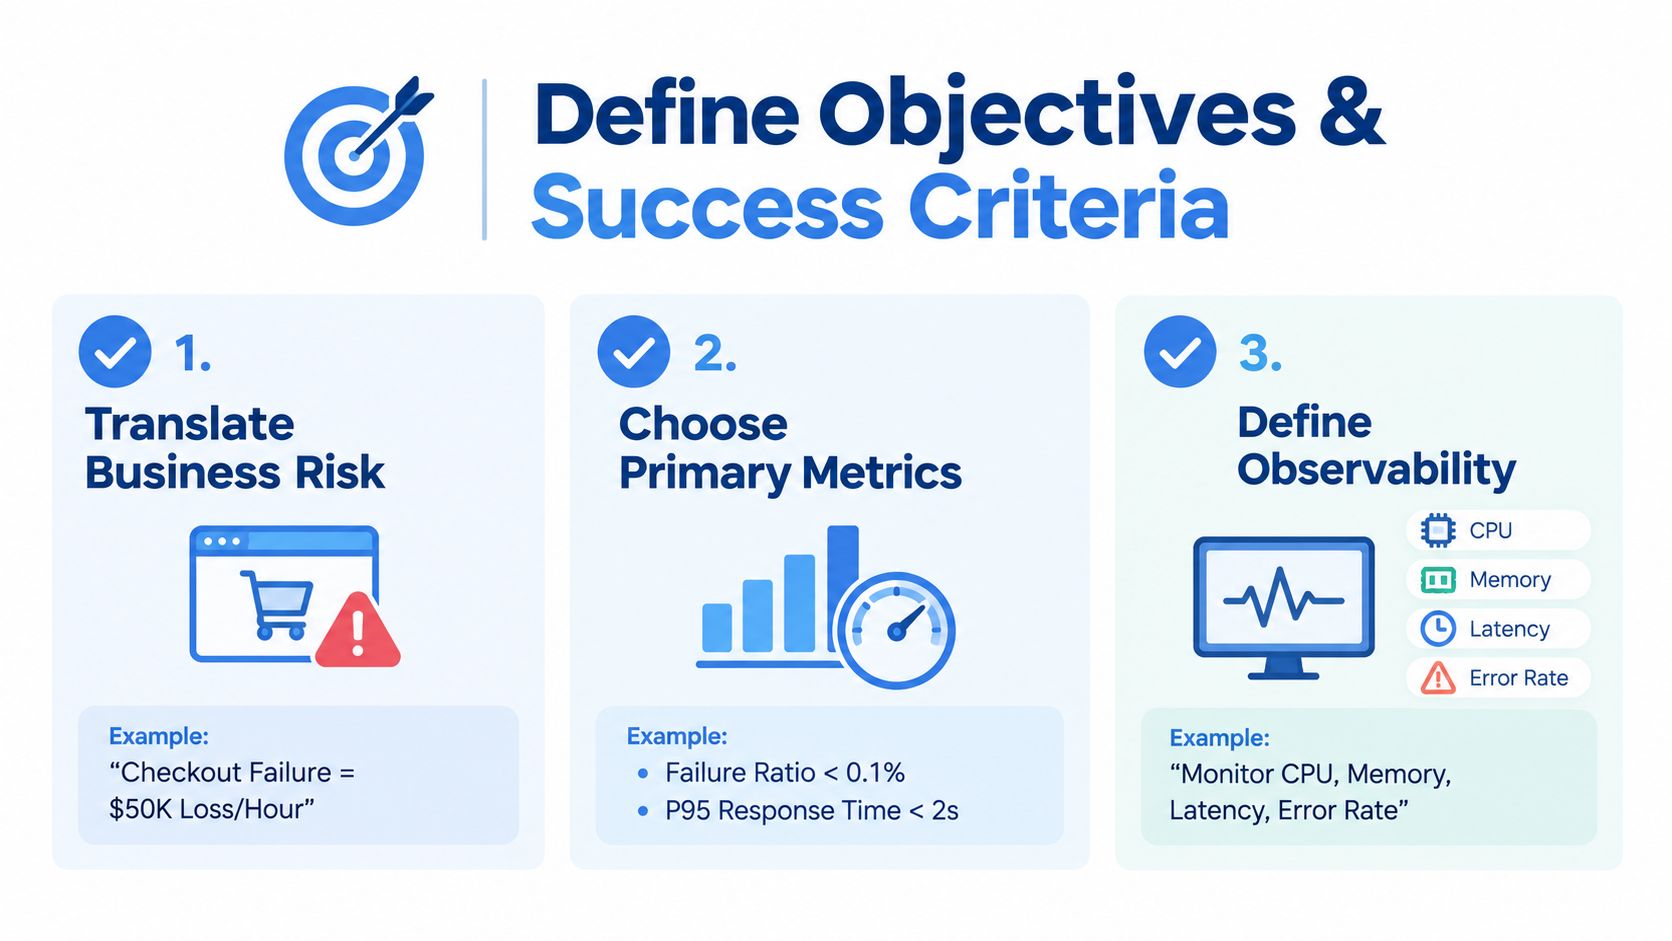
Set criteria before generating traffic
Use a short worksheet with four fields:
- Risk: What user or business operation fails first?
- Trigger: What traffic or queue behavior should activate scaling?
- Acceptable response: How much latency, error, or backlog growth can the service tolerate?
- Recovery: When should the system return toward its baseline footprint?
Avoid using throughput as the only pass condition. The autoscaling load-testing method described in the University of Sannio related study uses failure ratio, written as %KO, and response time, written as RT, as core metrics. That choice reflects a production reality: failed requests and latency degradation often appear before a service reaches obvious throughput saturation.
A request generator can report that it delivered the intended workload while users receive errors. Your test should fail when the service violates its user-facing criteria, even if request volume looks strong.
Observe supply, demand, and control behavior
Build one dashboard that lets you align events on a shared time axis:
- Demand: request arrival rate, active sessions, queue depth, and workload phases.
- Supply: desired, current, and ready replicas, plus available CPU, memory, workers, or connection capacity.
- Experience: response-time distributions, failure ratio, timeouts, and saturation.
- Control loop: scaling decisions, probe results, stabilization windows, cooldown actions, and rejected scheduling events.
Instrument the demand that the system receives, not just what the load tool intended to send. The SPEC Research guidance recommends calibrating injected load so different platforms experience comparable resource demand, then monitoring both resource supply and the demand generated by the workload. Without that calibration, a comparison between two platforms can measure the load generator’s behavior rather than the systems under test.
For practical dashboard design, use this observability guidance for GoReplay testing environments as a reference point, then adapt it to your service’s signals. Check that timestamps share a time source, scaling events are retained, and logs identify the test run and scenario.
Practical rule: Treat a probe transition and a scaling decision as test data. If you can’t explain why a new replica became ready, the result isn’t ready for production use.
Before execution, verify that the test can distinguish an application failure from an infrastructure delay. Record deployment time, image-pull behavior, startup work, readiness transitions, and termination events. Otherwise, you’ll blame the autoscaler for a slow boot path or blame the application for a scheduler bottleneck.
Design Test Scenarios That Reflect Real Traffic
A single smooth ramp rarely represents production. Demand changes shape, and each shape exposes a different timing failure in the scaling loop. A spike tests whether capacity reacts before overload becomes visible. A step ramp tests repeated decisions and policy stability. Gradual growth tests capacity expansion under sustained pressure. A soak tests whether the scaled state remains healthy after the initial scale-up.
SPEC Research benchmarking guidance calls for open workload models and trace-derived bursts or seasonal patterns. Apply that principle to the service under test. Compare synthetic patterns with replayed production shapes, then record which traffic model produced each result. Otherwise, a test may show that an autoscaler responds to a clean ramp without showing how it handles the demand users create.
Compare the scenarios
| Scenario | What It Validates | Watch Closely |
|---|---|---|
| Sudden spike | Whether capacity reacts before overload becomes user-visible | Readiness delay, queue growth, failure ratio, and early latency increase |
| Step ramp | Whether repeated demand changes produce predictable scale decisions | Replica lag, overshoot, stabilization behavior, and oscillation |
| Gradual growth | Whether capacity expands efficiently as demand rises | Resource efficiency, scheduling delay, and sustained response time |
| Soak | Whether the scaled state remains stable over time | Memory growth, connection exhaustion, recurring probe failures, and scale-down behavior |
A spike should resemble a plausible event and last long enough to expose the initial weakness. An extreme burst that overwhelms every dependency mainly proves that the test can create a failure. Measure the reaction window instead: how quickly the platform detects demand, schedules capacity, passes readiness, and begins serving useful work.
A step pattern exposes policies that combine thresholds, averaging periods, and stabilization windows. Hold each level until the control loop has had time to respond, then apply the next change. If the steps arrive too quickly, the test records transitions but cannot show whether the system would have settled. Include both upward and downward steps to expose delayed scale-up and premature scale-down.
Gradual growth helps identify the point where scheduling delay, queueing, or resource contention begins to change the service’s behavior. A soak then checks whether that state remains usable. Watch for memory growth, connection exhaustion, recurring readiness failures, and gradual increases in response time that a short run hides.
Test the way down as carefully as the way up
Capacity appearing on a dashboard does not finish the test. Aggressive scale-down can terminate useful workers, discard warm caches, or create another latency event while demand is still variable. Keep collecting evidence until demand settles and the system removes capacity without harming in-flight work.
Readiness probe timing deserves its own scenario. A probe that reports ready before dependencies, caches, or workers are prepared can route requests to a replica that exists but cannot serve production work. A probe that is too strict delays usable capacity. Test probe thresholds against the actual startup sequence, not an assumed one.
Cooldown and stabilization settings change the outcome as much as the scaling metric. Short windows can produce oscillation under noisy demand. Long windows can preserve stability while users wait through a burst. Vary those settings deliberately, and record why each change was made.
The useful question is whether ready capacity arrived before the service crossed its failure boundary, then left only after demand had settled.
Prepare Traffic and Set Up Replay With GoReplay
Realistic traffic begins with safe capture. If TLS terminates at a gateway or load balancer, capture the plaintext HTTP traffic at a controlled point after termination, subject to your organization’s privacy and security rules. Store captures outside production access paths, restrict permissions, and define retention before collecting anything.
The aim isn’t to copy sensitive production data into a test cluster. Mask credentials, tokens, personal information, and other fields that could trigger real side effects. Filter requests that send email, charge a payment method, change an account, or call external systems. Replace those integrations with test doubles or disabled pathways.
Build a controlled replay path
A practical workflow looks like this:
- Capture a bounded window: Select traffic that represents the endpoint mix and user journeys you need to understand. Don’t assume the busiest endpoint represents the whole application.
- Inspect the capture: Identify authentication state, cookies, headers, payloads, redirects, and calls that depend on a live session.
- Sanitize and filter: Mask sensitive values and remove destructive operations. Make test identities and fixtures explicit.
- Replay against an isolated target: Point the workload at a staging or canary environment with test databases and controlled dependencies.
- Shape the timing: Preserve relative spacing for realism, then apply a deliberate acceleration or scenario shape for the experiment.
- Tag the run: Add a scenario name and test identifier to requests, logs, and metrics so analysis can separate replay traffic from normal activity.
GoReplay can capture HTTP traffic and replay it into a test environment at a chosen speed, which makes it suitable for production-like load exercises. Its testing-environment setup guide is the right place to check the supported setup details before building the harness.
Session behavior requires judgment. Some requests can replay independently, while others depend on a cookie, token, object created by an earlier request, or a changing server response. Preserve ordering where the user journey depends on it. For workflows that create state, generate isolated test identities and reset fixtures between runs instead of replaying production identifiers.
Use multiple replay workers when one generator can’t produce the required demand or or when you need to distribute traffic across the test path. Keep the generator observable, because a saturated load source can make the target appear elastic just because it never receives the intended workload.
The video below provides additional context for setting up traffic replay and testing workflows.
Guardrails matter more than replay speed. Use network isolation, test credentials, blocked outbound integrations, database protections, and an explicit abort procedure. Start below the target load, confirm that requests reach the intended environment, then increase demand only after the safety checks pass.
Execute Safely and Analyze Elasticity Results
Run the first experiment in staging or a canary environment that resembles production in its deployment, limits, probes, dependencies, and autoscaling configuration. A small mismatch can invalidate the result. If staging boots faster, has warmer caches, or lacks a downstream bottleneck, its elasticity profile won’t transfer cleanly.
Start with a baseline period at steady demand. Then execute one traffic shape at a time. Mark the beginning and end of each phase in the test record, and capture autoscaler events alongside application telemetry. Don’t change the policy during a run unless the test specifically evaluates an operational intervention.
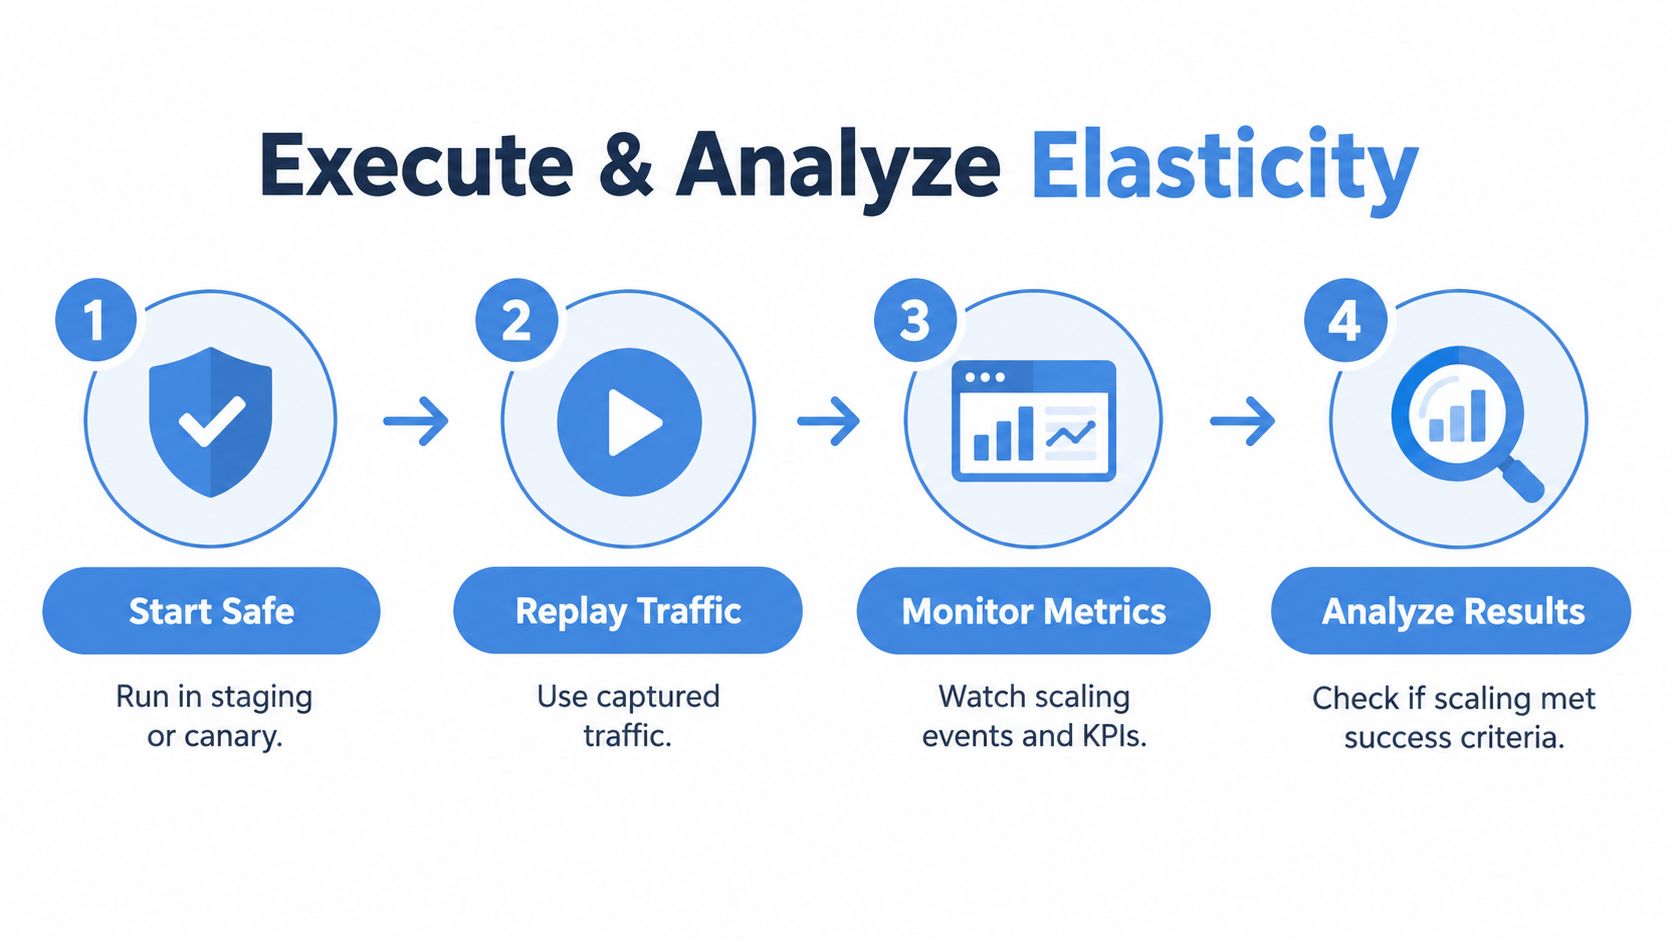
Read the timeline, not isolated graphs
Analyze each run in this order:
- Demand onset: When did the target receive the intended traffic shape?
- User impact: When did latency, timeouts, or failures move away from baseline?
- Scaling response: When did the controller change desired capacity?
- Ready capacity: When could new resources accept traffic?
- Recovery: When did latency and failure ratio return to acceptable levels?
- Scale-down: Did capacity contract without another user-facing event?
The elapsed time between demand onset and ready capacity is the most important timing interval in many spike tests. A policy can respond quickly while the platform still takes too long to schedule, start, initialize, and pass readiness. Measure those stages separately so tuning targets the primary delay.
The cited autoscaling methodology uses offline benchmarking to discover processing capacity, then evaluates configurations with response time and failed-request percentage. Apply the same discipline here. Compare runs by user-visible outcomes and resource behavior, not by replica count alone.
Calculate the useful elasticity signals
You don’t need a single magical score, but you do need consistent comparisons. Useful derived measures include:
- Provisioning lag: time from demand increase to ready capacity.
- Impact window: time during which response time or failure ratio violates criteria.
- Overshoot: capacity provisioned beyond what the measured demand requires.
- Recovery interval: time from demand reduction to an acceptable stable state.
- Demand-supply alignment: how closely available capacity follows generated demand across each phase.
Keep the raw timelines. An aggregate score can hide whether a service failed early and recovered later, or stayed just inside a threshold while consuming excessive capacity.
Metric choice also affects reliability. Research summarized in the provided Kubernetes HPA study reports that combined CPU and memory metrics achieved 29% better resource utilization and 32% more consistent performance than single-metric policies, with scale-up stabilization in about 3 to 4 minutes and recovery averaging 165 seconds. Treat those findings as evidence to test metric combinations and timing windows in your own workload, not as universal settings.
If latency rises before CPU does, CPU isn’t a sufficient trigger. If memory climbs slowly and causes eventual eviction, a short CPU-only test won’t expose the risk. Tune the policy around the earliest reliable signal, then use stabilization and cooldown behavior to prevent noisy reversals.
Avoid Pitfalls and Automate Elasticity Testing in CI
Most failed elasticity programs don’t fail because teams lack a load generator. They fail because the test asks the wrong question. A smooth synthetic ramp, throughput-only pass criteria, premature readiness, and poorly chosen cooldowns can produce a reassuring report while users still experience the original incident pattern.
Use a prevention checklist before every meaningful run:
- Traffic realism: Include trace-derived bursts, endpoint mix, session behavior, and meaningful idle periods.
- Shape coverage: Schedule separate spike, step, gradual-growth, and soak exercises.
- User outcomes: Gate on response time, failure ratio, timeout behavior, and queue health.
- Timing evidence: Record demand onset, desired capacity, ready capacity, and recovery.
- Probe validation: Confirm that readiness reflects actual ability to serve work.
- Oscillation detection: Look for repeated scale-up and scale-down decisions during a stable scenario.
- Side-effect control: Block payments, notifications, destructive writes, and uncontrolled external calls.
The guide to sudden-spike autoscaling validation makes the important distinction between merely scaling and scaling safely under spike, step, and soak conditions. It also highlights readiness, probe behavior, and cooldown configuration as factors that can make or break the result.
Automate the repeatable parts in CI or a scheduled performance environment. Run a focused spike test for changes to scaling policy, deployment startup, or readiness checks. Run step tests on a regular cadence to catch threshold regressions, and reserve soak tests for changes that affect memory, connections, queues, or long-lived workers. Store the results with the commit, policy version, workload identifier, and environment configuration.
Elasticity testing also benefits from the same process discipline used in other operational improvement work, including resources on streamlining clinical workflows. The transferable lesson is simple: define the workflow, make the handoffs visible, and automate checks where repeatability matters.
Keep CI gates narrow enough to remain trusted. Fail a build when the selected scenario breaches an agreed failure ratio or response-time criterion, when ready capacity never catches up, or when a policy introduces clear oscillation. Don’t turn every exploratory run into a release blocker.
GoReplay can capture and replay HTTP traffic into isolated testing environments, helping you validate autoscaling against realistic request sequences and deliberate spike, step, and soak shapes. Build one safe replay scenario this week, connect it to demand, ready capacity, latency, and failure metrics, then visit GoReplay to add repeatable traffic replay to your elasticity-testing workflow.