What Is Performance Testing in Software A Guide

Think of performance testing as the ultimate stress test for your software. It’s a specialized process designed to see how your application holds up under pressure, focusing on three key things: speed, scalability, and stability. This isn’t about hunting down ordinary bugs; it’s about making sure the user experience is smooth and dependable, no matter what. It’s how you get ahead of system failures, infuriatingly slow load times, and customer churn.
Why Performance Testing Is Your App’s Insurance Policy

Imagine building a massive stadium without checking if the stands can actually hold a full crowd. It might look perfect on opening day, but you’re just one packed game away from a total disaster.
Launching an application without proper performance testing is exactly the same kind of gamble. It might work just fine with a handful of users, but the moment you get a surge of traffic from a marketing campaign or a viral post, it could completely fall apart. The result? Downtime, lost revenue, and a damaged reputation.
This is precisely what performance testing is built to prevent. It’s less of a technical chore and more of a critical business safeguard. You’re proactively putting your app under real-world pressure to measure its speed, stability, and scalability before your customers do.
Connecting Performance to Business Success
The line between how your app performs and how your business performs is direct and unforgiving. Slow load times are a notorious killer of customer engagement. In fact, studies consistently show that even a one-second delay can slash conversion rates by up to 7%. That’s an immediate, tangible hit to your bottom line. You can find more data on the real-world business impact of load times in Testlio’s analysis.
Performance testing helps you find clear answers to make-or-break business questions:
- Can our app handle the traffic we expect on a normal day? This ensures you’re ready for business as usual without any nasty surprises.
- What happens if we get a sudden spike in users? This prepares your system for your best-case scenarios, like a wildly successful launch.
- Will the system stay stable over long stretches of time? This guarantees reliability for the users who count on your service being available 24/7.
By simulating these conditions in a controlled environment, you can spot and eliminate bottlenecks long before they ever impact a real user. This isn’t just about dodging crashes; it’s about protecting your brand and ensuring every single person has a great experience.
Ultimately, performance testing isn’t a one-and-done task you check off before a release. It’s an ongoing strategy to make sure your software consistently delivers on its promise of being fast and reliable. Think of it as the insurance policy that protects your entire digital investment.
Breaking Down the Core Types of Performance Testing
To really figure out what your application can handle, you need to ask the right questions about its limits. Each type of performance test is designed to answer a very specific question, giving you a complete picture of your system’s health under different kinds of pressure.
Let’s think of your application as a new coffee shop. Each test will simulate a different, realistic business scenario. This approach helps you know exactly which test to run and why, so you can move past generic checks and get targeted, actionable insights.
Load Testing: Can It Handle the Morning Rush?
Load testing is your bread and butter. The goal is simple: make sure your application can handle its expected, normal amount of traffic without breaking a sweat. It’s not about pushing things until they break, but about confirming that everything works as designed under a typical daily load.
Imagine your coffee shop on a regular Tuesday morning. You expect about 50 customers between 8 AM and 9 AM. A load test is like running a simulation to ensure your two baristas, the coffee machine, and the cash register can serve all those people efficiently without long lines or mistakes.
This test answers the question: “Does our system perform well under normal, anticipated user loads?” It’s all about establishing a performance baseline and measuring key metrics like response time and throughput under everyday conditions.
Stress Testing: Finding the Breaking Point
While load testing checks for expected conditions, stress testing is designed to push your application to its absolute limits—and then some. The whole point is to find the breaking point, the maximum capacity your system can handle before it starts to fail. This helps you understand how the system behaves under extreme pressure and, just as importantly, how it recovers.
Back at the coffee shop, a stress test is like seeing just how many customers can cram inside before the baristas get overwhelmed, the machine grinds to a halt, and orders start getting mixed up. By finding this limit—say, 150 simultaneous customers—you know the absolute maximum your shop can endure.
Stress testing is crucial for identifying the upper capacity limits of your infrastructure. It answers the question: “At what point does our system break, and how does it fail?”
Spike Testing: Surviving a Viral Moment
Spike testing is a special kind of stress test. It measures how your system responds to a sudden, dramatic, and short-lived surge in traffic. This isn’t a gradual increase; it simulates an unexpected event, like a viral social media post or a flash sale that just went live.
For our coffee shop, this is the moment a famous influencer posts a picture of their latte, and suddenly, 100 people rush in all at once. Can the staff handle the immediate chaos? Does the system recover quickly once the initial rush subsides? That’s what a spike test tells you.
This test answers the critical question: “How does our system react to a sudden and massive increase in users?”
Soak Testing: A Marathon, Not a Sprint
Finally, there’s soak testing, sometimes called endurance testing. This one is all about long-term stability. It involves running a sustained, normal load on the system for an extended period—often for hours or even days. Its purpose is to uncover those sneaky, subtle issues that only show up over time.
Think of it as keeping your coffee shop open for a 48-hour marathon. Everything might seem fine after the first day. But by hour 36, you might notice the ice machine is slowly leaking or the credit card reader starts lagging. These are the kinds of hard-to-find problems, like memory leaks or resource degradation, that soak tests are designed to catch.
For a deeper dive into these concepts, you can learn more about the different performance testing types in our detailed guide.
To make it even clearer, here’s a quick cheat sheet.
A Quick Guide to Performance Testing Types
Use this reference to quickly understand the purpose and ideal scenario for each major type of performance test.
| Testing Type | Primary Goal | Example Scenario |
|---|---|---|
| Load Test | Verify performance under normal, expected user traffic. | Simulating a typical business day to ensure response times meet SLOs. |
| Stress Test | Find the system’s breaking point and how it recovers. | Gradually increasing users past the expected peak to identify the maximum capacity. |
| Spike Test | Measure resilience against sudden, massive traffic surges. | Simulating a flash sale or a viral marketing campaign announcement. |
| Soak Test | Uncover issues that appear only over a long duration. | Running a normal load for 24-48 hours to detect memory leaks or resource degradation. |
These four core methods provide a solid framework for ensuring your application is not just fast, but also resilient and reliable no matter what you throw at it.
Your 5-Step Performance Testing Roadmap
Knowing the types of performance tests is a great start, but running them well is a different game entirely. Without a solid plan, you’re just creating chaos and getting confusing results. This five-step roadmap cuts through the complexity and gives you a manageable workflow, taking you from initial setup all the way to actionable insights.
Think of it as a pre-flight checklist for your application. Each step makes sure you have the right gear, a clear destination, and a plan for any turbulence you might hit.
Step 1: Defining Your Test Environment and Tools
First things first, you need a dedicated, stable environment that’s a near-perfect mirror of production. Testing in a mismatched environment is like training for a marathon on a treadmill and expecting the same results on a hilly road—your data will be totally unreliable.
Your test environment has to replicate the hardware, software, network configs, and even the database of your live system. You also need to pick the right tools for the job, whether that’s a classic open-source option like JMeter or a modern solution like GoReplay that uses real-world traffic.
Step 2: Setting Clear Performance Goals
Good performance testing isn’t about aimlessly poking around for problems. It’s about verifying that your system meets specific, measurable criteria, often called Service Level Objectives (SLOs). These are the goals that connect dry technical metrics to real business outcomes and user happiness.
A vague goal like “the app should be fast” is useless. You need to get specific:
- Response Time: User login must complete in under 1.5 seconds with 1,000 concurrent users.
- Throughput: The payment processing API must handle at least 500 transactions per minute.
- Error Rate: During peak load, the error rate must stay below 0.1%.
Setting these benchmarks up front gives you a clear pass/fail definition for every test. It gets rid of any ambiguity and makes sure everyone on the team agrees on what “good performance” actually looks like.
Step 3: Designing Realistic Test Scenarios
Your tests are only as good as the scenarios you build. A great test scenario mimics how real users actually behave, simulating the exact actions and workflows your customers will go through. This means you have to go beyond just hammering a single URL and instead create scripts that follow a complete user journey.
For an e-commerce site, a realistic scenario might look like this:
- A user lands on the homepage.
- They search for a specific product.
- They add that item to their cart.
- Then, they proceed to the checkout page.
- Finally, they complete the purchase.
This kind of multi-step process puts the entire application flow under load, uncovering bottlenecks that simpler, single-action tests would definitely miss.
Step 4: Executing and Monitoring the Test
With your environment, goals, and scenarios ready, it’s go time. As you begin to ramp up the virtual user load, you have to be actively monitoring the system’s health. This means keeping a close eye on key metrics in real-time—things like CPU utilization, memory consumption, response times, and error rates.
This visual flow shows the core performance testing types you’ll be running, from applying expected loads to checking for long-term stability.
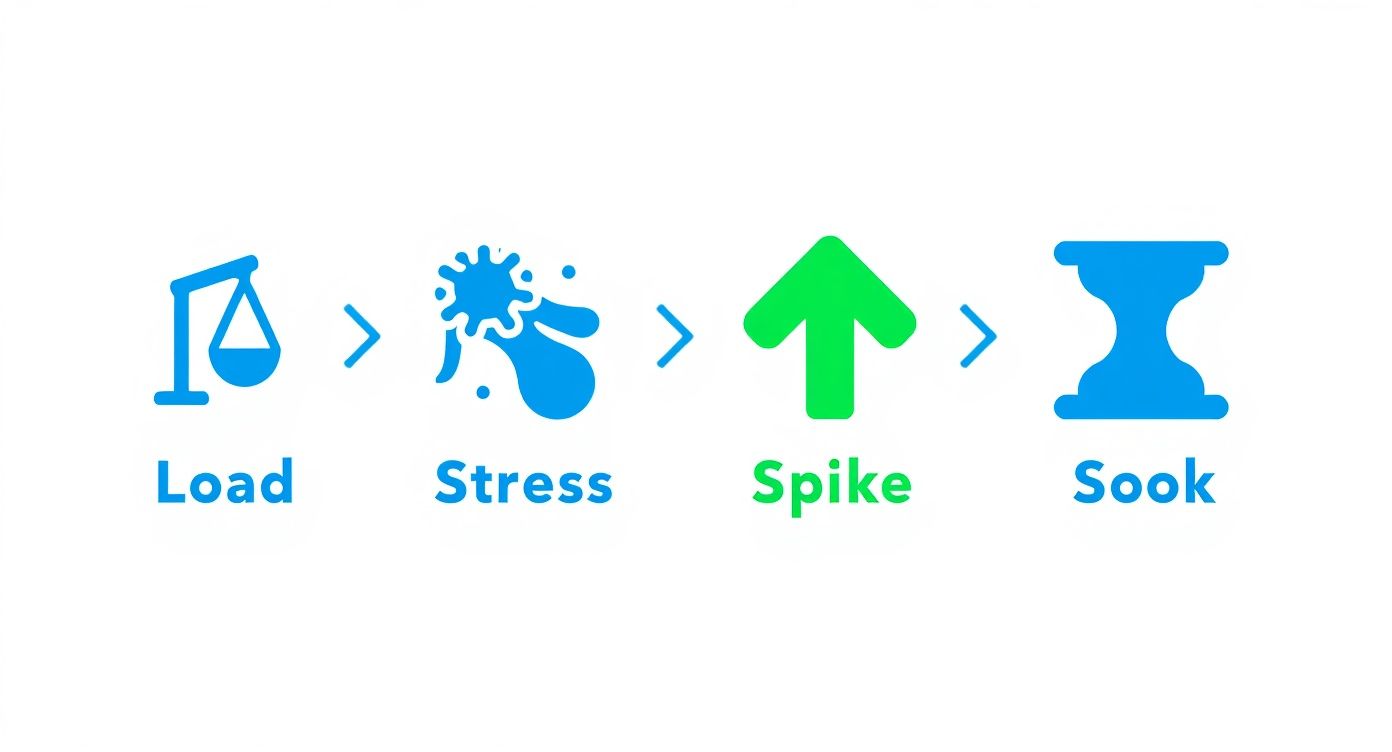
This graphic breaks down how each test type—Load, Stress, Spike, and Soak—is designed to answer a different performance question, giving you comprehensive coverage.
Step 5: Analyzing Results for Actionable Insights
Once the test is done, the real work begins: analyzing the data. This is where you connect the dots between different metrics to find the root cause of any performance issues. Did response times spike when the CPU hit 90%? Did the error rate shoot up after a certain number of users logged in?
Your goal is to turn a pile of raw numbers into a clear story. Pinpoint the bottlenecks, document what you found, and create specific, actionable recommendations for the development team. This final analysis is what actually drives improvement and gets your software ready for the real world.
Decoding the Metrics That Actually Matter

Running a performance test spits out a mountain of data. But raw numbers don’t tell you much without context. The real trick is learning to translate those technical figures into something meaningful—like how happy your users are and how healthy your business is.
Think of it like a car’s dashboard. You don’t need to be a mechanic to know a red, overheating engine light is bad news. Performance metrics are just like that. They’re the warning lights and gauges that tell you exactly how your software is holding up under pressure.
Translating Jargon into User Experience
The most valuable metrics are the ones that directly mirror what a user feels when they interact with your application. They build a bridge between cryptic server logs and real customer satisfaction. Getting a handle on these is the first step toward making smart, data-driven improvements.
Here are the core metrics you’ll see again and again and what they actually mean:
- Response Time (Latency): This is the total time a user has to wait after they do something—like click a button—until they get a response. High response time is that frustrating lag that makes people abandon a page.
- Throughput: This number tells you how many requests or transactions your system can process in a set period, like requests per second. If your throughput is low, it’s like your application is a tiny doorway with a long line of users waiting to get in.
- Error Rate: This is simply the percentage of requests that fail. A rising error rate isn’t just a technical glitch; it means your users are hitting dead ends and can’t get things done. It’s pure frustration.
These core figures are the heartbeat of your application’s performance. When they start to look unhealthy, it’s a clear sign that you need to investigate deeper to find and fix the underlying bottlenecks.
Monitoring Your System’s Health
Beyond what the user sees, you also need to keep an eye on your infrastructure’s health. These system-level metrics help you figure out the why behind poor performance. A slow response time might be caused by a server that’s gasping for air, and these numbers will tell you exactly that.
Key system metrics include:
- CPU Utilization: This measures how much of your processor’s power is being used. If it’s constantly hovering near 100%, your server is overworked and simply can’t keep up.
- Memory Usage: This tracks how much RAM is being consumed. A classic problem found during soak tests is a memory leak, where usage just keeps climbing over time without ever dropping back down.
By blending these user-centric and system-level metrics, you get the full story of your application’s performance. For a deeper dive into what to track, check out this essential performance testing metrics guide for measuring success.
The Future of Performance Testing is Already Here
Performance testing is no longer a last-minute chore you rush through before launch. It’s quickly becoming an intelligent, continuous practice that’s woven directly into the fabric of the software development lifecycle.
The whole game is changing. We’re moving away from frantic, pre-launch checks and toward a more proactive, predictive approach to quality assurance.
The driving force behind this evolution is a simple, powerful idea: find problems earlier. The earlier you find them, the cheaper and easier they are to fix. This is the heart of the “shift-left” movement, which is all about pulling performance testing into the earliest stages of development. Instead of waiting for a fully assembled product, teams are now testing individual components and APIs as they’re being built.
The Rise of Intelligent Automation
This shift is getting a massive boost from artificial intelligence (AI) and machine learning (ML). These aren’t just buzzwords; they’re fundamentally changing how we test. AI is automating the tedious stuff, like generating realistic user scenarios or sifting through mountains of complex test data.
But where it gets really interesting is in prediction. AI-powered tools can analyze historical performance data to forecast potential bottlenecks before a single line of new code even gets deployed. Imagine a system that flags a planned feature update, warning you that it’s likely to overload your database during peak hours. That’s the kind of foresight that prevents outages and protects your users from a frustrating experience.
Real-Time Insights and Modern Architectures
Another major change is the move to real-time analytics. Modern tools don’t just give you a report after a test is over; they provide instant feedback on system health while the test is running. In fact, teams using real-time performance monitoring are twice as likely to catch issues early in the development cycle, which slashes the risk of costly production failures. Discover more insights on the impact of real-time analytics for modern load testing tools.
This immediate feedback loop is absolutely critical for today’s software architectures. As more companies adopt distributed systems like microservices, the complexity of testing explodes. A single user request might wind its way through dozens of independent services, making it incredibly difficult to pinpoint the source of a slowdown without the right tools.
A “shift-left” strategy, combined with AI and real-time monitoring, isn’t just a trend—it’s a necessary evolution. It allows teams to build performance into their applications from the ground up, rather than trying to bolt it on at the end.
This new world demands smarter, more distributed testing strategies that can keep up with the complexity of cloud-native applications. By embracing these changes, your team can finally move from a reactive “test and fix” cycle to a predictive, continuous model of quality—ensuring your software is resilient, fast, and ready for whatever comes next.
Picking the Right Performance Testing Tool for Your Team
With so many options out there, choosing the right performance testing tool can feel like a chore. The best choice always comes down to a few key factors: your budget, your team’s expertise, and what your project actually needs. Think of it like picking a vehicle—a race car is built for speed, but a cargo van is what you need for heavy lifting. Every tool has its purpose.
Your decision here will define how you tackle software performance. Some tools demand deep technical knowledge and hours of scripting, while others offer a more guided, user-friendly path. Understanding this trade-off is the first step to picking a solution that helps your team, not holds them back.
Open-Source Powerhouses vs. Commercial Platforms
The performance testing world is pretty much split into two camps: open-source and commercial. For a lot of teams, open-source tools are the first stop, mainly because they’re free to use.
- Apache JMeter: A long-standing favorite, JMeter is a true workhorse supported by a massive community. It’s fantastic for generating heavy load, but it comes with a steep learning curve. Be prepared to invest a lot of time writing and maintaining test scripts.
- Gatling: Known for its raw performance and developer-friendly, code-based approach, Gatling is a powerful option. But just like JMeter, it’s built around manual script creation, which can quickly become a bottleneck when you’re trying to run fast, realistic test cycles.
Commercial platforms usually offer a more polished experience with dedicated support, but you’ll pay for it. They often feature slick user interfaces and fancy reporting, making them a good fit for large enterprises. Still, the core problem often remains: you’re stuck trying to simulate real-user behavior with scripts, which is always just a best guess.
A Modern Approach with Traffic Replay
Lately, a new breed of tools is changing the game by getting rid of manual scripting entirely. Instead of guessing what users might do, these tools capture real production traffic and replay it in a test environment.
This is the closest you can get to perfect test fidelity. You’re not just simulating user behavior—you’re recreating it exactly as it happened, complete with all the weird edge cases and complex interactions you’d never think to script by hand.
GoReplay is a leading open-source tool in this space. By capturing and replaying live HTTP traffic, it lets you run performance tests that are a perfect mirror of your real-world usage. This completely changes the workflow, saving the time and effort usually spent on test setup and letting your developers and QA engineers focus on analysis, not script maintenance. For any team that needs to know exactly how their application will perform under pressure, replaying real traffic offers insights you just can’t get any other way.
Your Top Performance Testing Questions, Answered
As teams dive into performance testing, a lot of the same questions pop up. It’s one thing to understand the theory, but making it work in the real world is a whole different ball game. Let’s cut through the noise and tackle the questions that really matter.
Here are some of the most common hurdles teams face, with practical answers to get you on the right track.
How Early in the Development Cycle Should We Start Performance Testing?
The short answer? As early as you possibly can. The whole “shift-left” movement isn’t just a buzzword; it’s about catching performance problems when they’re small and cheap to fix. This means testing individual components and APIs way before the entire application is stitched together.
If you wait until the end, you’re trying to untangle a mess. Early, frequent testing on a smaller scale stops performance debt from piling up. Think of it as building quality in from day one, not trying to bolt it on as an afterthought.
What Is the Difference Between Performance Testing and Performance Engineering?
It’s a great question, and the distinction is important. Think of it this way: performance testing is like taking a final exam to see if you passed. It’s a validation step—you run tests against specific benchmarks to find problems that already exist.
Performance engineering, on the other hand, is the ongoing practice of studying and preparing to make sure you ace that exam. It’s proactive. It’s about building performance into the system from the ground up through smart architecture, clean code, and solid capacity planning. One finds issues; the other prevents them from ever happening.
Can Small Teams With Limited Budgets Afford Performance Testing?
Absolutely. In fact, you can’t afford not to. The cost of an outage, frustrated customers, and emergency patches will almost always be higher than the cost of testing.
You don’t need a massive budget to get started. Powerful open-source tools like Apache JMeter and Gatling are completely free and incredibly capable. They put serious testing power within reach for any team.
Plus, modern tools can dramatically slash the time you spend writing and maintaining test scripts. It’s all about finding the right tool for your team’s size and needs, allowing you to get reliable results without a huge upfront investment.
Stop guessing what your users are doing and start testing with real traffic. GoReplay is an open-source tool that captures and replays your actual production traffic, eliminating the need for manual scripting and providing the most realistic performance tests possible. Find and fix bottlenecks before they impact your customers by visiting https://goreplay.org to learn more.