What Is Load Testing in Software Testing A Guide

So, what exactly is load testing?
Think of it as a controlled dress rehearsal for your website or app. Before the big opening night—say, a major product launch or a Black Friday sale—you want to be sure the stage won’t collapse under the weight of the expected audience. Load testing simulates that anticipated crowd, letting you see how your system holds up under pressure without actually breaking it.
Understanding the Core Purpose of Load Testing

Let’s use an analogy. Imagine a structural engineer designing a new bridge. They wouldn’t just build it and hope for the best. They’d run tests, driving a specific number of heavy trucks across it at once—a weight representing the busiest rush hour traffic.
That’s precisely what load testing does for software. It’s not about sending an infinite number of trucks to find the bridge’s breaking point (that’s a different beast called stress testing). It’s about making sure the bridge can comfortably handle the normal, expected traffic without buckling, slowing down, or showing any signs of strain.
Why This ‘Dress Rehearsal’ Is So Important
This kind of proactive testing is absolutely critical for protecting your reputation and your bottom line. A slow, unresponsive application is a user-repellent. People get frustrated and leave, often for good.
The financial impact is real and measurable. A Google study found that 53% of users will abandon a website if it takes more than three seconds to load. In a similar vein, Amazon calculated that a tiny 100-millisecond delay could slice their sales by 1%. You can discover more insights about the software testing market and how it affects business outcomes.
By simulating real-world traffic in a controlled environment, load testing helps you find and fix performance bottlenecks before they affect your actual customers.
To make it even clearer, here’s a quick breakdown of what load testing is all about.
Load Testing at a Glance
This table simplifies the core ideas into the what, why, when, and how.
| Concept | Brief Explanation |
|---|---|
| What It Is | A performance test measuring how a system behaves under a specific, anticipated number of users. |
| Primary Goal | To confirm the app meets performance targets (like response time) during normal and peak traffic. |
| When It’s Used | Before big launches, new feature rollouts, or high-traffic events like a major marketing campaign. |
| How It Works | Simulates a set number of “virtual users” performing tasks to mimic real-world activity. |
In the end, load testing gives you the confidence that your software is ready for its audience. It’s about delivering a smooth, reliable experience that keeps users happy and helps your business grow.
Load testing isn’t a simple, one-size-fits-all deal. It’s more like a family of different performance tests, where each one has its own unique job to do. Figuring out these variations is key to asking the right questions about your app’s stability and picking the perfect test for the situation.
Think of it like training an athlete. A standard load test is like a regular practice session—it makes sure the athlete can handle a typical game. But if you want them to be ready for anything, you need to throw in some specialized drills.
Endurance Testing for Long-Term Stability
One of the most critical drills is endurance testing, sometimes called soak testing. This is the marathon for your application. Instead of a quick burst of activity, you hit the system with a steady, moderate load over a long period—we’re talking hours, or sometimes even days.
The goal here isn’t to find the breaking point. It’s to uncover those sneaky, slow-burning problems that only show up over time. The biggest culprit is often memory leaks, where an application slowly eats up more and more memory until it finally gives up and crashes. An endurance test is designed to catch this kind of performance decay that shorter tests would completely miss.
Spike Testing for Sudden Surges
Then you have spike testing. If endurance testing is a marathon, spike testing is a series of all-out sprints. This test is all about simulating a sudden, massive, and totally unexpected flood of users hitting your application all at once.
A classic real-world example? A flash sale you just announced on social media or a news story that goes viral and links back to your site. A spike test gives you answers to crucial questions:
- Can the system handle a 10x traffic increase out of nowhere without falling over?
- How fast does it recover after the surge dies down?
- Do existing users get a terrible experience while the spike is happening?
This kind of test is non-negotiable for any application that could face sudden popularity. It ensures you stay online and resilient right when it matters most.
Stress Testing to Find the Breaking Point
Finally, there’s stress testing. This is where you intentionally push the system way past its expected limits to find its absolute breaking point. While a load test checks performance under expected traffic, a stress test deliberately overloads the system to see exactly how and when it fails. This is how you learn about its failure modes and, just as importantly, how it recovers.
The real goal of stress testing isn’t just to watch the system fail, but to see how it fails. A system that degrades gracefully—maybe by showing a friendly error message—is infinitely better than one that just crashes and starts losing user data.
Understanding the fine line between these approaches is what separates good testing from great testing. To really dig in, you can check out our detailed comparison of load testing vs. stress testing to help sharpen your strategy. By mixing and matching these different tests, you start to build a truly complete picture of what your application can handle.
A Practical Guide to Performing a Load Test
Alright, let’s move from theory to action. Running a solid load test isn’t some dark art—it’s a structured process. When you break it down into clear, manageable stages, what seems like a daunting technical task becomes a straightforward roadmap.
Each step is critical. Get one wrong, and you risk gathering skewed data and making bad decisions about your application’s performance. The whole thing kicks off with having a crystal-clear vision of what you’re trying to accomplish. Without it, you’re just collecting numbers without any real meaning.
Stage 1: Define Clear Performance Goals
Before you even think about simulating a single user, you have to define what “good” looks like. What are your application’s non-functional requirements? This is where you set concrete, measurable targets.
- Response Time: What’s the longest a user should ever have to wait for a page to load or an API to respond? A great starting point is to aim for all critical actions to complete in under 2 seconds.
- Throughput: How many requests per second does your system need to juggle during its busiest hours? You might set a target like 500 transactions per second.
- Error Rate: What’s an acceptable failure rate when the system is under stress? A common goal is to keep this well below 0.1%.
These goals aren’t just suggestions; they become the yardstick you’ll measure your test results against.
Stage 2: Create a Realistic Test Environment
This is a big one. Your test environment needs to be a near-perfect clone of your production setup. Using a wildly different environment will only give you misleading, unreliable data.
That means replicating everything: hardware specs, network configurations, database size, and even third-party integrations. Any significant difference can completely invalidate your findings, leaving you with a false sense of security or chasing phantom performance issues.
The flow chart below really nails the core cycle of planning, running, and analyzing a load test.
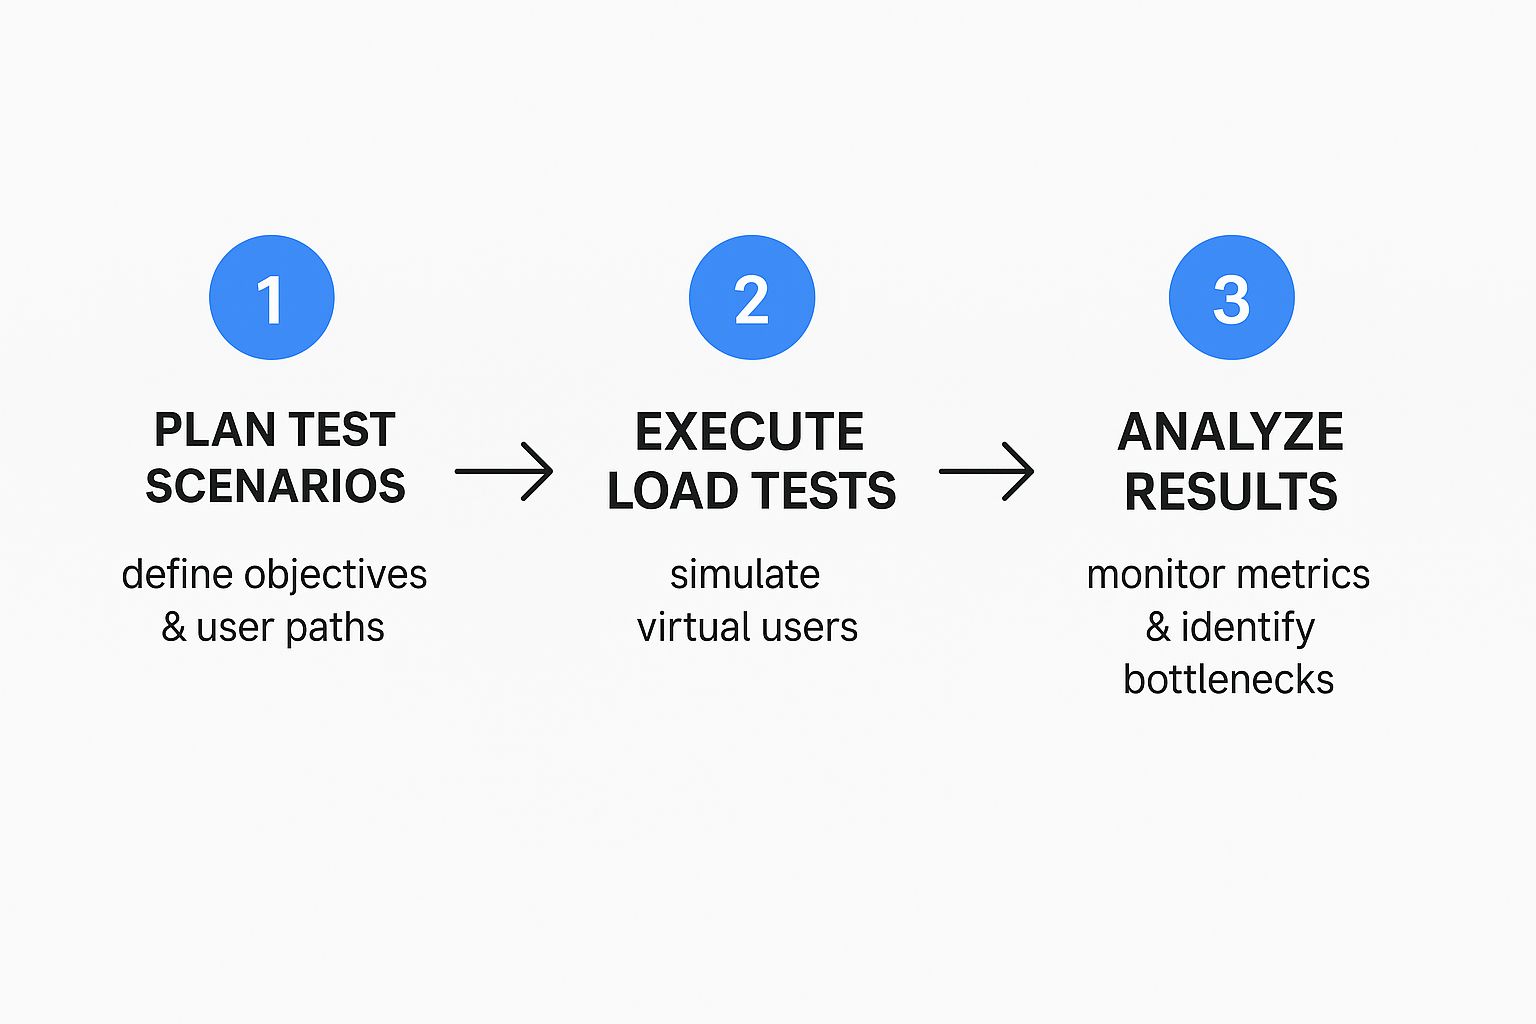
As you can see, effective load testing isn’t a one-and-done deal. It’s a continuous loop of careful planning, controlled execution, and deep analysis to hunt down and squash performance problems.
Stage 3: Script Realistic User Scenarios
One of the most common mistakes is to just hammer a single login page with a flood of traffic. Real users are far more complex. You have to script user journeys that actually mimic how people behave.
Think about a typical e-commerce flow:
- A user logs into their account.
- They search for a specific product.
- They add that product to their cart.
- Finally, they head to checkout and complete the purchase.
Each step in that journey creates a different kind of load. Tools like JMeter are often used to build these scripts. For a deeper look at this, check out our complete guide on load testing a REST API with JMeter.
Stage 4: Execute the Test and Analyze Results
With all the prep work done, it’s time to hit “go.” While the test is running, you should be monitoring your system’s health in real-time.
But the real work begins after the test is over. This is the final—and most critical—step: analyzing all the data you collected and comparing it against the goals you set in Stage 1. Did you hit your response time targets? What was the final error rate? This analysis will point you directly to the bottlenecks that are holding your system back.
This structured approach is why the market for testing tools is booming. The global load testing software market was valued at around $2.5 billion in 2025 and is on track to hit nearly $8 billion by 2033, showing just how critical reliable applications have become. You can read the full research about the load testing market to get the full picture.
Interpreting Your Load Test Results
Running a load test is only half the battle. You get a mountain of raw data, but what does it all mean? Think of it like a doctor ordering a blood test—the real value isn’t in the test itself, but in a trained professional understanding what the numbers reveal about your health.
Once you learn to read the vital signs of your application’s performance, you can accurately diagnose its health under pressure. The whole story is hiding in just a few critical metrics.
It’s a bit like learning to read an EKG. At first, it’s just a bunch of squiggly lines. But to a cardiologist, those lines show the heart’s rhythm, strength, and any potential trouble spots. Your load test results do the same for your application.
Decoding the Core Performance Vitals
The first step is to zoom in on the essential metrics. These three data points are the foundation of your analysis, and understanding how they influence each other is the key to finding performance bottlenecks.
Let’s break them down:
-
Response Time: This is simply how long it takes the application to respond to a user request. A consistently low response time means you have a healthy, snappy system. If it’s high or jumping all over the place, you’re likely looking at overwhelmed servers or sluggish database queries.
-
Throughput: This metric tells you how many requests your system can handle per second. High throughput looks great on paper, but it’s a deceptive number on its own. You have to look at it alongside the error rate for it to mean anything.
-
Error Rate: This is the percentage of requests that failed during the test. Ideally, this should be 0%. Any errors at all mean your system is struggling and users are having a bad time.
These metrics are all connected. They don’t exist in a vacuum. For example, a sudden spike in response time will almost always drag your throughput down with it.
High throughput is only a win if the error rate is near zero. If your application is processing 1,000 requests per second but 20% of them are failing, it’s not performing well—it’s just failing fast. This is a critical distinction that many teams miss.
Connecting Metrics to Real-World Problems
The real skill is connecting these numbers back to actual issues in your application. Certain patterns in your test results almost always point to specific types of problems.
The table below breaks down some of the most crucial performance metrics, explaining what they measure and why they are so vital for understanding your application’s health under load.
| Metric | What It Measures | Why It’s Important |
|---|---|---|
| Response Time | The time it takes from a user’s request to a completed response from the server. | This is the most direct measure of user experience. Slow response times lead to frustrated users and abandoned carts. |
| Throughput | The number of requests your system can successfully process in a given time period (e.g., requests per second). | Throughput shows your system’s capacity. A sudden drop in throughput as load increases is a clear sign of a bottleneck. |
| Error Rate | The percentage of requests that result in an error (e.g., 5xx server errors, timeouts). | An error rate above 0% indicates that the system is failing under load, directly impacting users. |
| CPU/Memory Utilization | The percentage of your server’s processor and memory resources being used. | High utilization (80% or more) can signal that your hardware is the bottleneck and you need to scale up your infrastructure. |
| Latency | The time it takes for a data packet to travel from one point to another in the network. | While related to response time, latency specifically measures network delay, which can be a hidden source of slowness. |
By learning to read these patterns, you can move beyond just collecting data. You start diagnosing the root causes of performance issues, which empowers you to make targeted, data-driven improvements. Ultimately, that’s how you build a more stable and reliable application for your users.
Choosing the Right Load Testing Tool
Picking the right tool for load testing is a lot like choosing the right vehicle for a journey. You wouldn’t take a race car on a cross-country cargo trip, would you? The best tool for the job depends entirely on your team’s skills, your application’s architecture, and what you’re trying to accomplish.
The landscape is full of options, from old-school script-based tools to more modern approaches like traffic shadowing. The key is to understand the philosophy behind each type. One isn’t necessarily better than the other; they just solve different problems in different ways.
Script-Based vs. Traffic-Shadowing Tools
Traditional tools make you write scripts to simulate what a user does. You map out a typical journey—logging in, searching for a product, adding it to a cart—and the tool then runs that script over and over with thousands of virtual users. It’s a classic approach.
But traffic-shadowing tools like GoReplay come at it from a completely different angle. Instead of faking user behavior with scripts, they capture real user traffic from your live production environment and replay it against your staging or test server. This gives you a level of realism that’s hard to beat because the test load isn’t an approximation; it’s a perfect copy of how people actually use your application.
This is a look at how GoReplay captures live traffic to build truly realistic testing scenarios.

The big idea here is using real traffic to cut out all the guesswork. You stop spending time creating and updating synthetic test scripts and start testing against reality.
Key Factors to Consider
As you weigh your options, think about these points to find the right fit. A good choice here will make your testing process faster and more effective, not more complicated.
- Realism vs. Control: Do you need the undeniable realism of actual user traffic, or is it more important to have precise control over very specific, scripted scenarios? Traffic shadowing is king for realism, but script-based tools give you that fine-grained control.
- Team Skill Set: Is your team full of scripting wizards who are comfortable in languages like Groovy or Scala? If not, a tool with a simpler interface or a no-script approach like traffic shadowing could save you a ton of time and effort.
- Application Architecture: For complex microservices setups, replaying real traffic is a fantastic way to test the tricky interactions between services that are a nightmare to script by hand.
- Budget and Licensing: Open-source tools can be a great, cost-effective option, but they might need more hands-on work for setup and maintenance. Commercial tools often come with dedicated support and extra features, but at a price.
The history of load testing is a story of evolution, moving from basic scripts to these more advanced simulations. Tools like Apache JMeter, first released way back in 1998, became foundational by showing how to simulate thousands of users. It really paved the way for the sophisticated solutions we have today. You can read the full research about the load testing software market to see just how much the industry has grown.
In the end, you want a tool that aligns with your team’s philosophy on testing. It should empower you to find and fix performance bottlenecks efficiently, feeling like a natural part of your workflow that delivers clear, actionable insights. That’s how you build a more reliable application.
Got Questions About Load Testing?
As you start digging into performance testing, a few common questions and mix-ups always seem to pop up. Getting these straight from the beginning is key to building a smart strategy and dodging the usual mistakes.
Think of this as your field guide to the real-world hurdles of bringing load testing into your workflow. These are the answers you need to clear things up and move forward with confidence.
Load Testing vs Stress Testing What Is the Difference
This one trips up almost everyone. “Load testing” and “stress testing” sound like they do the same thing, but they’re designed to answer completely different questions about what your application can handle.
Let’s use a simple analogy: testing a new bridge.
-
Load testing is like sending the expected number of cars across the bridge during rush hour. You’re just making sure it can handle normal, heavy traffic without slowing down or showing signs of strain. The goal is to verify performance under a known, expected load.
-
Stress testing, on the other hand, is about finding the breaking point. It’s like jamming more and more cars onto that bridge until you see the first crack appear. You want it to fail so you can understand how it fails and whether it can recover gracefully.
To put it simply: Load testing checks performance under expected heavy traffic. Stress testing pushes the system beyond its limits to see where it breaks.
How Often Should We Perform Load Tests
Load testing isn’t a one-and-done thing you do right before a big launch. If you’re working in an Agile or DevOps world, it needs to be a regular part of your development cycle. Thinking of it as a continuous process instead of a final exam is crucial for maintaining quality.
For the best results, you should run load tests at key moments:
- Before releasing new features to make sure they don’t drag down performance.
- After any big code changes that might affect how the system behaves.
- Before high-traffic events you know are coming, like a big sale or marketing push.
By integrating load testing right into your CI/CD pipeline, you make performance validation automatic. You’ll catch issues early, long before your users ever see them.
Can I Run Load Tests on Production
Testing directly on your live production environment is a classic “don’t try this at home” scenario. Firing a massive wave of simulated traffic at your live app is a great way to ruin the experience for real customers or, worse, knock the whole thing offline. It’s generally a bad idea.
The gold standard is to use a dedicated staging or pre-production environment that’s an exact replica of your production setup. This gives you a safe sandbox to play in without messing with live traffic.
But what if you could get the best of both worlds?
Advanced techniques like traffic shadowing let you do just that. Tools can capture real production traffic and replay it against a test server or a new version of your service, completely invisible to your live users. This gives you the most realistic test data imaginable without any of the risks of testing on production.
Ready to test with the unmatched realism of actual user traffic? With GoReplay, you can capture and replay live traffic to find and fix issues before they ever hit production. Start for free and transform your testing strategy today.