
What Is Application Testing? a Practical Guide

Application testing is the systematic evaluation of software to find defects, verify requirements, and assess behavior under expected and adverse conditions. Inadequate testing infrastructure carries substantial annual costs. That is the short answer. The longer one changes how you judge a passing build.
A green test suite shows that the scenarios someone planned behaved as expected. It does not show whether an application can handle the request mix, timing, retries, and session states real users create. Strong testing gathers evidence from both planned checks and observed behavior. First, define clear expected results. Then assess the system under conditions close enough to production to expose failures a script may miss.
For developers, QA engineers, and DevOps leads deciding whether to ship, the distinction matters. Correctness on a quiet staging system is a starting point, not proof of readiness. Check error rates, latency, resource saturation, and recovery against a trusted baseline, then consider whether real traffic could reveal behavior the scripted suite never covered.
What Application Testing Is and Why Late Bugs Cost More
Say a team ships a pricing change on Friday. The unit tests pass, the demo looks clean, and the first real orders arrive with a discount code, a tax region, and a saved address combined in a way nobody scripted. Totals come out wrong. Support refunds orders over the weekend while engineers trace a defect that was cheap to find on Tuesday and expensive to find in production.
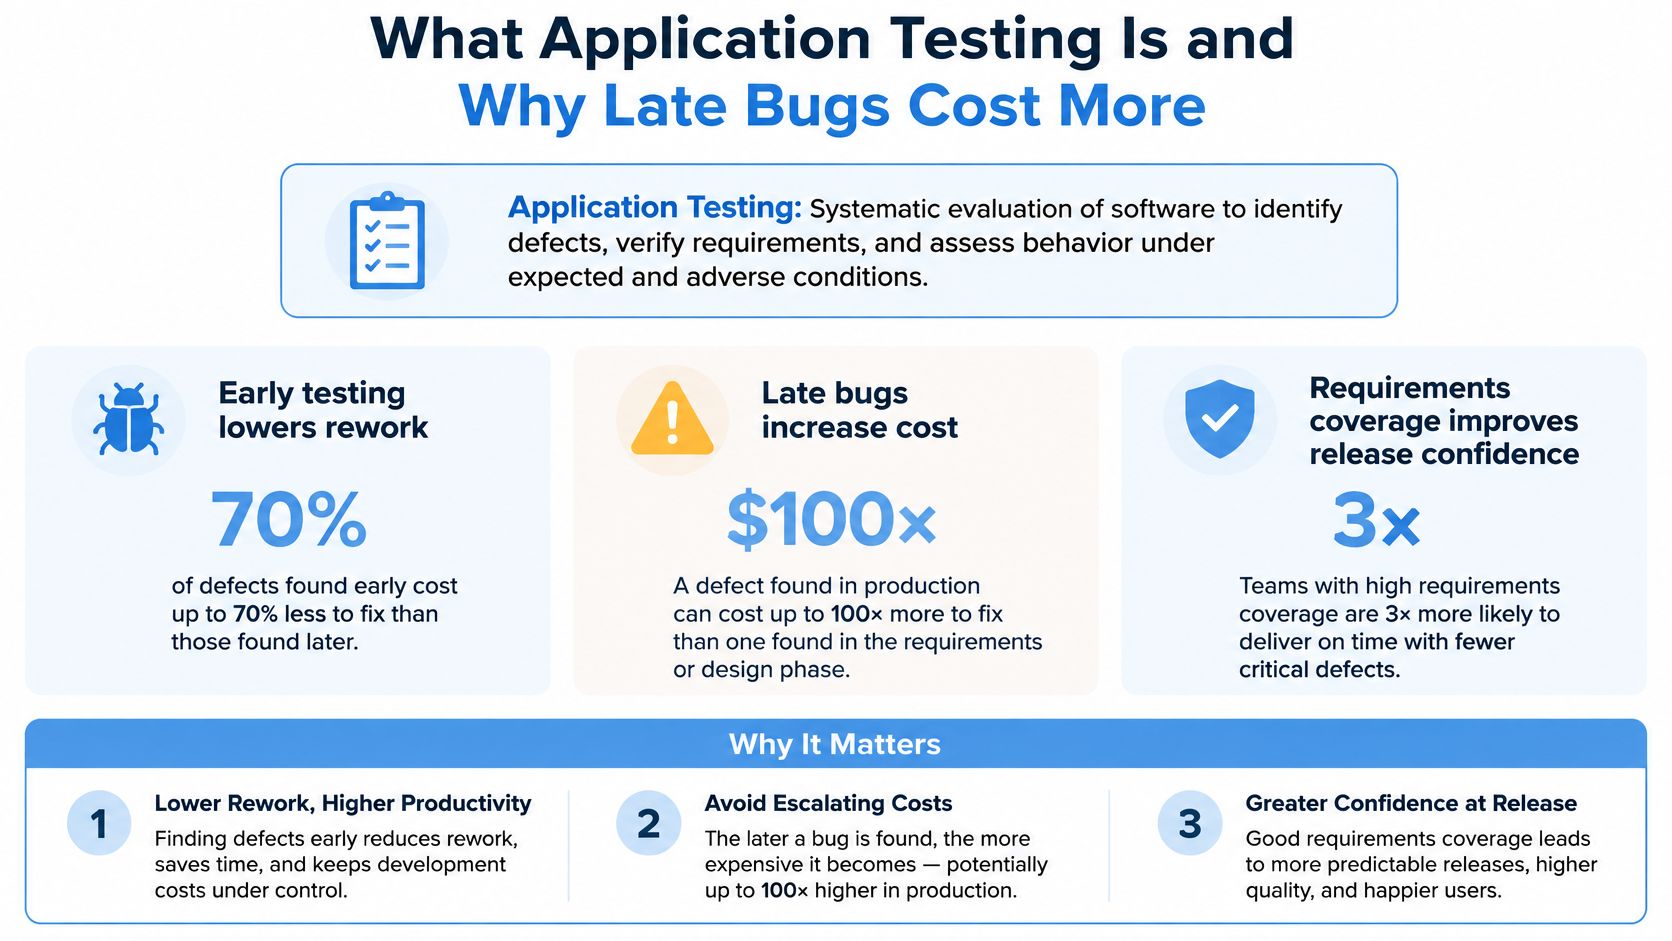
That’s what application testing is meant to prevent. Application testing is the systematic evaluation of software to identify defects, verify requirements, and assess behavior under expected and adverse conditions. A U.S. National Institute of Standards and Technology funded study published in 2002 estimated that inadequate software-testing infrastructure cost the U.S. economy between $22.2 billion and $59.5 billion annually, equivalent to approximately 0.6% of GDP at the upper estimate.
Why timing changes the price
The same study found that more than half of software errors were not discovered until downstream development stages or after release, when correction and disruption costs were higher. It also estimated that improved testing infrastructure could eliminate about $22.2 billion of those annual costs, and reported that defect identification and correction accounted for approximately 80% of software-development costs.
Those figures are old, and you shouldn’t treat them as your budget forecast. Use them for the mechanism. A defect found while the author still holds the context costs an edit and a re-run. The same defect found after release costs triage, a hotfix, data cleanup, support time, and sometimes refunds or lost trust. Every stage it survives adds people and systems to the bill.
Think of testing as a fire drill for the whole building, not a last coat of paint on the lobby. A drill checks alarms, exits, stairwells, and whether people get out under pressure. Paint only proves the lobby looks finished. Teams that test only at the end get the paint job. They learn the exits are blocked during the fire.
Testing is risk control you run continuously, not a ceremony you perform before deployment.
The four jobs underneath the label
Different checks answer different questions, and confusing them is where beginners get lost.
- Functional checks confirm a feature produces the intended result for a given input and state.
- Integration and system checks examine how components interact once databases, services, and configuration join the picture.
- Performance checks evaluate responsiveness and capacity when many requests compete for the same resources.
- Regression checks confirm a change didn’t break behavior that already worked.
None of these jobs replaces the others. A perfectly calculated price is useless if the checkout times out under load, and a fast checkout that charges the wrong amount is worse than a slow one. You need evidence on correctness and on behavior under stress.
That evidence also has to be repeatable. A tester clicking through once and saying it worked for them leaves no baseline for the next change. Repeatable scenarios, including representative production behavior, let you compare builds on the same workload instead of comparing opinions in a release meeting.
Start from the risk in front of you. A copy change doesn’t need the same depth as a payment change, but both need an explicit answer to one question. What evidence would convince a skeptical teammate that this build is safe? The type map that follows turns that question into specific checks, timings, and owners.
Seven Test Types and When Each One Runs
| Test type | Question it answers | When to run it | Typical owner |
|---|---|---|---|
| Unit | Does this function or class behave correctly in isolation? | Every commit | Developer |
| Integration | Do components, databases, and APIs honor their contracts together? | After related changes merge | Developer or QA |
| Functional | Does the feature produce the result the requirement specifies? | Per story and before release | QA |
| Performance | Does latency, throughput, and saturation stay inside the budget? | Before capacity-sensitive releases | DevOps or performance QA |
| Security | Can an attacker abuse auth, input, or dependencies? | On security-relevant changes and on a schedule | Security or QA |
| Regression | Did this change break behavior that already worked? | Every build that changes code | QA or automation |
| UAT | Can the business accept the system against written criteria? | Before go-live | Product and business users |
Read the table in lifecycle order, because that’s how defects get cheaper or more expensive. Unit tests give the fastest feedback and the narrowest view. They’ll catch a broken rounding rule in seconds, but they can’t see that your service serializes a date differently from the service consuming it. That blind spot is normal, not a failure of unit testing. You cover it one level up.
Integration tests exist for the seams. They expose contract and serialization errors, database constraint surprises, and authentication handoffs that isolated tests mock away. Run them when related changes merge, not days later, because the whole point is catching a mismatch while both authors still remember what they intended.
Where the ISTQB ladder fits
The ISTQB glossary describes testing as including static activities, such as reviews and analysis, and dynamic activities that evaluate software and related work products against specified requirements, fitness-for-purpose expectations, and defect-detection goals. Its test-level model separates component, component-integration, system, system-integration, and acceptance testing, each with distinct test objects, responsibilities, objectives, and defect patterns.
That ladder explains a common confusion. A component can pass alone and fail when its interfaces, databases, external services, authentication flows, or deployment configuration interact. Passing at one level is evidence for that level only. It isn’t a promise about the levels above it.
Practical rule: Match the test level to the place the defect can actually appear. Don’t ask a unit test to prove a deployment configuration works.
Functional tests tie behavior back to a requirement. They need measurable oracles, meaning expected outputs, allowed state transitions, security constraints, latency objectives, and failure-handling behavior written down before the run. Without an oracle, a tester can only report that nothing crashed. That’s a weaker claim than many realize they’re making.
Performance and security tests are non-functional, but don’t let the label make them sound optional. A login flow that works and leaks session tokens has failed. A search page that returns correct results in nine seconds under load has also failed for most users. Schedule security checks as well as triggering them on relevant changes, because new dependency vulnerabilities arrive on their own calendar, not yours.
Regression tests protect yesterday’s wins. They belong on every code-changing build, and they should be mostly automated, because humans re-running the same happy paths get bored and start skimming. Keep the suite ruthless. A regression test that never fails and duplicates a faster test below it still costs runtime on every build.
User acceptance testing closes the loop with the business. It asks whether the complete system satisfies written criteria, and it needs traceability from requirement to test evidence so sign-off is auditable. A demo where a presenter clicks the happy path isn’t acceptance, however polished it looks.
Static work sits beside all of this. A careful review can catch a missing requirement before any code exists, which is the cheapest defect you’ll ever fix. Define entry and exit criteria for each level, then pick depth by risk. Running every type at equal depth on every change wastes time and, paradoxically, trains people to ignore results.
Common Tools Mapped to Each Test Type
| Test type | Common tools | Use for |
|---|---|---|
| Unit | JUnit, pytest, Jest | Fast logic checks in every pipeline run |
| Integration | Testcontainers, Postman, REST Assured | Contracts, databases, and API calls |
| Functional | Selenium, Playwright, Cypress | Scripted user journeys |
| Performance | JMeter, k6, Gatling | Load and stress profiles |
| Security | OWASP ZAP, Burp Suite | Auth, input, and dependency weaknesses |
| Regression | CI runners executing the suites above | Re-running existing behavior on every build |
| Traffic replay | GoReplay | Captured real HTTP workloads replayed to an isolated service |
Pick tools after you’ve picked the question. Choose the option whose language and CI integration match your stack, and give each suite one owner so failures land somewhere specific. A suite nobody owns rots, then gets muted.
Browser tools such as Selenium, Playwright, or Cypress reproduce only the journeys someone scripted. Load tools such as JMeter, k6, and Gatling generate synthetic profiles you can shape into steady or spiky traffic, but they rarely match your real request mix, timing, and session states. Scanners such as OWASP ZAP and Burp Suite find known weakness classes, not business logic flaws unique to your app.
Traffic replay fills the gap between scripted load and production behavior by recording real HTTP requests and replaying them against an isolated service. The tool still doesn’t define coverage. Pair every choice with exit criteria, or you’ll have polished tooling producing evidence nobody uses to decide anything.
Release Metrics That Separate a Green Suite From a Safe Build
| Metric | Useful reading | Hold the release when |
|---|---|---|
| Error rate | Compared with the baseline for the same journeys | Errors climb above that baseline under representative load |
| Latency percentile | p95 or p99 under representative concurrency | The percentile exceeds the agreed budget |
| Saturation | Headroom before resource or dependency limits | Errors rise once CPU, memory, connections, or queues fill |
| Recovery time | Time to return to normal after a dependency failure | The app does not recover inside the agreed window |
| Business-flow coverage | Critical journeys, retries, and session changes exercised | Only isolated happy-path endpoints were checked |
| Code coverage | Share of code executed by tests | A high percentage with no user-flow or integration evidence |
A single correct response proves almost nothing. Your endpoint can return the right JSON for one request and still fall over at real concurrency, queue behind a saturated connection pool, or fail every twentieth user. Dashboards that show pass counts hide this, because assertions and readiness are different claims.
Reading the numbers like an operator
Compare error rate with the last known good baseline for the same journeys, not with a fantasy of zero. Some endpoints legitimately return client errors for expired sessions or invalid input. What matters is whether this build errors more than the build you’re replacing, on the same workload. A rise you can’t explain is a hold, even if every scripted assertion passed.
Use a high latency percentile, such as p95 or p99, under representative concurrency. Averages hide the slow tail, and the tail is where your angriest users live. If p50 looks fine while p99 doubles, a real slice of users just got a much worse product.
Saturation tells you how much headroom remains before CPU, memory, connections, or a dependency queue fills and errors follow. A peak requests-per-second number without headroom is trivia. You want to know how close normal traffic sits to the cliff, because production has a way of finding cliffs on your busiest day.
The third step measures performance and compares responses and application state, and a successful replay alone does not establish correctness.
Coverage signals people misread
Recovery time checks whether the application returns to normal after a dependency blip, a restart, or a brief outage. Systems that need manual intervention to recover from routine failures aren’t production-ready, whatever their steady-state numbers say. Test the recovery, not just the running.
Business-flow coverage asks whether critical journeys were exercised, including retries, session changes, and dependent calls where a later request uses data from an earlier response. Hitting isolated endpoints in any order misses the state bugs that hurt most. Coverage of flows beats coverage of endpoints.
Treat code coverage as a supporting signal only. A high percentage with no user-flow or integration evidence still misses contract defects, timing defects, and configuration defects. Coverage tells you code ran during tests. It doesn’t tell you anyone checked the result was right.
Write four thresholds into your exit criteria before the run starts, covering error rate, latency percentile, saturation, and recovery. Decide them in advance, because thresholds invented after a bad result tend to move. If functional checks pass but error rate or latency breaks the budget under representative load, hold the release. The tests found a capacity risk, and shipping anyway just transfers that risk to your users.
How a Testing Workflow Moves From Requirement to Release
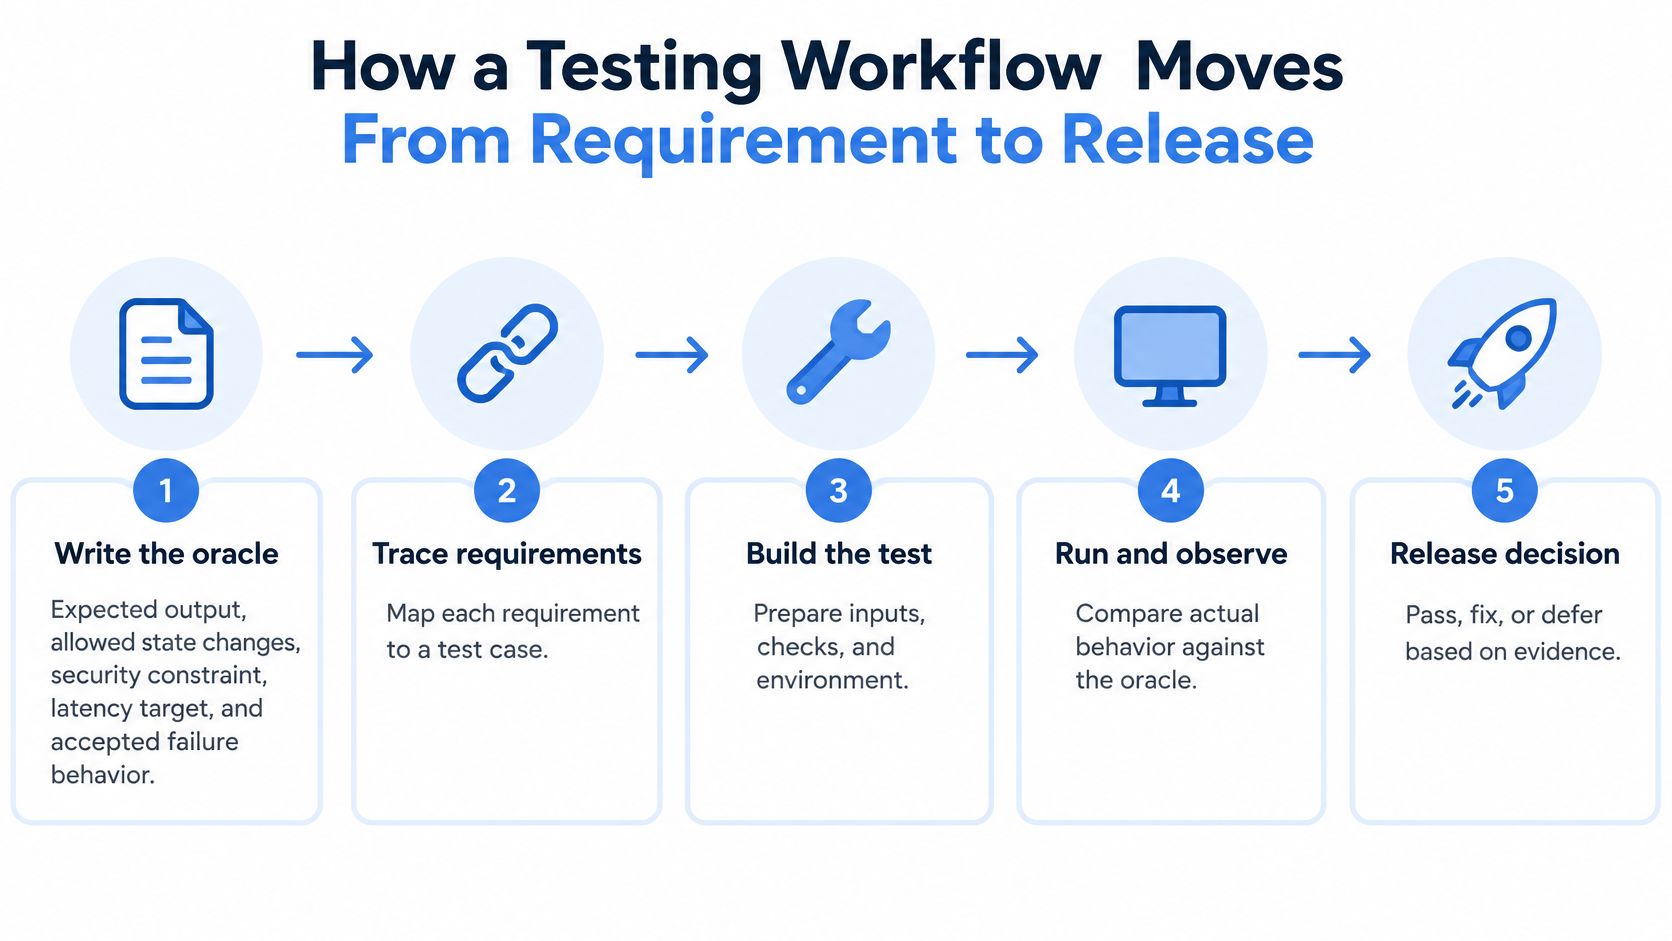
- Write the oracle with the requirement. Record the expected output, allowed state changes, security constraint, latency target, and accepted failure behavior.
- Trace each requirement to a test level. Use the level that can see the risk, as the software testing life cycle lays out, instead of defaulting to UI scripts.
- Set entry criteria. Require a deployable build and confirmed contracts. The common slip is testing against a contract nobody agreed.
- Run fast checks first. Unit, then integration, so a broken function never waits behind a long suite.
- Add system and regression coverage. Cover journeys the change can disturb, not only the endpoint that changed.
- Use a production-like environment for risky changes. Network, cache, and service timing change results.
- Compare with the last known good baseline. Apply the error rate, latency percentile, saturation, and recovery thresholds.
- Record the evidence. Keep test IDs, the baseline run, and metric snapshots so acceptance stays auditable.
Automate the repeatable parts, because in 2024, 39% of more than 800 surveyed software professionals identified manual testing as their most resource-intensive software-quality practice, according to the JetBrains Qodana software quality report. Size combinations by risk too. NIST research on combinatorial testing from 1999 to 2004 found that 70% to 95% of software failures in studied medical-device and web-browser systems were triggered by interactions between only two variables, so tested pairs beat exhaustive combinations.
Examples Where Real Traffic Beats a Scripted Case
Most introductions stop at scripted functional, performance, security, and usability checks. They rarely mention the long tail of production, which is where the expensive defects hide. Three scenarios show the gap clearly.
A checkout passes a single scripted card payment. In production, a customer’s network drops mid-payment, the client retries, the first attempt captured a partial payment, and the session was abandoned and resumed on a phone. The scripted case never overlapped a retry, a partial payment, and an abandoned session, so it never saw the double-charge risk the sequence creates.
An API returns 200 in isolation, every time. Under realistic concurrency it times out, because a cache stampedes on expiry and the connection pool fills with requests waiting on the same uncached query. Nothing in the isolated test was wrong. It never created the conditions where the defect exists.
A login flow works with a fresh token in a scripted journey. Real sessions spread cookies across several TCP connections, and a later request depends on an ID returned by an earlier response. Replay that drops session state passes the login and fails everything after it, or worse, passes everything because it never exercised the dependent chain.

Behavioral representativeness in plain terms
Published guidance on current software testing trends describes the coverage gap between controlled tests and production behavior, including unusual request sequences, unexpected data combinations, concurrency spikes, retries, session transitions, and failures caused by interactions between services. The quality that closes that gap is behavioral representativeness. Your test traffic should resemble your actual users, request mix, timing, session states, and failure modes, not merely inflate a test-case count.
Replay is one practical way to get there. Capture HTTP requests, strip what must not leave production, and replay the sample against an isolated service. The reasoning behind mixing captured traffic with your scripted suites is covered in the notes on development and testing, and the core benefit is comparison. The same workload against two builds turns arguments about a change into measured differences.
The ResDiary migration
ResDiary used GoReplay to validate infrastructure requirements and ensure a smooth migration from RackSpace to Azure, and successfully migrated its UK and Australia regions. The move changed load balancers, databases, and caches at once, which is exactly the kind of change scripted cases under-test. Replaying real traffic let the team estimate infrastructure needs and catch flaws before cutover, including long unsupervised runs during the UK move.
“Using GoReplay, we were able to accurately estimate our infrastructure requirements and highlight the flaws in our prospective setup.” Lewis, ResDiary
That quote matters because the estimate matched the prospective setup before users depended on it. Replay gave the team production-shaped evidence while the old platform still carried the risk.
Know the limits, though. Replay doesn’t refresh a dead token, rebuild missing target data, or invent state your test environment lacks. Treat captured traffic as a workload you still have to prepare, sanitize, and interpret. It widens what your tests can see. It doesn’t remove the need for judgment about what the results mean.
Pitfalls That Leave a Passing Build Unsafe
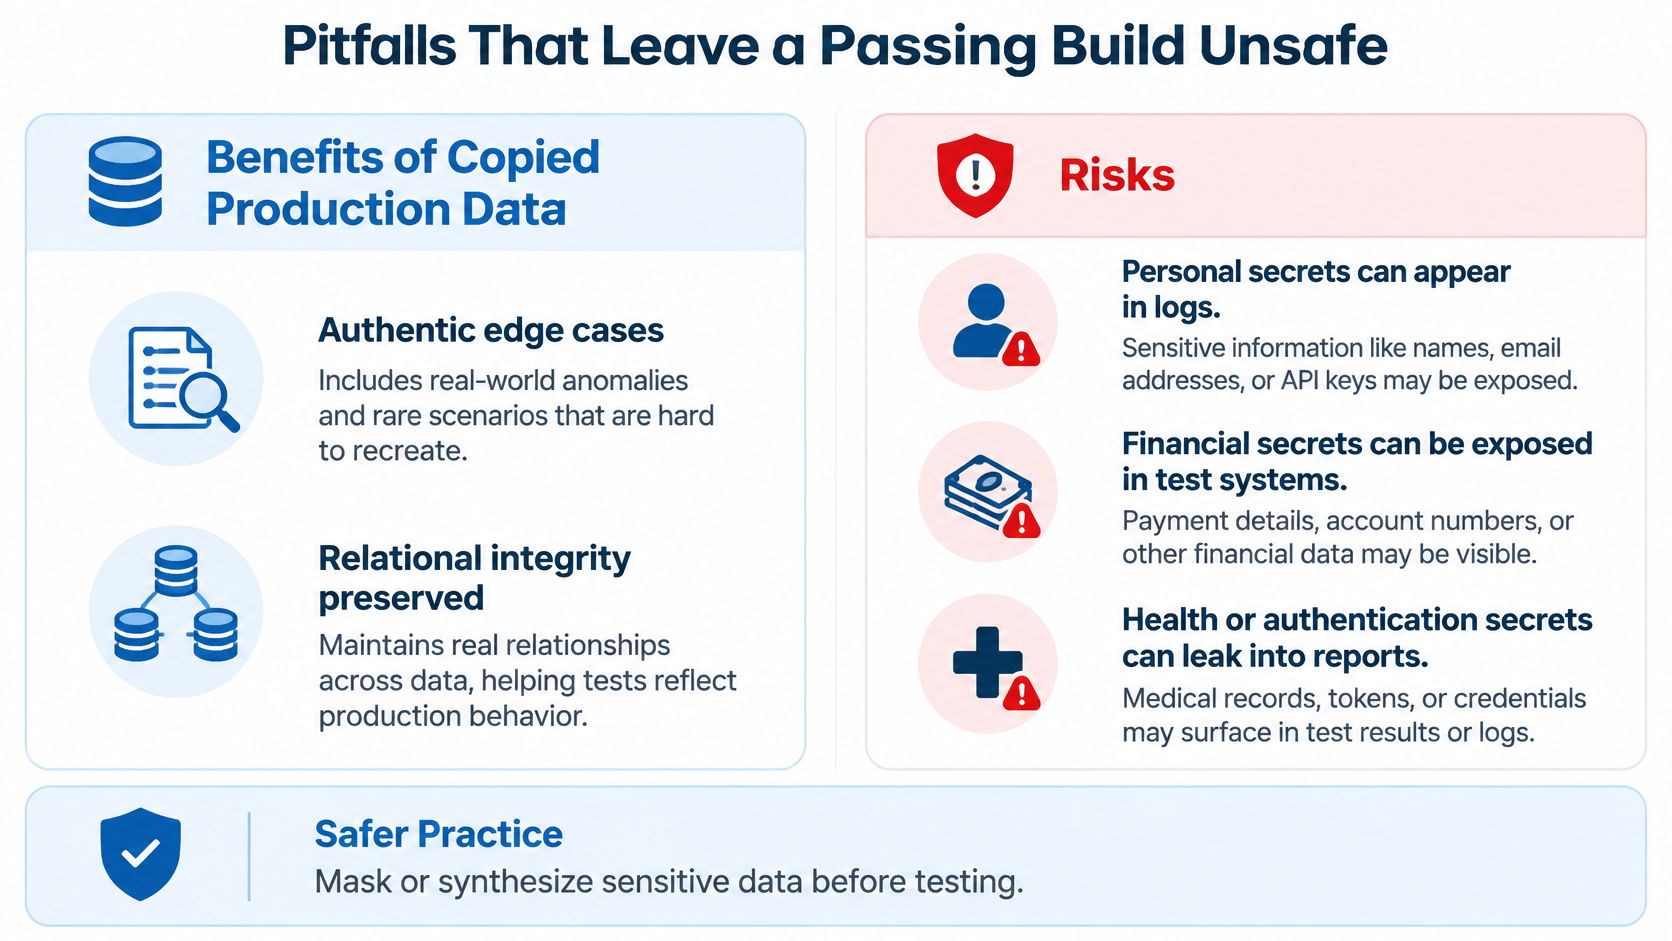
Copied production data gives authentic edge cases and relational integrity, but it can spread personal, financial, health, or authentication secrets into logs, payloads, and non-production systems that rarely get production-grade protection. The symptom is a staging database holding real session tokens. The fix is to classify fields and payloads, mask or replace sensitive values while keeping needed relationships, restrict access, expire datasets, and audit every replay.
Synthetic data carries the opposite risk. It can drop rare states such as partial payments, abandoned sessions, fraud-like patterns, malformed inputs, or unusual account relationships, so the suite stays green until the first real partial payment breaks production. One reported survey figure in a roundup of QA trends and insights says synthetic-data adoption rose from 14% to 25% year over year. That shows adoption, not defect-finding power. Compare sanitized traffic against synthetic cases so the rare states survive.
Two more pitfalls round out the list. A flat requests-per-second blast that ignores think time and dependent request order passes the peak test and fails when real sessions arrive, so model think time and sequence dependent calls. UAT run as a demo signs off only the presenter’s happy path, so trace each acceptance criterion to evidence before go-live.
Measure the trade-off as risk-adjusted realism, meaning how much real behavioral and data complexity you retain per unit of privacy exposure. Keep enough complexity to find defects and no more personal data than the test requires.
Replay One Real Workload Before You Ship
Pick the riskiest user journey in your current change. Not the whole system, and not the easiest flow to automate. The journey where a defect costs money, trust, or someone’s weekend. Then refuse to ship it on scripted checks alone.
Your next step is small and concrete. Capture a slice of real HTTP traffic for that journey, remove unsuitable requests, rewrite anything that would hit live side effects, and replay it against an isolated test service. That’s the workflow GoReplay supports. It records HTTP requests and replays them against an isolated test service, and its load-testing use replays a captured workload at a chosen speed while you measure latency, errors, and resource limits.
“We soak test our new and old versions of our web service and the compare their metrics to discover bugs. Great stuff!” Sahil, videologygroup.com
Sahil’s approach is the right shape. Old build and new build, same workload, compared metrics. You’re not asking whether the new build works in the abstract. You’re asking whether it behaves at least as well as the build it replaces, under traffic that your users generated.
Start with what’s free to try. The Open Source edition covers HTTP traffic capture and replay, request filtering, rewriting and middleware, a command-line interface, and community support. That is enough for a first replay of one journey, which is all you need to learn whether captured traffic finds things your scripts miss.
Consider PRO only when a specific gap shows up. It adds S3 capture storage and replay, keep-alive TCP session recognition, dedicated support, and a commercial license on top of the Open Source edition. Session recognition matters when your journeys depend on state across connections, as in the login example. Stored captures matter when you want a reusable library of workloads instead of recapturing each time.
Keep two guardrails in place. First, speed alone isn’t success, so compare responses and application state against your error, latency, and saturation budgets, because a fast wrong answer is still wrong. Second, keep masked data inside your privacy rules, with sensitive values replaced and access restricted. Realism you can’t govern is a liability, not an asset.
Ship when the journey meets its functional checks and its error, latency, and saturation budgets under that replayed workload.
Capture one real workload this week and replay it against your next build before your users run it for you, comparing errors, latency, and responses against the current version. GoReplay gives you open-source HTTP capture and replay to start with, plus a PRO edition when you need stored captures and session-aware replay.