Test Data Driven Testing: Accelerate QA with Real Traffic
So, what exactly is data-driven testing? It’s a testing approach where you run your test scripts against a whole bunch of real-world data instead of relying on hardcoded, synthetic values. This simple change completely separates your test logic from the data itself, letting you see how your application really behaves with the kinds of inputs actual users throw at it every day.
Why Real Traffic Is the Gold Standard for Testing
Most traditional testing relies on data that’s been manually created or synthetically generated. And while that’s better than nothing, it’s basically a guessing game. Engineers have to try and anticipate every single possible user input, edge case, and bizarre sequence of actions—which, let’s be honest, is an impossible task. This method always leaves gaps in your test coverage because you just can’t replicate the sheer randomness and complexity of real people using your software.
This is where using actual production traffic for data-driven testing changes everything. Instead of inventing scenarios, you capture the real HTTP requests your users are making. This raw traffic becomes the very foundation of your test suite, giving you a high-fidelity dataset that shows you exactly how your application is being used in the wild.
The Problem With Manual Test Data
Manually created data just doesn’t cut it for a few key reasons. It almost always follows the “happy path,” completely missing the weird, unexpected inputs that real users come up with. For example, a synthetic test might check if a search works with a simple keyword, but it probably won’t account for someone pasting in a long, complex query full of special characters or trying to navigate with funky URL parameters.
These aren’t just minor details; they’re the source of those painful, hard-to-reproduce production bugs. Without a realistic data source, you’re essentially testing in a sterile lab that looks nothing like the chaotic reality of your production environment.
Let’s break down the differences. The old way of creating test data just can’t compete with the realism you get from actual users.
Synthetic vs Real Traffic Data in Testing
| Attribute | Synthetic Data Testing | Real Traffic Testing (Data-Driven) |
|---|---|---|
| Realism | Low; based on assumptions and “happy paths.” | High; reflects actual user behavior and inputs. |
| Edge Case Coverage | Poor; often misses unexpected user actions. | Excellent; captures real-world edge cases organically. |
| Complexity | Simple, predictable scenarios. | Complex, unpredictable, and varied user journeys. |
| Maintenance | High; data must be constantly created and updated. | Low; new data is captured automatically. |
| Confidence Level | Moderate; tests a limited, idealized version of the app. | High; validates against proven, real-world conditions. |
As you can see, making the switch is less of an upgrade and more of a fundamental shift in how you validate your code.
Embracing Production-Grade Realism
When you use real traffic, you stop simulating and start replicating. Every API call, every form submission, every user journey captured from production is a test case that has already happened. The benefits are immediate and impactful:
- Uncover Hidden Bugs: Real traffic exposes the kind of edge cases you’d never dream up, like malformed headers or strangely encoded payloads.
- Validate Performance Under Load: Want to know how your system handles peak traffic? Replay it. This is the most accurate way to find performance bottlenecks before they hit your users.
- Ship With Confidence: When you know your changes can handle actual production requests, you can deploy more often and without that feeling of dread.
This data-first approach is quickly becoming a pillar of modern software development. High-performing organizations are seeing data-driven testing adoption rates as high as 78%, because they know synthetic tests can miss over 44% of defects that only show up in production. By validating against real traffic, these teams are slashing post-release bugs by up to 50%. You can learn more about the impact of data-centric approaches in software testing.
“Your best test data is your production data. It contains the nuance and unpredictability that synthetic data can never truly capture. Using it is the fastest way to build resilience into your application.”
Setting Up GoReplay to Capture Production Traffic

The first real step in building a test data driven testing pipeline is getting your hands on clean production traffic. This is exactly what GoReplay was built for. Think of it as a lightweight listener that records HTTP requests without getting in the way of your application’s performance.
Getting started is refreshingly simple. You can install it directly from pre-compiled binaries for whatever OS you’re running. On a typical Linux server, a quick wget and tar command is often all you need to get the executable ready to go.
Once it’s installed, you just point GoReplay at your application’s network port to start listening. It works by passively sniffing network packets, which means it introduces zero latency and won’t ever become a point of failure for your live services. This non-intrusive approach is critical—you capture a rich dataset of real user interactions without your users or your app ever knowing it’s there.
Starting the Traffic Capture Process
With GoReplay installed, you can kick off the capture process. At its core, the command just needs an input source (your server’s port) and an output destination (a file to save the traffic). Everything is handled right from the command line, giving you precise control.
A basic command to start capturing traffic on port 80 and save it to a file named requests.gor looks like this:
sudo ./gor --input-raw :80 --output-file requests.gor
This tells GoReplay to listen for raw TCP traffic on port 80 and write every request it sees to that file. The .gor file format is optimized for fast writing and even faster replaying, keeping the whole workflow efficient.
The real power of GoReplay isn’t just capturing everything—it’s capturing the right things. Filtering traffic at the source is far more effective for building targeted and meaningful test suites.
Filtering and Refining Your Captured Data
Let’s be honest, not all production traffic is useful for every test. You might only care about POST requests to your /api/v1/users endpoint, or maybe you want to filter out the noise from health checks. GoReplay’s command-line flags give you powerful filtering tools to collect a clean dataset right from the start.
Here are a few of the most useful flags I find myself using all the time:
--http-allow-method: Use this to zero in on specific HTTP methods. For example,--http-allow-method POST --http-allow-method PUTwill only grab requests that create or update data.--http-allow-url: This flag is perfect for targeting specific API endpoints with regular expressions. Something like--http-allow-url /api/v1/users.*would capture all traffic related to user profiles.--http-disallow-header: You can exclude requests based on their headers. This is great for filtering out traffic from internal monitoring tools or specific user agents you don’t care about.
By combining these flags, you can craft a highly specific dataset tailored to your exact testing needs. Imagine capturing only failed login attempts or isolating all the API calls for a brand-new feature. This targeted approach makes your test data driven testing strategy much more focused and actionable.
Proper configuration is what makes the whole workflow smooth. To get a better handle on different setups, check out GoReplay’s guide on setting up for testing environments for more advanced examples. Mastering these commands is how you turn chaotic production traffic into a structured, invaluable asset for your entire QA process.
Sanitizing Traffic to Protect User Privacy
Using production traffic is a game-changer for building a realistic test data driven testing suite, but it comes with a massive responsibility. That raw data is packed with personally identifiable information (PII)—names, emails, API keys, passwords, you name it. Letting that data touch a non-production environment as-is isn’t just bad practice; it’s a huge security risk and a compliance nightmare waiting to happen.
This is where data sanitization becomes completely non-negotiable. Before any captured request gets replayed against a staging or dev server, you have to scrub it clean of all sensitive info. The idea is to keep the structure and behavior of the original requests intact while swapping out the actual PII with safe, anonymous values.
Thankfully, GoReplay has powerful middleware that lets you modify traffic on the fly, either as it’s captured or replayed. This means you can build an automated sanitization workflow, ensuring no raw user data ever leaves the safety of your production environment.
Rewriting and Anonymizing Sensitive Data
GoReplay’s middleware gives you the power to intercept and modify HTTP requests with simple command-line flags. You can rewrite headers, change URL paths, and even dig into the request body to anonymize specific fields in a JSON payload. That level of fine-grained control is exactly what you need to create test data that’s both realistic and secure.
For example, you might need to swap out an Authorization header containing a real user’s API key with a static, non-production key that your staging environment will accept. In the same way, you can use regular expressions to find and replace things like email addresses or credit card numbers anywhere in the request.
Here are a few common ways you can use GoReplay’s middleware flags:
--http-set-header 'Authorization: Bearer test-token': This command simply replaces the original auth header on every request with a safe, static test token.--http-rewrite-url /v1/user/([0-9]+):/v1/user/test-user-\$1: This one is a bit more clever. It uses a regex to transform a real user ID in the URL into a prefixed staging user ID, keeping the original number for uniqueness.--http-set-param 'api_key=staging-key': This overwrites a specific query parameter, making sure no production API keys leak into your test environment.
The core principle here is to keep the shape of the data without exposing the content. A valid but fake email address is just as good for testing a registration form as a real one, but it carries zero privacy risk.
Handling PII in JSON Payloads
Modern APIs are all about JSON, and sensitive data is often buried deep inside the request body. Think about a user creation endpoint—it probably has fields for email, password, and firstName. To sanitize this properly, you need a way to target and transform those specific fields.
This is where GoReplay’s advanced features really shine, giving you the ability to hash or replace specific JSON fields. You could set up a rule to replace the value of any field named password with a fixed string like "sanitized-password". Your application logic still gets tested with a valid-looking password field, but the real credentials are never exposed.
The shift toward Testing-as-a-Service (TaaS) really underscores how important this is, with the market expected to grow at a healthy 15.09% CAGR. In regulated industries like banking, teams have to test with data that mimics actual payment rails to meet PCI-DSS compliance. GoReplay’s data masking features are critical for this, as they protect sensitive info while simulating real user patterns—a must-have for any enterprise team validating systems without exposing protected data.
GoReplay offers a variety of techniques to help you scrub your data effectively.
Common Data Masking Techniques in GoReplay
Here’s a quick look at some of the most common data masking and transformation methods available in GoReplay for cleaning up production traffic.
| Technique | Description | Example Use Case |
|---|---|---|
| Static Substitution | Replaces a sensitive field with a fixed, non-sensitive value. | Changing all Authorization headers to Bearer test-token. |
| Hashing | Transforms data into a fixed-length hash, preserving uniqueness without exposing the original value. | Hashing user email addresses to track unique users without storing actual emails. |
| Regular Expression | Uses pattern matching to find and replace sensitive data within URLs, headers, or the request body. | Finding and replacing credit card numbers matching the Luhn algorithm pattern. |
| Param Manipulation | Modifies specific query parameters in the URL. | Overwriting an api_key query parameter with a static staging key. |
| Field-Specific Rules | Targets and transforms data based on specific field names within a JSON or form payload. | Replacing the value of any field named password with a generic string like "sanitized". |
These methods give you the flexibility to handle almost any sanitization scenario, from simple header rewrites to complex payload transformations.
For a deeper look at these strategies, you can learn more about masking production data for testing to ensure your workflow is truly secure. Building a solid sanitization process is the single most important step in creating a safe and effective test data driven testing strategy. It gives you all the realism of production traffic with none of the risk.
Unleash Real Traffic for Smarter Load Testing
Once you’ve captured and sanitized your traffic, it’s time for the real test. This is where you unleash that realistic data against your non-production environments to see exactly how your application holds up under pressure. We’re moving beyond theory and into tangible, real-world validation—the heart of any serious test data driven testing strategy.
Replaying real traffic isn’t just another regression test; it’s like simulating a genuine slice of your production reality. This is how you find the performance bottlenecks, subtle functional bugs, and weird degradations tied to actual user behaviors—long before a customer ever stumbles upon them.
One Traffic File, Many Testing Strategies
The best part about having a captured traffic file is its flexibility. You don’t have to replay it the same way every time. Your testing goals will dictate the strategy.
- Quick Regression Checks: Replay traffic at its original speed (1x) against a new feature branch. Think of it as a powerful sanity check to ensure a code change didn’t just break something completely unrelated in a common user path.
- Accelerated Replay for CI/CD: Who has time to wait? Condense hours of production traffic into minutes. By replaying an hour of peak traffic at 10x speed, you get critical feedback in just six minutes. It’s a perfect fit for a fast-paced CI pipeline.
- Hardcore Stress and Load Testing: Want to know what happens during a sudden traffic surge? Scale it up. Replaying your peak hour at 500% or 1000% of its normal volume will quickly show you where your system starts to crack.
This versatility is key. A single captured dataset can pull triple duty, serving everything from a quick functional check on a developer’s machine to a full-blown load test that pushes your infrastructure to its absolute limits.
Fine-Tuning the Flow and Scale of Your Replay
GoReplay gives you simple but powerful command-line flags to control precisely how your traffic gets replayed. You can dial in the exact speed, volume, and destination for every request.
Let’s say you’ve captured an hour of your busiest traffic into a file named peak-traffic.gor. To run a proper load test against your staging environment, you’ll want to ramp things up.
You could run a command like this:
gor --input-file "peak-traffic.gor" --output-http "http://staging-server.internal" --rate 500%
This tells GoReplay to hammer your staging server with the captured requests at five times the original speed. It’s an incredibly direct way to find out if that recent database optimization or new caching layer actually improved performance under heavy, realistic load.
The point isn’t just to throw random traffic at a server. It’s about simulating realistic load patterns. By controlling the rate, you can mimic everything from a gradual ramp-up of users to an instantaneous, overwhelming flash sale.
This kind of data-driven testing is becoming mission-critical, especially for teams in regulated sectors that need to validate system safety and compliance. For internet and tech companies, where 63.6% of workloads are already under test, these peak capacity simulations are standard practice. Meanwhile, the retail sector, with similar workloads (60.7%) but much lower automation (35.7%), can use replay tools to scale testing without scaling headcount. You can dive deeper into these QA trends and their impact here.
Why Session Awareness is Non-Negotiable
Here’s a common pitfall: user sessions are stateful. A user logs in, adds a few items to their cart, and then checks out. Firing those requests out of order or for different “users” is meaningless. They depend on each other.
GoReplay gets this. It can track a unique identifier—like a session cookie or an auth token—to ensure all requests from a single user are replayed in the exact sequence they originally occurred. This session-aware replaying preserves the logical flow of user journeys, making your tests far more realistic and way better at catching tricky bugs related to state management.
Without it, you’re just blasting disconnected requests at your app. That doesn’t tell you how it handles real people.
Integrating Traffic Replay into Your CI/CD Pipeline
Capturing and replaying traffic manually is a great way to get started, but the real power of test data driven testing is unlocked through automation. When you plug traffic replay directly into your Continuous Integration and Continuous Deployment (CI/CD) pipeline, you transform it from an occasional spot-check into an always-on safety net that validates every single code change.
Weaving GoReplay into platforms like GitHub Actions or GitLab CI is surprisingly simple. The goal is to set up a dedicated stage in your pipeline that triggers right after your application builds and deploys to a staging environment. This new stage automatically grabs the latest sanitized traffic file and replays it against your freshly deployed code.
Automating the Entire Workflow
To make this happen, you’ll need to script a few key actions. A common approach is to configure a nightly job that captures a fresh batch of production traffic, sanitizes it, and then uploads it to a shared location like an S3 bucket.
From there, your CI pipeline just needs to pull down that file before running the replay command against your staging server.
This creates a completely hands-off workflow. A developer merges a pull request, the pipeline kicks off, and within minutes they get feedback showing exactly how their changes handled thousands of real-world requests. It’s a massive leap forward from relying only on unit or integration tests.
The basic loop for this kind of load testing is straightforward: sanitize the data, replay it against your test environment, and analyze what happens.
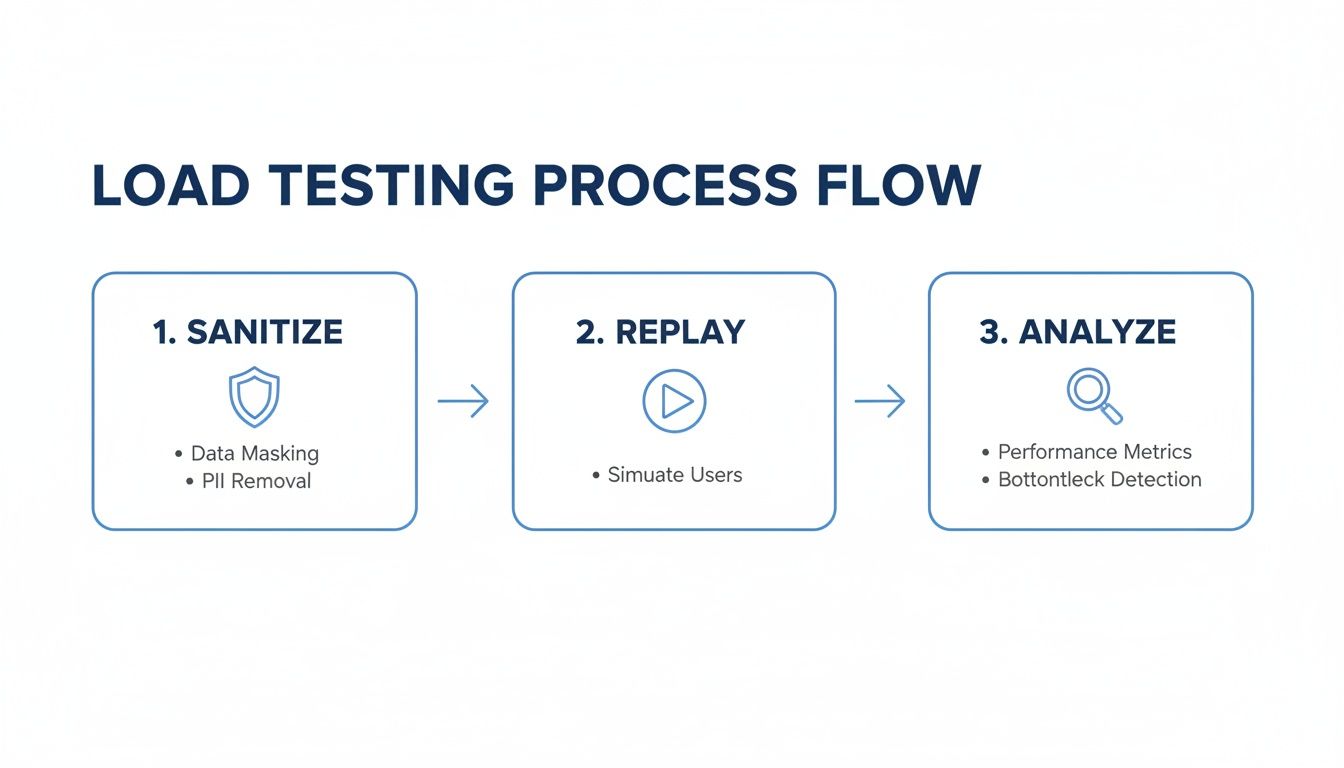
This simple, three-step process turns your production traffic into a powerful, reliable asset for validating every release.
Defining Success and Failure in Your Pipeline
An automated test is only useful if it knows what success looks like. Just replaying traffic isn’t enough; you have to define clear pass/fail conditions for your CI system. With GoReplay, you have a few solid metrics to build your rules around.
- HTTP Status Codes: The most obvious check is for
5xxserver errors. You can set a simple threshold—for instance, failing the build if500errors increase by more than 1% compared to the production baseline. - Response Differences: GoReplay can compare the responses from your staging environment against the original responses from production. If critical API endpoints start returning different payloads, you can immediately flag it as a regression.
- Performance Metrics: Latency is a huge indicator of application health. Your pipeline can fail the build if the average or 99th percentile response time gets worse beyond a set limit, letting you catch performance drags before they ever reach users.
By scripting these conditions, you remove all the guesswork. The pipeline doesn’t just run a test; it makes a clear, automated judgment on whether the new code is safe to promote. This automated gatekeeping is what gives teams the confidence to deploy multiple times a day.
For example, a gitlab-ci.yml file could include a script that runs GoReplay, then parses its output to check the percentage of non-2xx responses. If that number crosses a line, the script exits with a non-zero code, which automatically fails the pipeline stage and blocks a potentially bad deployment. This tight feedback loop is the heart of a modern test data driven testing strategy.
What to Do with Your Test Results
Replaying traffic is a fantastic way to validate your system, but let’s be honest—the real magic happens when you start digging into the results. Just running the tests isn’t enough. You need a solid process for analyzing the output, spotting regressions, and turning that data into real improvements. The goal is to move beyond a simple pass/fail mindset and truly understand how your application behaves under a realistic load.
The first thing to hunt for are the obvious red flags: new 5xx server errors. A sudden spike in these is a dead giveaway that a recent change introduced a critical bug. GoReplay’s output makes it incredibly easy to spot these regressions fast, letting your team trace the problem back to the exact commits that caused the instability.
Reading Between the Lines: Interpreting Response Differences
Beyond outright server errors, the more subtle clues are often found in the differences between your staging responses and the original production ones. GoReplay can automatically compare these for you, highlighting discrepancies that could point to sneaky functional regressions.
For instance, a seemingly minor change to a JSON payload might not throw an error, but it could easily break downstream consumers of your API.
- Payload Structure Changes: Did a field get renamed or removed? This is a classic breaking change that even good unit tests can miss.
- Data Inconsistencies: Is an endpoint suddenly returning
nullvalues where it used to return data? This could signal a flawed database query or a new logic error. - Performance Degradation: Keep a close eye on latency. If a critical endpoint’s average response time jumps by 20%, that’s a performance regression you need to investigate before it frustrates real users.
This kind of detailed comparison helps you catch issues that aren’t just crashes, but actual behavioral changes in your application.
The most valuable insights often come from the unexpected differences. A test that “passes” but returns a slightly different response is where the most elusive bugs love to hide.
Keeping Your Test Suite Fresh for Long-Term Value
A data-driven testing suite isn’t a “set it and forget it” tool; it’s a living asset that needs regular maintenance. The production traffic you captured last month might not accurately reflect your current usage patterns, especially if you’ve just launched new features.
To keep your tests relevant, you’ll want to get into a rhythm of refreshing your captured traffic. A common and effective practice is to set up an automated job to capture a new 24-hour slice of traffic every week. This ensures your test suite evolves right alongside your application and its users. It’s also a great idea to maintain separate datasets for different scenarios—like one for peak holiday traffic and another for a typical Tuesday—so you can test for specific, high-stakes conditions.
Still Have Questions?
Even with a solid plan, jumping into data-driven testing with real traffic can feel like a big step. Let’s tackle some of the most common questions that come up when teams first get their hands dirty with this workflow.
How Much Overhead Does GoReplay Add to Production?
This is the big one, and the answer is simple: practically none.
GoReplay is built from the ground up to be a passive listener. It sniffs network packets directly from the network interface instead of sitting in the request path like a proxy. This means it adds zero latency to your application’s response times. Your production services won’t even know it’s there, making it completely safe for even the highest-traffic environments.
What If My Application Uses Dynamic Data?
This is a classic problem. Many apps rely on things like session IDs, CSRF tokens, or timestamps that are unique to every single request. Simply replaying old values is a surefire way to get a wall of errors.
This is exactly what GoReplay’s middleware was designed for. You can write simple scripts to handle these dynamic situations on the fly:
- Extract and Replace: Grab a dynamic value from a response (like a new session token) and inject it into the next request for that same user.
- Generate Fresh Data: Have a middleware script create new timestamps or other time-sensitive data during the replay itself.
This is how you ensure stateful user journeys stay valid, even long after the original data has expired.
Correctly handling dynamic data is what separates a simple request blast from a true simulation of user behavior. It’s the key to realistic, stateful testing.
Is It Secure to Use Production Traffic?
Yes, but only if you sanitize it first. This part is non-negotiable.
Raw production traffic is full of sensitive user data (PII), and copying it into a less-secure staging environment is a massive security risk. You absolutely must use GoReplay’s built-in masking and rewriting features to anonymize all sensitive fields before that traffic gets saved or replayed anywhere.
Ready to stop guessing and start testing with data that reflects reality? GoReplay gives you everything you need to capture, sanitize, and replay production traffic safely and effectively.
Get started today by visiting https://goreplay.org.