Why Your App’s Performance Issues Are Hiding In Plain Sight

It’s a story I’ve seen play out time and again. An application runs perfectly on a developer’s high-spec laptop with a great WiFi connection. A single user clicks through the demo, and every feature is snappy. But the moment that app goes live and faces real-world conditions—hundreds of concurrent users, spotty network latency, and different devices—the smooth experience crumbles. This gap between the clean, controlled development environment and the chaos of production is where performance gremlins thrive.
The real trouble is that these issues rarely show up as one big, obvious bug. Instead, they’re a collection of small, compounding problems. A slightly sluggish database query, a non-optimized image, or a chatty API call might be unnoticeable in isolation. But when hundreds of users hit those actions at the same time, system performance can degrade exponentially. I’ve watched teams, confident in their code, see their app buckle under a modest traffic spike simply because they never planned to test application performance under realistic load. They were caught off guard, fighting fires that could have been found and fixed weeks earlier.
The True Cost of “Good Enough” Performance
Waiting for users to report that your app is slow is a risky game that can cost you both reputation and revenue. A seemingly minor slowdown can have a huge impact. For example, if an e-commerce site takes just a few extra seconds to load a product page, conversion rates can plummet. Modern users have very little patience for lag; they’ll just leave and find a faster competitor. This isn’t just about one lost sale—it’s about losing customer trust and future business.
Shifting from reactive firefighting to proactive performance planning is critical. This means going beyond basic unit tests and looking at the entire end-to-end user journey. You need to see how the whole system behaves when different parts interact under stress. This is where tracking the right metrics becomes non-negotiable.
From Guesswork to Data-Driven Decisions
To really understand your app’s behavior, you have to measure it. In 2025, teams commonly track over 20 key performance testing metrics, including response time, error rate, and throughput. Metrics like mean time to failure (MTTF) and defect density can help you find bottlenecks and predict how your system will act under a heavy load.
Choosing the right metrics helps you connect your testing efforts to real business goals, like minimizing downtime and keeping users engaged. When you use data to guide your decisions, you stop guessing and start making meaningful improvements. You can explore a detailed list of these crucial performance testing metrics to learn more about their impact and how they can inform your strategy.
Building A Testing Environment That Actually Reflects Reality
Testing in a perfect, sterile bubble gives you perfect, sterile results—which are perfectly useless the moment real users show up. To truly test application performance, your environment must mirror the messy, unpredictable world your app will actually live in. I’ve seen teams make costly mistakes by testing on pristine setups that bore no resemblance to production, which led to absolute chaos after launch.
Their biggest oversight? They assumed production conditions could be simulated with clean data and over-provisioned hardware. The goal isn’t to build an exact replica, which is often impossible, but a representative one that stresses the right components.
Replicating Production Without Breaking the Bank
Creating a production-like environment doesn’t mean you need to duplicate your entire expensive infrastructure. Instead, the trick is to replicate the constraints.
- Server and Database Constraints: If your production server has 8GB of RAM, don’t test on a 32GB machine. Use containerization tools like Docker to enforce memory and CPU limits that match your live servers. For databases, instead of using a top-tier managed service for testing, run a local instance with similar configuration limits.
- Network Conditions: Your users won’t all have gigabit fiber. Use network simulation tools to introduce latency and packet loss. This is crucial for uncovering how your app behaves on a spotty 4G connection—a far more common scenario than you might think.
This bar chart shows key performance metrics from a test environment versus a more realistic, constrained setup.
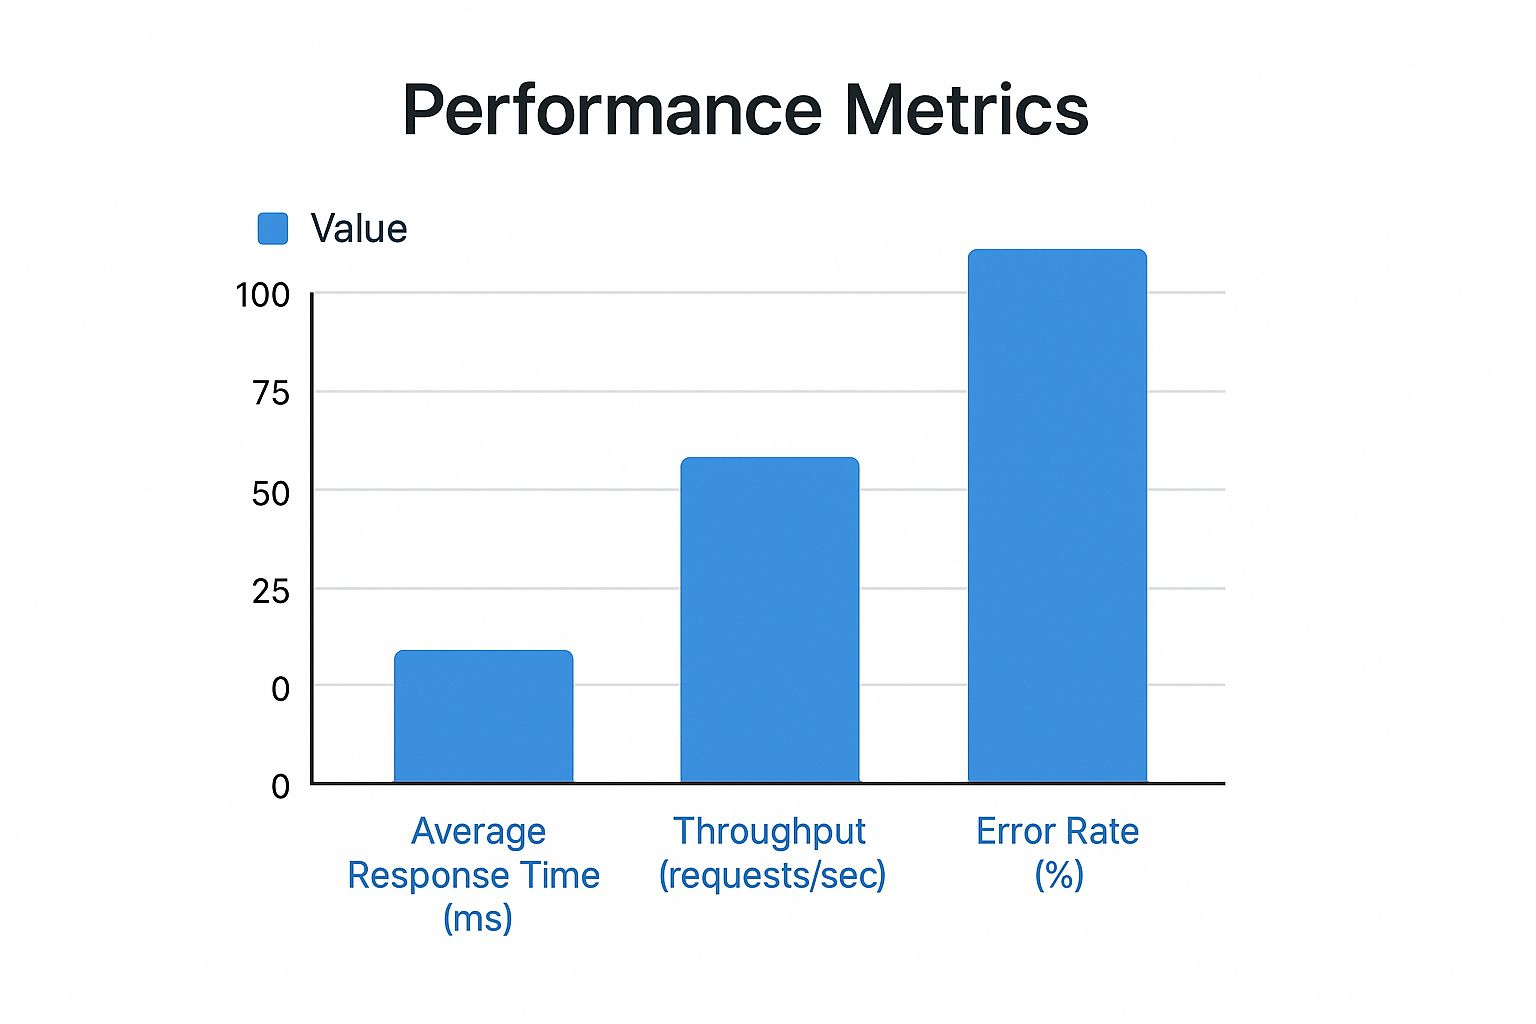
The data clearly shows that while throughput drops in a realistic environment, the error rate spikes dramatically, revealing hidden breaking points that a “perfect” setup would have missed.
The Art of Realistic Test Data
Your biggest blind spot is often your data. Sanitized, uniform test data won’t expose the edge cases that real user information will. Think about usernames with special characters, unusually long addresses, or profiles with missing fields. A fantastic technique is to use a tool like GoReplay to capture and anonymize a slice of production traffic. This gives you the variability of real user inputs without compromising privacy.
This focus on realism is why the software testing market is booming. The need for quality applications has made scalability testing a key focus, with the market projected to grow by 40% in 2024. Cloud platforms are making it easier to run these realistic simulations, helping teams find bottlenecks much earlier in the development cycle. To help you choose the right platform, here’s a quick comparison of some popular cloud-based options.
Cloud-Based Performance Testing Platforms Comparison
Compare features, pricing, and capabilities of leading cloud-based performance testing platforms
| Platform | Key Features | Pricing Model | Best For |
|---|---|---|---|
| BlazeMeter | JMeter/Selenium compatible, CI/CD integration, advanced reporting, mock services. | Tiered subscription based on virtual users and test frequency. | Teams already using open-source tools like JMeter and needing enterprise-level reporting and scalability. |
| K6 Cloud | Developer-centric, scriptable in JavaScript, focus on API testing, performance insights. | Based on Virtual User Hours (VUH), with free and paid tiers. | Developers and DevOps teams who prefer writing tests in code and integrating them into their CI/CD pipelines. |
| LoadRunner Cloud | Broad protocol support, browser-based and API testing, integrates with Micro Focus ecosystem. | Varies (per virtual user hour or subscription). | Enterprises needing to test a wide variety of application types, including legacy systems, with comprehensive analytics. |
| Gatling | High-performance load generator, detailed metrics, Scala-based DSL. | Open-source core with an enterprise version (Gatling Enterprise) for advanced features and cloud execution. | Teams comfortable with Scala or Kotlin looking for a high-performance, code-based testing framework. |
Each of these platforms offers unique advantages, but the best choice depends on your team’s skillset, existing tools, and specific testing needs. While BlazeMeter and LoadRunner are powerful for large enterprises, K6 and Gatling offer a more developer-friendly, code-centric approach. You can check out some more top tools for testing software scalability to see how the industry is evolving.
Picking Performance Testing Tools That Won’t Let You Down
The market for performance testing tools is noisy. Many options promise the world but end up creating more confusion than clarity. To properly test application performance, you need a tool that fits your team’s workflow and technical skills, not just one with a flashy feature list. The choice often comes down to a classic dilemma: open-source flexibility versus commercial support and polish.
Open-Source Powerhouses vs. Commercial Solutions
Open-source tools like Apache JMeter and Locust have been the foundation of performance testing for years. They are free, community-supported, and incredibly flexible. JMeter, for instance, offers a UI-driven approach that’s great for getting started, while Locust allows developers to write tests in Python, which is perfect for integration into a modern CI/CD pipeline. The tradeoff? They can have a steep learning curve and require significant in-house expertise to maintain and scale.
Here’s a peek at the Apache JMeter interface, which shows how test plans are constructed visually.

This tree-based structure lets testers build complex scenarios, but it also highlights the manual effort required for setup and maintenance.
On the other hand, commercial tools like BlazeMeter and LoadRunner offer a more guided experience, often with polished reporting dashboards, cloud-based load generation, and dedicated support. These platforms often build upon open-source foundations (BlazeMeter is built on JMeter) but package them with enterprise-grade features. The primary downside is cost, which can be substantial, especially for large-scale tests. Your decision should hinge on a simple question: does the cost of the tool save you more in engineering time and potential downtime? For some teams, the answer is a clear yes.
Making the Right Choice for Your Team
Before you commit to a tool, consider these practical factors:
- Team Skillset: Does your team prefer writing code or using a graphical interface? Choosing a tool like Locust for a team unfamiliar with Python will lead to frustration and slow adoption.
- Protocol Support: Does your application use standard HTTP/S, or do you need to test more complex protocols like gRPC or WebSockets? Ensure your chosen tool can handle your specific tech stack.
- Integration Needs: How well does the tool fit into your existing development workflow? Look for solutions with robust API access and command-line interfaces that can be easily integrated into your CI/CD pipeline.
- Realism of Simulation: How accurately can the tool mimic real user behavior? This is where a tool like GoReplay offers a unique advantage. Instead of scripting user journeys from scratch, GoReplay lets you capture and replay actual production traffic, providing the most realistic load possible. This approach is invaluable for uncovering bottlenecks that scripted tests might miss. For more information, you can explore how to benchmark application performance with real-world scenarios.
Creating Test Scenarios That Mirror Real User Behavior
The biggest mistake I see teams make when they test application performance is creating scenarios that simulate robots, not people. A script that clicks a button every two seconds with perfect precision tells you very little. Real users are messy; they pause to read, get distracted, click the wrong thing, and follow unpredictable paths through your application. Your test scenarios must embrace this chaos to be effective.
The best place to start is with your existing analytics data. Tools like Google Analytics or Mixpanel are treasure troves of information about how real people navigate your site. Instead of guessing, analyze the most common user journeys—the critical user journeys—and use them as the foundation for your tests. What are the top three paths users take after landing on your homepage? How long do they typically spend on the product page before adding an item to their cart? This data-driven approach moves you from abstract testing to simulating tangible, impactful user flows.
From Load Testing to Stress Testing
Once you have a good idea of what to test, you need to decide how to test it. Different testing types are designed to uncover different kinds of problems, and using a mix is key to a complete picture of your application’s health.
- Load Testing: This is your baseline. You simulate the expected number of users to see if your application can handle a normal day’s traffic. It’s a gentle but essential check on system stability. For an in-depth look, our guide on what load testing software is can provide more context.
- Stress Testing: This is where you push your application past its limits. The goal isn’t just to see if it breaks, but how it breaks. Does it slow down gracefully, or does it crash and burn? This is how you find your true breaking points before a sudden traffic spike does.
- Spike Testing: This simulates a sudden, massive increase in users, like during a flash sale or a viral marketing campaign. It tests your app’s ability to scale resources quickly and recover after the surge.
Modeling Realistic Behavior
To make these tests truly mirror reality, you must introduce variability. Don’t just script a single path; model a variety of user profiles. For instance, a “browser” might just look at a few pages and leave, while a “power user” performs complex actions. A simple but powerful technique is to incorporate “think time”—randomized pauses between actions to simulate a user reading or deciding what to do next.
A great way to achieve this is with a tool like GoReplay, which captures real production traffic. By replaying actual user sessions, you automatically get the varied interaction patterns, edge cases, and unpredictable behavior that scripted tests often miss. This method ensures your performance testing is grounded in the reality of how people truly use your product.
Making Performance Testing Part of Your Daily Workflow

Treating performance testing as a last-minute check before a big launch is a bit like cramming for an exam the night before. You might scrape by, but you haven’t really absorbed the material. To build applications that are consistently fast and dependable, performance testing needs to become a daily habit, as normal as running your unit tests. The idea is to weave it so deeply into your development process that it becomes an automated, almost unnoticeable part of every code check-in. This is what people mean when they talk about a “shift-left” approach, and it’s far more than just a buzzword.
Automating Performance in Your CI/CD Pipeline
The most practical way to make performance checks a routine is by automating them right inside your Continuous Integration/Continuous Deployment (CI/CD) pipeline. When you do this, you can spot performance regressions the moment they happen, not weeks down the line when they’ve become a much bigger problem. This isn’t just a good idea; it’s a major industry shift. Investment in test automation tools has jumped by nearly 30% in the last year, with about 70% of development teams now plugging automated tests into their CI/CD workflows. This change has led to a 35% boost in finding defects compared to manual testing. You can find more stats on the growth of test automation and its real-world effects.
For instance, you could set up a CI job that triggers a quick performance test every time a developer merges a pull request. This doesn’t have to be a massive, hours-long stress test. A short, focused test using a tool like GoReplay to replay a small sample of production traffic can instantly tell you if a recent change slowed down a critical API.
Setting Meaningful Performance Budgets
Automation gets you halfway there, but you also need to define what “good enough” looks like. This is where performance budgets are essential. A performance budget is simply a set of hard limits for key metrics that your application is not allowed to cross. Think of it like a financial budget, but for speed and efficiency.
You might define budgets like these:
- Time-based metrics: First Contentful Paint (FCP) must stay under 1.8 seconds.
- Quantity-based metrics: The total page size can’t go over 500 KB.
- Rule-based metrics: The page should make fewer than 50 HTTP requests.
When your CI/CD pipeline runs its automated performance test, it compares the results against these budgets. If a new build breaks the budget, the pipeline can be set to fail, stopping slow code from ever getting to production. This provides immediate, clear feedback to developers: “Your change made the login API 50ms slower, which violates our performance budget.” That kind of specific feedback allows them to fix the problem right away.
Turning Test Results Into Actionable Performance Insights
So, you’ve just wrapped up a performance test, and now you’re staring at a dashboard packed with raw metrics. Numbers like average response time and requests per second are just the ingredients; they don’t become a meal until you understand how to put them together. The real skill is learning to read between the lines of your test results to find the patterns that point to genuine problems.
A single metric in isolation rarely tells the whole story. The magic happens when you start correlating them to build a complete picture of what’s happening inside your application under load. For instance, a high error rate is alarming, but what does it actually mean?
When you pair that error rate with CPU utilization, you might discover the errors only start cropping up after the CPU hits 90%. Now you have a solid lead: your server is running out of processing power. Or perhaps the CPU is fine, but you notice that memory usage climbs steadily throughout the test and never drops back down. This is a classic signature of a memory leak, where your application is holding onto memory it no longer needs.
Pinpointing Common Bottlenecks
Most performance issues leave specific fingerprints in your test data. Learning to recognize these signatures is key to a fast diagnosis. Instead of just looking at surface-level symptoms, you can dig deeper for the root cause. This approach is fundamental to improving your system’s stability. If you want to dive deeper, you can learn more by checking out our guide on boosting application performance through load testing.
To help you get started, here’s a quick reference table that connects common symptoms with their likely causes and the data patterns to look for.
Performance Metrics Quick Reference Guide
Key performance metrics, their meanings, and acceptable thresholds for web applications
| Metric | Description | Good Threshold | Warning Signs |
|---|---|---|---|
| Response Time | The time it takes for a server to respond to a request. | Under 200ms for API calls, under 1s for page loads. | Consistently high times or a gradual increase as load increases. |
| Error Rate | The percentage of requests that result in an error (e.g., HTTP 5xx). | Below 0.1%. | Any rate above 1% is a major red flag that needs immediate investigation. |
| CPU Utilization | The percentage of the CPU’s processing power being used. | Below 75% on average. | Sustained spikes above 90%, indicating the server is overloaded. |
| Memory Usage | The amount of RAM your application is consuming. | Stable usage that plateaus under load. | A steady, unending climb that never drops, suggesting a memory leak. |
This table provides a great starting point for interpreting your results. By looking for these patterns, you can move from vague complaints to specific, actionable insights.
This kind of analysis transforms a generic “the app is slow” complaint into a concrete task like, “Increase the database connection pool from 10 to 25 and re-run the test.” This is how you test application performance effectively—by turning data into clear, targeted actions that lead to real improvements.
Building Performance Testing Practices That Last
Even the most brilliant strategy to test application performance is useless if it gathers dust after a few months. The goal isn’t just to test, but to build a testing culture that sticks around. Sustainable practices grow with your team and product, becoming a natural part of your workflow instead of a chore to be skipped when deadlines loom. This means moving away from performance being “QA’s problem” and making it everyone’s responsibility.
Documenting for the Future
The secret to longevity is clear, accessible documentation. When a new developer joins your team, they shouldn’t have to spend a week trying to figure out how your performance tests work. Your documentation should be a living guide, not a static file that gets forgotten.
Here’s what I’ve found works best:
- Create a “Getting Started” Guide: A simple, one-page document explaining how to set up the testing environment, run a basic test, and where to find the results. Make it foolproof.
- Record Your Scenarios: Clearly describe your critical user journeys and why they were chosen. Explain what each test scenario (load, stress, spike) is designed to achieve and what you’re trying to learn.
- Define Your Metrics: List your key performance indicators (KPIs) and performance budgets. Explain what “good” looks like for your application and what metrics should trigger an alert.
Keeping It Cost-Effective and Proving Its Worth
Sustainability also means being smart with your resources. You don’t need a massive, expensive replica of production to get meaningful results. Using tools like GoReplay allows you to capture real-world traffic patterns without maintaining a complex infrastructure for scripting user behavior. This approach delivers maximum insight for minimal overhead.
To justify the ongoing effort, you have to measure your return on investment (ROI). Connect your testing efforts directly to business outcomes. For example, show how automated tests caught a performance regression that would have resulted in an estimated $10,000 in lost sales during a promotion.
By framing performance in terms of business impact—fewer support tickets, higher conversion rates, and improved customer retention—you ensure it remains a priority for everyone, not just the engineering team.