Ensuring Software Resilience: A Deep Dive Into Stress Testing Tools
In today’s fast-paced world, software downtime can lead to significant financial losses and damage a company’s reputation. Having reliable and resilient software isn’t a luxury anymore—it’s essential. Stress testing, which involves pushing your applications to their limits under simulated extreme load conditions, helps identify weaknesses and ensures your systems can handle unexpected traffic spikes and peak usage. However, with so many stress testing tools available, choosing the right one can feel overwhelming.
This article explores the top 10 stress testing software tools available in 2025, helping you evaluate and select the perfect fit for your team. These tools provide solutions to various performance testing challenges, from simulating large numbers of concurrent users to pinpointing bottlenecks and optimizing resource allocation.
Choosing the Right Stress Testing Tool
Choosing the right stress testing tool depends on several factors: your budget, technical expertise, the complexity of your application, and specific performance goals. A good stress testing tool offers comprehensive reporting, realistic load simulation, and integration with popular development tools like Jenkins. Pricing ranges from free, open-source options to enterprise-level platforms with premium features and dedicated support. Technical considerations include supported protocols, scripting languages, and how well the tool scales.
By the end of this article, you’ll understand the strengths and weaknesses of each leading stress testing tool, allowing you to make an informed decision and strengthen your software’s performance. This will ensure a smooth user experience even under high-demand situations. We’ll cover a wide range of options, offering valuable insights for software developers, QA engineers, DevOps professionals, IT teams, and business leaders.
1. GoReplay
GoReplay is a powerful tool for stress testing your applications. Unlike synthetic tests, GoReplay uses real-world traffic to uncover performance bottlenecks. It captures live HTTP traffic from your production environment and replays it against your testing environments. This helps identify issues before they affect users, making GoReplay valuable for DevOps, QA, and development teams.
GoReplay acts as a proxy between your production and staging environments. It intercepts and records live requests, then replays them against your target environment. This replicates real user sessions, including complex interactions that traditional testing might miss.
Key Features and Benefits
-
Real-World Traffic Replication: GoReplay uses actual production traffic for testing, ensuring accurate and reliable results.
-
Session-Aware Replay: GoReplay maintains session context, which is crucial for testing applications that rely on session data.
-
Smart Connection Pooling and TLS Optimization: GoReplay optimizes connections and TLS encryption to improve performance during testing.
-
Real-time Monitoring and Advanced Analytics: A built-in dashboard provides insights into system performance under stress.
-
Flexible Deployment: A free and open-source version is available, alongside GoReplay Pro, which offers advanced features for enterprise needs.
Pros and Cons
Pros:
- Uses actual production traffic for realistic testing.
- Offers session-aware replay, connection pooling, and TLS optimization.
- Provides real-time monitoring and analytics.
- Trusted by enterprise teams, boasting over 18k GitHub stars.
- Offers both free and Pro versions.
Cons:
- The command-line interface might be challenging for beginners.
- Advanced features are only available in the Pro version.
Pricing and Technical Requirements
GoReplay is open-source and free. GoReplay Pro pricing is available upon request. The tool is written in Go and can be compiled on Linux, macOS, and Windows.
Implementation Tips
- Start with a smaller subset of traffic.
- Use filtering to focus on specific endpoints.
- Closely monitor your target environment’s resources during tests.
Comparison with Similar Tools
While tools like JMeter and Gatling offer load testing, GoReplay’s use of real production traffic provides a more practical approach to stress testing.
Getting Started with GoReplay
GoReplay helps optimize your application for real-world use. Its ability to capture and replay live traffic offers realistic stress testing, making it a valuable tool for delivering high-performing and reliable applications. Visit the official GoReplay website to learn more.
2. Apache JMeter
Apache JMeter is a powerful open-source load testing tool developed by the Apache Software Foundation. It’s a versatile solution for testing the functional behavior and measuring the performance of web applications, databases, and other services. JMeter simulates heavy loads on your target system, allowing you to test its strength and analyze overall performance under various load types.
This makes it invaluable for ensuring the resilience and scalability of applications. Whether it’s servers, networks, or specific objects, JMeter helps you understand how your systems perform under pressure.
JMeter’s strength lies in its ability to simulate diverse scenarios. From testing a web application’s response to a sudden traffic spike, to assessing database performance under sustained high load, JMeter provides the necessary tools. Its multi-protocol support, including HTTP, HTTPS, JDBC, LDAP, SOAP, JMS, and FTP, broadens its applicability.
Key Features and Benefits
-
Multi-protocol testing support: JMeter handles a wide range of protocols, making it suitable for testing various application components.
-
Highly extensible through plugins: An ecosystem of plugins extends JMeter’s core functions, allowing customization for specific testing needs.
-
Scriptable samplers: Advanced scripting for complex test scenarios and custom logic is possible via JSR223-compatible languages like Groovy.
-
Result analysis and visualization: JMeter provides reports and visualizations for understanding and interpreting test results.
-
Distributed testing: For large-scale tests, distribute load generation across multiple machines, simulating massive user loads.
Pros and Cons of Using JMeter
Pros:
-
Free and open source: No licensing costs.
-
Community support and documentation: Benefit from a large community and extensive documentation.
-
Customizable through plugins: Tailor JMeter to specific needs.
-
Cross-platform compatibility: Run JMeter on any platform with a Java Virtual Machine.
Cons:
-
Learning curve: Mastering JMeter can require time and effort.
-
Resource-intensive: Simulating very high loads can demand significant hardware resources.
-
GUI limitations: The interface can slow down with complex test plans.
-
Basic reporting: Advanced reporting often requires plugins.
Getting Started with JMeter
Pricing: Free
Technical Requirements: Java Runtime Environment (JRE) or Java Development Kit (JDK)
Implementation Tip: Begin with a simple test plan and gradually increase complexity. Explore plugins to enhance testing. For larger tests, consider distributed testing. Check out this resource on stress testing: Ensuring Your Application’s Resilience with Stress Testing in Software Testing.
Website: https://jmeter.apache.org/
JMeter’s features, open-source nature, and community support make it a valuable tool for performance and load testing. While it has a learning curve, its flexibility and extensibility make it a powerful and cost-effective choice for ensuring application robustness.
3. LoadRunner Professional
Micro Focus LoadRunner Professional is an industry-leading performance testing solution for enterprises. It’s designed to rigorously test complex applications, simulating large numbers of users to identify performance bottlenecks. This helps organizations maintain application stability and ensure a seamless user experience, even under pressure.
LoadRunner Professional excels at simulating real-world user behavior. Think about launching a new e-commerce site or updating banking software. LoadRunner can emulate thousands of users simultaneously performing various tasks, such as browsing products, adding items to carts, or completing transactions. This process reveals how your application performs under stress and pinpoints breaking points, enabling proactive performance optimization.
Key Features and Capabilities
Several key features contribute to LoadRunner Professional’s robust performance testing capabilities:
-
Extensive Protocol Support: Supports 50+ protocols and technologies, including web, mobile, SAP, Citrix, Java, and .NET, allowing for comprehensive testing across various application environments.
-
Advanced Analytics & Monitoring: Offers detailed performance metrics and real-time monitoring dashboards to visualize system behavior under load, making it easier to quickly identify bottlenecks.
-
Correlation Engine: Manages dynamic values in application communication, ensuring accurate and realistic simulations.
-
Network Virtualization: Simulates varying network conditions, like latency and bandwidth limitations, to test application performance in diverse real-world scenarios.
-
CI/CD Integration: Integrates smoothly with CI/CD pipelines, allowing for automated performance testing within the development workflow.
Practical Applications of LoadRunner Professional
LoadRunner Professional has several practical uses, such as:
-
Capacity Planning: Helps determine the necessary hardware and software resources to accommodate anticipated user loads.
-
Performance Bottleneck Identification: Isolates specific code, database queries, or network problems affecting performance.
-
Performance Tuning: Assesses the impact of code adjustments and infrastructure enhancements on application performance.
-
Regression Testing: Ensures that new releases and updates do not introduce performance regressions.
Pros and Cons
Pros:
- Enterprise-Grade Performance and Scalability: Handles very high user loads, making it suitable for large-scale applications.
- Advanced Analysis and Reporting: Provides detailed performance insights to support informed decisions.
- Extensive Protocol Support: Covers a wide array of application technologies.
- Excellent Technical Support: Backed by strong vendor support from Micro Focus.
Cons:
- High Licensing Costs: Represents a significant investment, especially for smaller organizations.
- Resource-Intensive Setup: Requires dedicated hardware and expertise for initial deployment.
- Steep Learning Curve: Mastering all the features and functionality requires time and training.
- Hardware Demands: Running large-scale tests requires powerful hardware.
Pricing and Technical Requirements
Pricing: Contact Micro Focus directly for pricing details, as it is based on virtual user days (VUDs) and specific features.
Technical Requirements: System requirements vary based on the scale and complexity of the tests. Refer to the official documentation for hardware and software prerequisites.
Implementation Tip
Begin with smaller tests to become familiar with the tool before gradually increasing the load. Utilize the available documentation and support resources from Micro Focus.
Comparison with Alternatives
While open-source options like JMeter offer cost-effective solutions, LoadRunner Professional provides advanced features, broader protocol support, and enterprise-grade scalability. If your application demands robust, large-scale performance testing, and budget is not a primary concern, LoadRunner Professional is a compelling choice.
Website: https://www.microfocus.com/en-us/products/loadrunner-professional/overview
4. k6
k6 is a modern load testing tool built with developers in mind. It’s designed for easy integration into development workflows, making it a perfect fit for teams using continuous integration and delivery (CI/CD) pipelines. Built with Go and using JavaScript for scripting, k6 lets developers thoroughly test the performance of APIs, microservices, and websites under various load conditions.
One of k6’s key strengths is its JavaScript-based scripting. This allows developers to use their existing JavaScript skills to build realistic and complex load test scenarios. Its HTTP/2 support and browser-like capabilities help simulate real user behavior, providing accurate performance insights. The command-line interface (CLI) focus makes it simple to integrate into CI/CD pipelines, automating performance testing as part of the development lifecycle. Checks and thresholds within the scripts automate performance validation and help identify performance regressions quickly.
k6 stands out thanks to its developer-friendly approach, efficiency, and modern design. Unlike older tools with steep learning curves, k6’s code-based approach fits seamlessly with modern developer workflows. It also boasts efficient resource use, allowing developers to run large load tests with less overhead than other tools. This efficiency leads to faster test execution and lower infrastructure costs.
Features
- JavaScript-based scripting for adaptable test creation
- HTTP/2 support and browser-like actions for realistic simulations
- CLI-focused design for streamlined CI/CD integration
- Checks and thresholds for automated performance evaluation
- A cloud service for distributed load testing (paid feature)
Pros
- Developer-friendly with its code-based approach to testing
- Lower resource consumption compared to other load testing tools
- Excellent CI/CD integration
- Strong documentation and a growing community
Cons
- Supports fewer protocols than some older, more established tools
- Distributed testing requires a paid subscription to the k6 Cloud service
- A less extensive user interface (UI) compared to some traditional tools, although the CLI is powerful and effective.
- Being relatively new, it has a smaller (but expanding) ecosystem.
Pricing
k6 has a robust free and open-source version. For distributed testing and more advanced features, k6 Cloud offers a paid subscription.
Technical Requirements
k6 is compatible with Linux, macOS, and Windows. It requires a Go environment to build from source, but pre-built binaries are available for easier installation.
Comparison
Tools like JMeter and Gatling offer wider protocol support and more extensive UIs. However, k6 excels in developer experience, CI/CD integration, and resource efficiency. Its modern architecture makes it ideal for testing current web architectures and APIs. You might find this helpful: Our guide on Application Stress Testing.
Implementation Tips
- Define your performance goals and the metrics you want to track.
- Use k6’s modular scripting to create reusable test components.
- Integrate k6 into your CI/CD pipeline to automate performance testing.
- Consider the k6 cloud service for distributed load testing and advanced analytics.
Website
5. Gatling
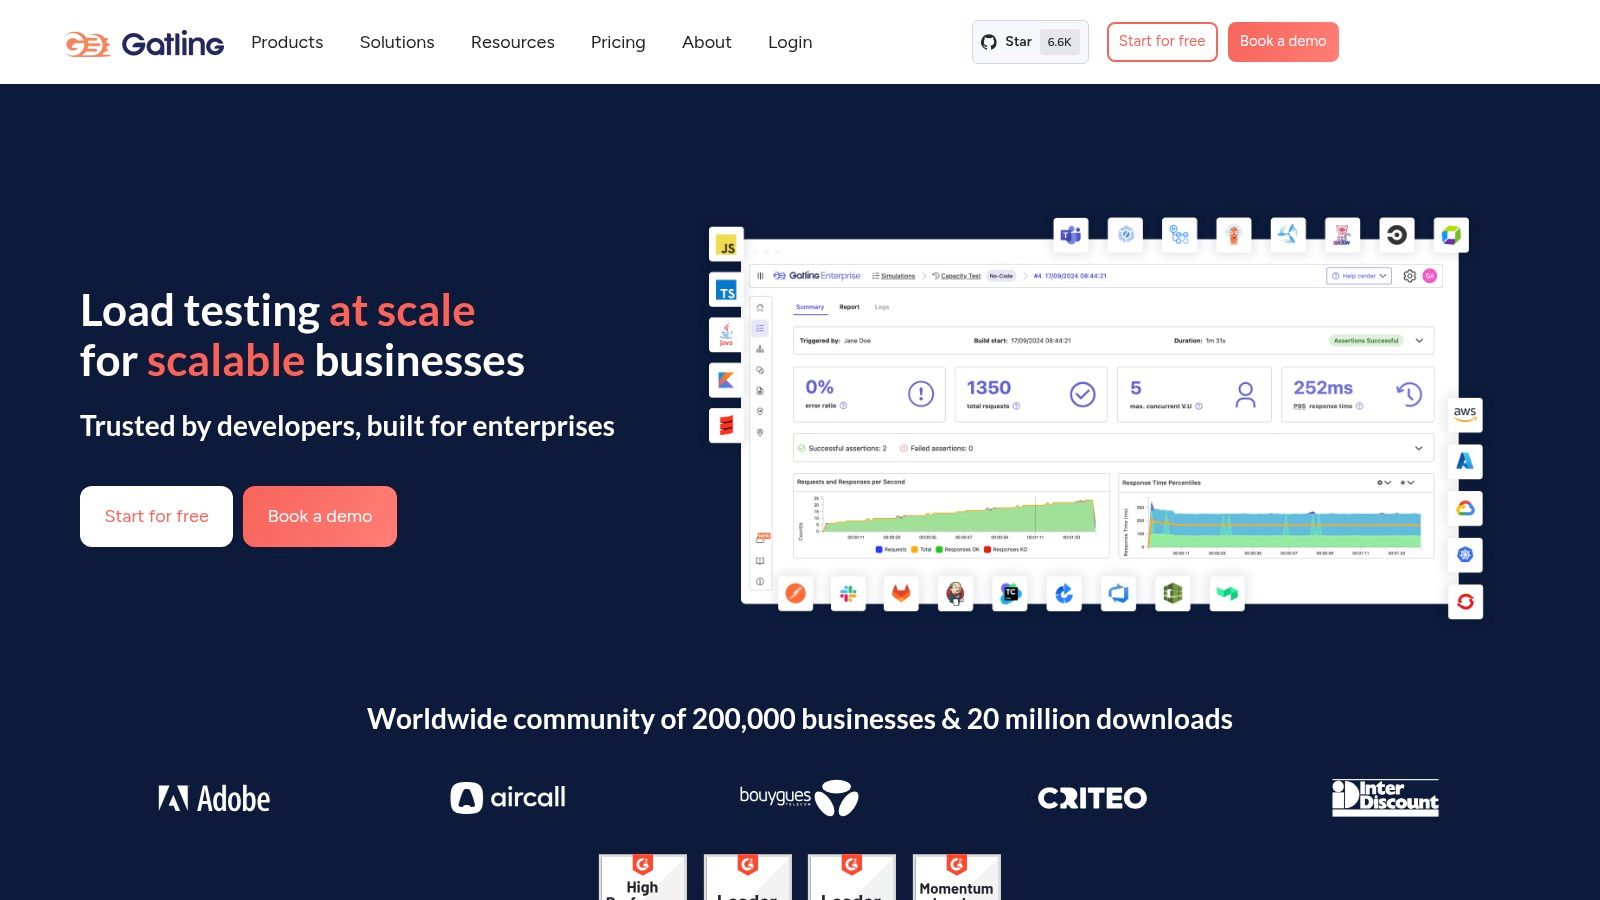
Gatling is a powerful open-source load and performance testing tool. It’s specifically designed for web applications, APIs, and microservices. Built on Scala, Akka, and Netty, its asynchronous, non-blocking architecture allows for simulating massive user loads with minimal resource consumption. This makes it a compelling choice for teams focused on performance and scalability. Gatling’s elegant DSL, comprehensive reporting, and focus on continuous integration make it a top contender in the performance testing space.
Use Cases and Practical Applications:
-
Continuous Load Testing: Integrate Gatling into your CI/CD pipeline to identify performance bottlenecks early. This proactive approach helps maintain optimal application performance with each new release.
-
API Testing: Gatling excels at testing APIs and microservices because of its focus on asynchronous communication and efficient resource use. Simulate complex API interactions and identify performance limitations under heavy load.
-
Capacity Planning: Use Gatling to determine the breaking point of your application. This helps predict infrastructure needs and ensures your system can handle traffic spikes.
-
Web Application Performance Testing: Thoroughly test your web application’s performance under realistic user loads. Identify slow response times, bottlenecks, and areas for optimization.
Features and Benefits
Gatling’s key features contribute to its efficiency and user-friendliness (once you’ve grasped the Scala DSL).
-
Expressive DSL: The Scala-based DSL, while potentially presenting a learning curve, provides a concise and readable way to define even complex test scenarios. This ensures tests are maintainable and adaptable.
-
Asynchronous Non-Blocking Architecture: Gatling’s message-driven architecture, unlike thread-based tools, allows it to simulate thousands of concurrent users per machine without performance degradation.
-
Detailed HTML Reports: Gatling generates visually rich HTML reports. These reports give in-depth metrics, response time distributions, and other crucial performance indicators, helping pinpoint bottlenecks.
-
Protocol Support: Supports HTTP/HTTPS, WebSocket, JMS, and JDBC, covering many communication protocols used in modern applications.
Pros and Cons
Here’s a quick breakdown of Gatling’s strengths and weaknesses:
Pros:
- Excellent Performance and Resource Utilization: Simulate large user loads with minimal hardware.
- Beautiful and Detailed Reporting: Gain valuable performance insights with comprehensive reports.
- Highly Scalable Architecture: Easily scale tests for complex applications.
- Ideal for API and Microservices Testing: Efficiently test asynchronous communication.
Cons:
- Scala-based DSL Learning Curve: The Scala DSL can be challenging for newcomers.
- Limited Protocol Support: Offers less protocol support compared to tools like JMeter.
- Smaller Community: Gatling’s community, while growing, is smaller than JMeter’s.
- Limited IDE Support: IDE integration could be more robust.
Pricing and Technical Requirements
Gatling is open-source and free under the Apache 2.0 license. Gatling Enterprise offers additional features like real-time monitoring and advanced analytics, with pricing available upon request. Gatling requires Java 8 or later. Installation is usually done through package managers or by downloading the distribution from the Gatling website.
Comparison with Similar Tools and Implementation Tips
Compared to JMeter, Gatling offers superior performance and more modern reporting. While JMeter has a larger community and broader protocol support, Gatling’s architecture and DSL make it a strong option for performance-focused teams. Here are a few tips for getting started:
- Review the Gatling documentation and examples to learn the DSL.
- Use the Recorder to create test scripts from your browser interactions.
- Integrate Gatling into your CI/CD pipeline for continuous performance testing.
Website: https://gatling.io/
6. BlazeMeter
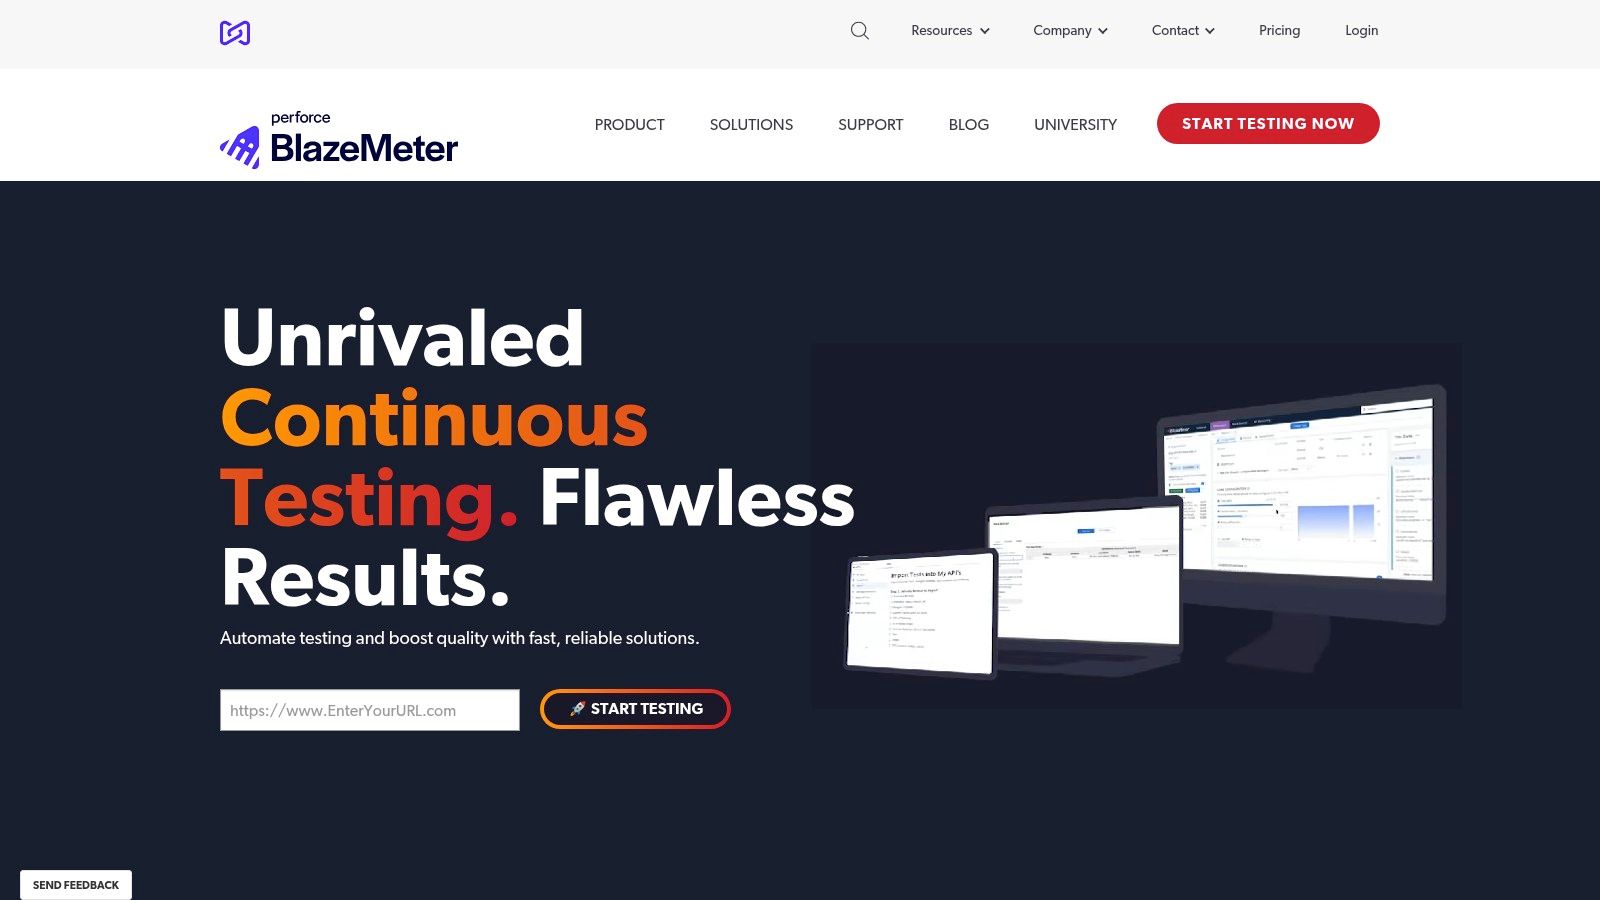
BlazeMeter is a powerful, cloud-based load testing platform perfect for simulating massive user traffic. Now part of Broadcom, it helps DevOps teams integrate performance testing earlier in the software development lifecycle. Its compatibility with popular open-source tools like JMeter, Gatling, and Selenium offers a familiar environment while adding enterprise-grade features and scalability.
Practical Applications and Use Cases:
-
Testing Website Performance Under Heavy Traffic: Simulate thousands of concurrent users to identify bottlenecks. This ensures your website can handle peak loads, like during a marketing campaign or product launch.
-
Mobile App Performance Testing: Determine how your mobile app performs under pressure. Analyze response times and identify potential crashes or slowdowns.
-
API Load Testing: Validate the performance and stability of your APIs under various loads. This ensures they can handle demands from your applications and integrations.
-
Continuous Integration/Continuous Delivery (CI/CD) Integration: Automate performance testing within your CI/CD pipeline to catch performance issues early and ensure quality.
Key Features and Benefits
-
Open-Source Tool Compatibility: Use your existing JMeter, Gatling, and Selenium scripts. This minimizes the learning curve and allows you to reuse test assets.
-
Geographic Distribution of Load Generators: Simulate realistic user traffic from different global locations for an accurate view of worldwide performance.
-
Real-Time Reporting and Analytics: Get immediate performance insights through dashboards and reports. Quickly pinpoint and address any issues that arise.
-
Collaborative Features: Improve teamwork with shared workspaces, test reports, and analysis tools.
-
API Testing Capabilities: Run comprehensive load tests on your APIs, making sure they can handle the expected traffic volume.
Pros and Cons
Pros:
-
Easy Scalability: Scale your tests effortlessly to simulate huge user loads without managing infrastructure.
-
User-Friendly Interface: An intuitive interface simplifies complex testing, making it accessible to both beginners and experienced testers.
-
Excellent Open-Source Integration: Seamlessly integrate with existing open-source tools for a streamlined workflow.
-
Comprehensive Reporting: Gain valuable insights with detailed reports and analytical data.
Cons:
-
Cost: While BlazeMeter has free and limited paid options, large-scale testing can be pricey.
-
JMeter Limitations: Converting very complex JMeter tests can sometimes be challenging.
-
Cloud Dependency: Requires a stable internet connection and relies on cloud platform availability.
-
Limited Offline Capabilities: Offline testing features are restricted.
Pricing, Technical Requirements, and Implementation Tips
Pricing: BlazeMeter offers different pricing plans, from a free tier to enterprise plans with custom pricing based on usage. See their website for current pricing.
Technical Requirements: You need a stable internet connection to use BlazeMeter. Script requirements depend on the testing tool (JMeter, Gatling, etc.).
Implementation/Setup Tips:
- Begin with a small test to get comfortable with the platform and verify your scripts.
- Use BlazeMeter’s documentation and support resources.
- Consider the Taurus framework to simplify test configuration and execution, particularly when using multiple open-source tools.
Comparison with Similar Tools
BlazeMeter competes with tools like LoadRunner, NeoLoad, and k6. While all have strengths, BlazeMeter stands out with its cloud platform, open-source compatibility, and user-friendliness.
Website: https://www.blazemeter.com/
7. Locust
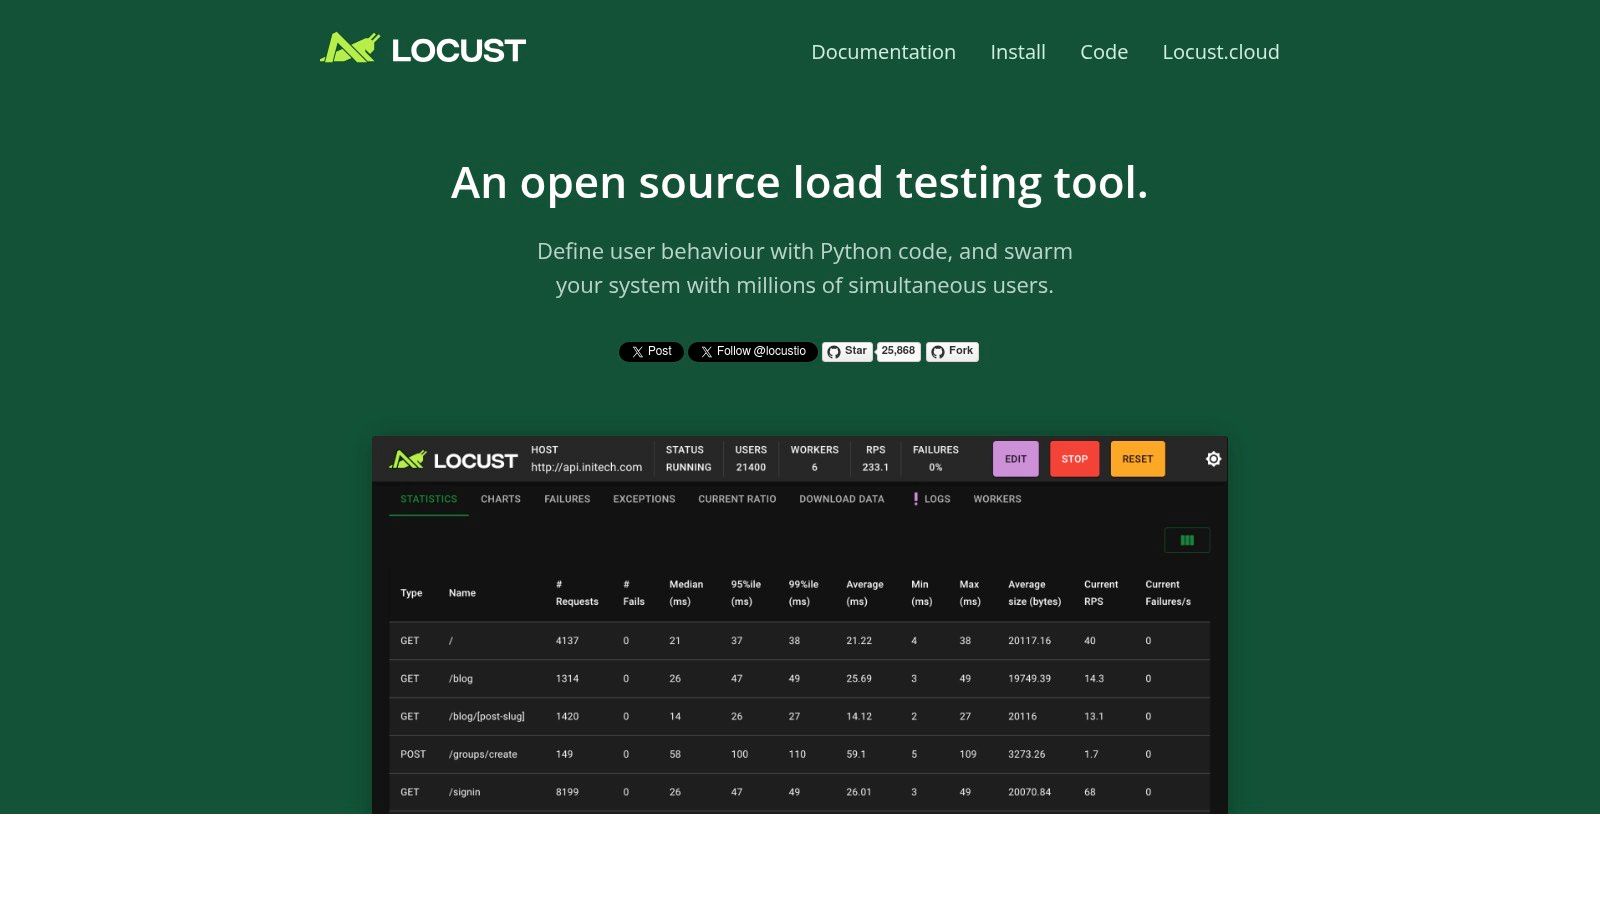
Locust is a powerful load testing tool that takes a developer-friendly approach. It provides an accessible way to simulate massive user traffic, giving you a clear picture of how your application performs under pressure. Unlike tools with rigid interfaces, Locust offers the flexibility of Python scripting, allowing for highly customized and complex test scenarios.
This makes it ideal for testing a wide range of applications, from APIs and microservices to websites and web apps. Built with ease of use and scalability in mind, Locust lets you define user behavior using Python code. This provides immense flexibility for creating complex testing scenarios.
Instead of relying on clunky UIs or restrictive DSLs, you write straightforward Python code to define how users interact with your system. This allows for the simulation of virtually any user behavior, from simple browsing to complex multi-step processes.
Locust’s distributed load generation capability lets you simulate massive user loads by distributing the test across multiple machines. This offers a realistic picture of your system’s performance under stress. The real-time web UI provides invaluable insights into the system’s behavior during the test, including response times, requests per second, and the number of active users.
Practical Applications and Use Cases
-
Testing API Endpoints: Simulate thousands of concurrent API calls to identify bottlenecks and performance limitations.
-
Stress Testing Web Applications: See how your website performs under heavy traffic, such as during a marketing campaign or flash sale.
-
Capacity Planning: Understand the limits of your infrastructure and plan for future growth.
-
Testing Game Servers: Simulate thousands of players interacting concurrently to identify performance issues in real-time.
-
Testing IoT Platforms: Assess the scalability and responsiveness of IoT systems by simulating numerous connected devices.
Features
- Python-based test scripting
- Distributed load generation
- Real-time web UI
- Event-driven architecture
- Extensible through plugins and custom code
Pros
- Developer-friendly with Python scripting
- Lightweight and easy to set up
- Excellent for custom protocols and complex behaviors
- Good documentation and active development
Cons
- Less suitable for non-technical users
- Fewer pre-built components than some commercial alternatives, like JMeter
- Limited reporting capabilities without customization
- Distributed setup requires more effort than some enterprise solutions
Pricing
Free and open-source.
Technical Requirements
Python 3.7 or higher.
Implementation/Setup Tips
- Install Locust using
pip:pip install locust - Write your load test script in Python, defining user behavior.
- Run Locust using the command
locust. - Access the web UI to start and monitor your test.
Comparison With Similar Tools
While tools like JMeter offer a wider range of pre-built components and reporting features, Locust’s strength lies in its flexibility and developer-friendliness. If you need highly customized load tests and prefer working with code, Locust is a great choice. JMeter may be more suitable for non-programmers or situations requiring standardized testing procedures. k6 is another comparable tool offering scripting in JavaScript and excellent performance, making it a solid option for those comfortable with the JavaScript ecosystem.
Website
Locust provides a powerful and flexible way to perform load testing. Its Python-based scripting allows for highly customized tests, tailored to specific application requirements. While there’s a learning curve for non-programmers, the benefit of code-driven flexibility makes Locust a valuable tool for developers and QA engineers seeking granular control over their load testing.
8. LoadNinja
LoadNinja by SmartBear empowers teams to ensure their web applications can handle heavy traffic and perform well under pressure. Unlike traditional load testing tools that often involve complex scripting, LoadNinja uses real browsers at scale. This approach provides more accurate and realistic performance insights, making it a powerful tool for software developers, QA engineers, and DevOps professionals looking to streamline their load testing process.
This approach provides more accurate and realistic performance insights, making it a powerful tool for software developers, QA engineers, and DevOps professionals looking to streamline their load testing process.
Practical Applications and Use Cases
-
Testing E-Commerce Platforms During Peak Seasons: Simulate thousands of concurrent users browsing products, adding items to carts, and completing purchases. This ensures your website can handle high-traffic periods like Black Friday or holiday sales.
-
Validating the Performance of Web Applications After Updates: Quickly assess the impact of new features or code changes on application performance by running load tests before deployment. This proactive approach helps prevent performance regressions after updates.
-
Troubleshooting Performance Bottlenecks: Pinpoint specific areas of your application causing slowdowns under load. The VU Debugger allows real-time inspection of virtual user activity, enabling quick identification and resolution of performance issues.
-
Capacity Planning: Determine the infrastructure needed to support anticipated user loads. This informed approach helps avoid costly over-provisioning or performance degradation.
-
Testing Web APIs and Microservices: While primarily designed for browser-based testing, LoadNinja can also load test web APIs and microservices. This ensures their stability and responsiveness under various load conditions.
Features and Benefits
-
Scriptless Test Creation: Record user journeys directly in your browser and instantly create load tests without writing any code. This feature drastically reduces test creation time and makes load testing accessible to a wider range of users.
-
Real Browser Load Testing: Emulate real user behavior with thousands of virtual users using actual browsers. This provides significantly more accurate performance data compared to simulated browser environments.
-
VU Debugger: Debug performance issues in real-time by inspecting individual virtual user sessions and identifying bottlenecks. This tool provides valuable insights into the behavior of individual users under load.
-
Detailed Analytics and Reporting: Gain insights into key performance metrics such as response times, error rates, and resource utilization with built-in analytics and visualization tools.
-
Integration with SmartBear Tools: Seamlessly integrates with other SmartBear tools like Zephyr and TestComplete for a comprehensive testing ecosystem.
Pros
- No scripting required, making it accessible to a wider range of users.
- More realistic tests due to real browser rendering.
- Faster test creation compared to script-based approaches.
- Built-in analytics and reporting tools provide valuable performance insights.
Cons
- More expensive than open-source alternatives. Pricing is subscription-based and can be a significant investment for smaller teams.
- Less flexible than code-based testing tools. Advanced customization may require workarounds.
- Limited to browser-based testing scenarios. Not suitable for load testing non-browser applications.
- Relatively new compared to established tools, potentially resulting in a smaller community and fewer readily available resources.
Implementation and Setup Tips
- Start with a small number of virtual users and gradually increase the load. This helps identify bottlenecks as they emerge.
- Use the VU Debugger to troubleshoot performance issues and gain insights into user behavior under load.
- Leverage the built-in analytics and reporting tools to track key performance metrics and identify areas for improvement.
Comparison With Similar Tools
LoadNinja competes with tools like JMeter, Gatling, and k6. While these tools offer more flexibility and customization through scripting, LoadNinja’s scriptless approach and real browser testing provide advantages in terms of speed and realism. If your focus is browser-based load testing and ease of use, LoadNinja is a strong choice.
Website: https://smartbear.com/product/loadninja/
LoadNinja simplifies and accelerates the load testing process, allowing teams to identify performance bottlenecks and ensure their web applications can handle real-world traffic. Its scriptless approach and real browser testing make it a valuable tool for organizations focused on delivering high-performing web experiences.
9. NeoLoad
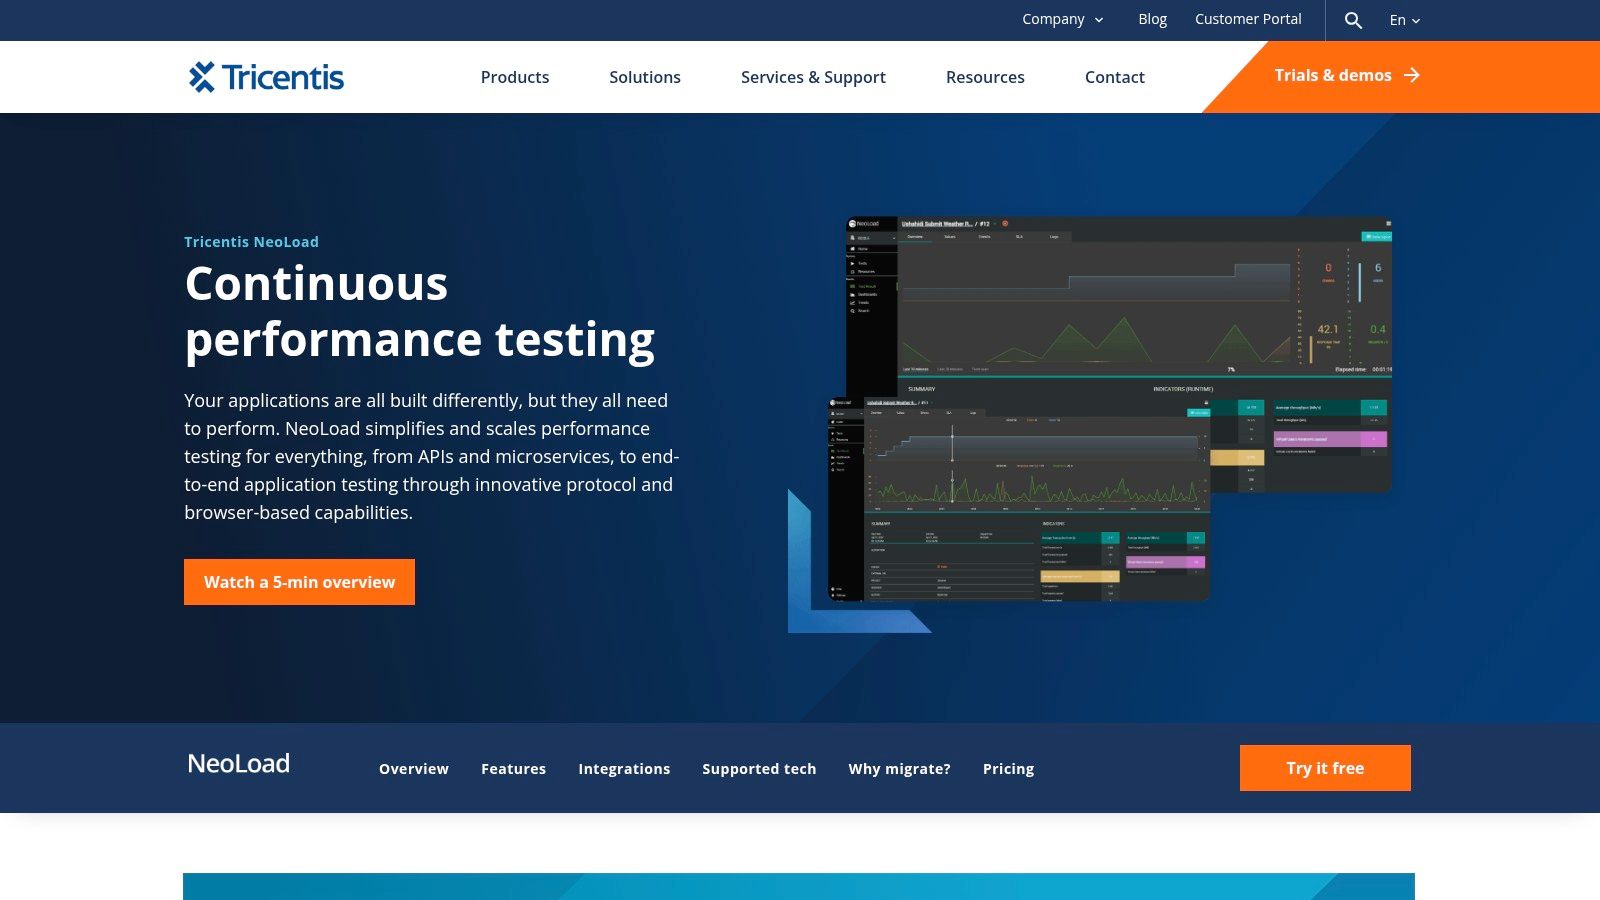
NeoLoad by Tricentis is a robust, enterprise-grade performance testing platform. It’s designed for the complexities of modern, distributed applications, ensuring your web, mobile, and API services can handle real-world user loads. While more expensive than open-source options, its features and focus on continuous integration make it a worthwhile investment for organizations that prioritize performance engineering.
NeoLoad simulates realistic user behavior, incorporating think times and bandwidth limitations to go beyond basic load generation. This accurately predicts application performance under various network conditions and user patterns. Its codeless design empowers both developers and QA engineers to create and maintain complex test scenarios without extensive scripting. This significantly reduces the time and effort required for performance testing, enabling faster feedback and quicker identification of performance bottlenecks.
Key Features and Benefits
- Codeless Test Design: Create sophisticated performance tests without deep coding knowledge.
- Automatic Correlation and Parameterization: Handles dynamic values and user sessions automatically.
- Realistic User Simulation: Simulates real-world user behavior with think times and bandwidth limitations.
- CI/CD Integration: Integrates with popular CI/CD tools like Jenkins and Bamboo.
- APM Integration: Integrates with Application Performance Monitoring (APM) solutions.
- Flexible Load Generation: Supports on-premises and cloud-based load generation.
Pros
- User-friendly interface with a relatively low learning curve.
- Excellent for testing complex enterprise applications.
- Strong correlation engine simplifies handling dynamic transactions.
- Robust integrations with CI/CD pipelines and monitoring tools.
Cons
- High licensing costs may be prohibitive for smaller organizations. Consider open-source alternatives like JMeter or Gatling if budget is a concern.
- Resource-intensive for large-scale tests, potentially requiring significant hardware.
- While largely codeless, some advanced features may require programming skills.
- Setting up distributed testing environments can be complex.
Implementation/Setup Tips
- Start with a smaller test environment to learn the platform.
- Leverage the codeless design initially, exploring scripting for advanced scenarios later.
- Ensure your load generators have sufficient resources.
- Carefully plan and configure your distributed testing environment.
Pricing
Contact Tricentis directly for pricing information.
Website
https://www.tricentis.com/products/performance-testing-neoload
NeoLoad is a powerful tool for organizations needing to ensure the performance and stability of complex applications. Its enterprise-grade features, realistic user simulation, and strong CI/CD integration make it valuable for any serious performance engineering effort. While the cost might be a barrier for some, the time saved through automation and the depth of insights provided can justify the investment for teams prioritizing robust performance testing.
10. Artillery
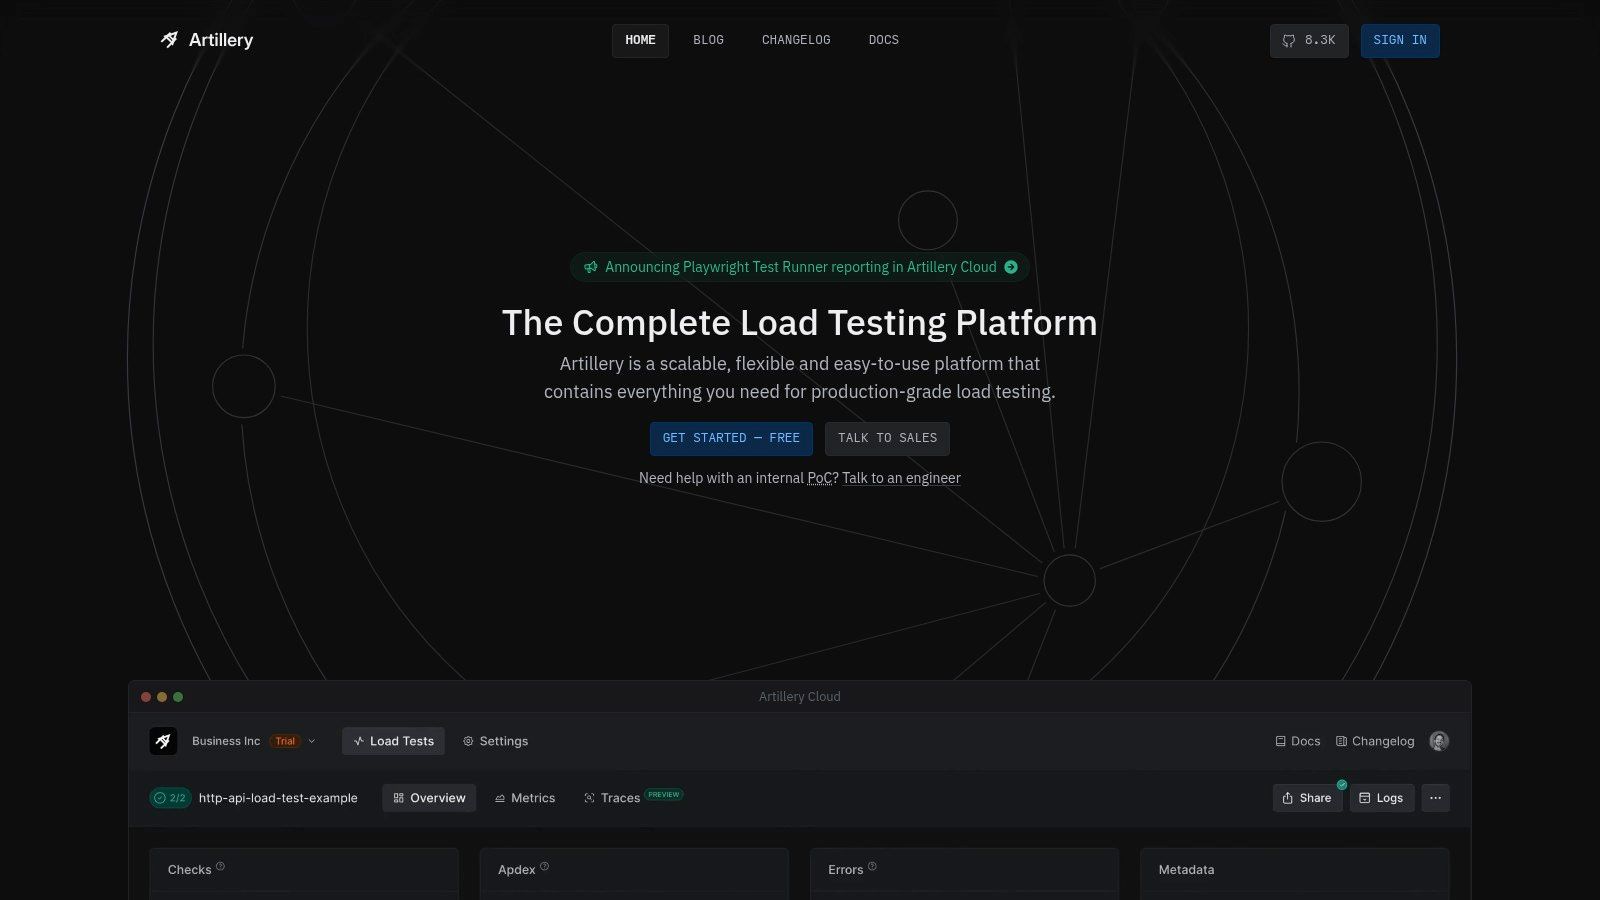
Artillery is a modern, developer-friendly performance testing tool. Unlike broader tools like JMeter, Artillery focuses on the needs of teams building APIs, microservices, and serverless functions. This makes it especially well-suited for cloud-native applications and Node.js backends.
Artillery uses a declarative YAML format to describe load testing scenarios. This approach enhances readability and simplifies maintenance. For added flexibility, you can integrate JavaScript for custom logic, dynamic data generation, and advanced scenario manipulation. This allows for highly realistic simulations of user behavior, from basic API calls to complex, multi-service user journeys.
Key Features and Benefits
- YAML-Based Scenario Definitions: Describe virtual users, behaviors, and expected responses in an easy-to-read YAML format.
- JavaScript Extensibility: Use JavaScript for custom logic, dynamic data handling, and creating sophisticated test scenarios.
- Support for Modern Protocols: Test APIs and services using HTTP, WebSocket, Socket.io, and Kinesis.
- Customizable Reporting: Generate reports in various formats to analyze key performance metrics and identify bottlenecks.
- Plugin Architecture: Extend Artillery’s functionality with community-developed or custom plugins.
- CI/CD Integration: Integrate load tests seamlessly into your CI/CD pipeline with platforms like Jenkins and CircleCI.
Practical Applications
- API Performance Testing: Identify the breaking point of your APIs under stress and optimize for peak performance.
- Microservices Load Testing: Test the resilience and scalability of your microservices architecture.
- Serverless Function Testing: Ensure your serverless functions handle traffic spikes and maintain low latency.
- Continuous Performance Testing: Integrate Artillery into your CI/CD pipeline for early detection of performance regressions.
Pros and Cons
Pros:
- Simple Configuration: YAML and JavaScript make test creation and maintenance straightforward.
- Strong Node.js Integration: A perfect fit for teams using Node.js.
- Lightweight and Efficient: Minimal resource consumption compared to other load testing tools.
- Ideal for API and Microservices Testing: Designed specifically for modern architecture.
Cons:
- Limited Protocol Support: Doesn’t have the broad protocol support of some tools like JMeter.
- Smaller Community: Fewer readily available plugins and community resources.
- Limited Built-in Reporting: You might need to integrate with other reporting tools for deeper analysis.
Implementation Tips
- Start Simple: Begin with a basic YAML configuration and gradually add complexity as needed.
- Leverage JavaScript: Use JavaScript for dynamic data generation and more complex scenarios.
- Automate with CI/CD: Integrate with your CI/CD pipeline to catch performance issues early.
Pricing and Availability
Artillery offers both open-source and commercial versions (Artillery Pro). Artillery Pro provides additional features, including distributed load testing, advanced analytics, and dedicated support. For detailed pricing, visit their website.
Website: https://artillery.io/
Artillery is a valuable tool for developers and QA engineers looking for a modern, efficient approach to load testing. Its developer-friendly design and focus on modern architectures make it a powerful asset for any performance testing strategy.
Top 10 Stress Test Tools: Performance & Features Comparison
| Tool | Key Features ✨ | User Experience ★ | Value Proposition 💰 | Target Audience 👥 |
|---|---|---|---|---|
| GoReplay 🏆 | Live HTTP capture, session-aware replay, TLS optimization, advanced analytics | Realistic simulation; steep CLI learning | Free open-source + Pro enterprise | Developers & enterprises |
| Apache JMeter | Multi-protocol support, extensible plugins, scriptable samplers | Powerful but requires a steep learning curve | Free and open-source | Test engineers & open-source communities |
| LoadRunner Professional | Extensive protocol support, correlation engine, CI/CD integration | Enterprise-grade; complex setup | Premium, high licensing cost | Large enterprises & performance teams |
| k6 | JavaScript-based scripting, CLI integration, HTTP/2 support | Developer-friendly; efficient | Affordable with cloud options | Developers & DevOps teams |
| Gatling | Scala DSL, non-blocking architecture, detailed HTML reports | Fast performance; DSL learning curve | Open-source with enterprise add-ons | Developers & API testers |
| BlazeMeter | Cloud-based testing, open-source tool compatibility, real-time analytics | User-friendly; highly scalable | Cloud pricing with higher scale costs | DevOps teams & enterprises |
| Locust | Python scripting, real-time web UI, distributed load generation | Simple setup; developer-centric | Free open-source | Python developers & technical teams |
| LoadNinja | Browser-based recording, live browser tests, VU debugger | Intuitive UI; no scripting required | Cloud-based premium pricing | Testers & non-developers |
| Neoload | Codeless design, automatic correlation, CI/CD integration | User-friendly; resource intensive | Expensive enterprise solution | Enterprise performance teams |
| Artillery | YAML scenario definitions, JavaScript extensions, plugin architecture | Lightweight; simple configuration | Affordable with open-source community | API/microservices testers & Node.js developers |
Choosing the Right Stress Test Software: Key Considerations
Selecting the right stress test software requires careful evaluation. With numerous options available, including GoReplay, Apache JMeter, LoadRunner Professional, k6, Gatling, BlazeMeter, Locust, LoadNinja, Neoload, and Artillery, finding the ideal tool can be challenging. The best choice depends on factors like project requirements, budget, technical expertise, and scalability needs.
When comparing these tools, consider the following key points:
-
Open Source vs. Commercial: Open-source tools like GoReplay, JMeter, and Locust are cost-effective and offer flexibility for customization, often with strong community support. Commercial tools like LoadRunner Professional and Neoload typically provide advanced features, dedicated support, and comprehensive reporting, but come with licensing fees.
-
Protocol Support: Ensure the tool supports the protocols your application uses, such as HTTP, HTTPS, WebSockets, or gRPC.
-
Scripting and Ease of Use: Consider the scripting language and the user interface. Some tools offer intuitive interfaces, while others require more coding experience.
-
Scalability and Performance: How well can the tool simulate a large number of concurrent users? What resources are needed to run it effectively?
-
Integration and Compatibility: Does the tool integrate with your existing CI/CD pipeline and other monitoring tools?
-
Reporting and Analysis: Robust reporting is vital for identifying performance bottlenecks and other issues.
Implementation and Getting Started
Most stress testing tools provide detailed documentation and tutorials. Start with a small-scale test to familiarize yourself with the tool’s functionality. A proof-of-concept can validate the tool’s suitability for your specific requirements before committing to larger, more complex test scenarios.
Budget and Resource Considerations
Open-source tools eliminate licensing costs, but may require internal resources for setup, maintenance, and scripting. Commercial tools offer convenience and support but come with recurring expenses. Also, factor in the infrastructure costs for generating the load, particularly for large-scale tests.
Integration and Compatibility
Seamless integration with your development workflow is crucial. Consider whether the tool integrates with your CI/CD pipeline, performance monitoring systems, and other relevant tools in your ecosystem.
Key Takeaways
- Select a tool that aligns with your specific testing needs and the technical expertise of your team.
- Evaluate both open-source and commercial options based on your budget and required features.
- Prioritize tools with robust reporting and analysis capabilities to gain actionable insights.
- Ensure seamless integration with your existing development workflow for efficient testing.
Ensure your application can handle real-world traffic with tools like GoReplay, which captures and replays live HTTP traffic, transforming real user behavior into a powerful testing resource. From load testing to real-time monitoring, GoReplay provides valuable insights for delivering high-performing and reliable software. Start testing with confidence and experience the power of real-world traffic replay with GoReplay.