Ensuring Software Stability Under Pressure: Exploring the Top Stress Testing Tools
In today’s demanding online environment, software performance is critical. Applications need to handle substantial user traffic and unforeseen spikes without crashing. Even a momentary failure can mean financial losses, reputational damage, and user frustration. This is where stress testing software becomes indispensable. These tools enable development, QA, and DevOps teams to proactively push their applications to their limits, identifying weaknesses and performance bottlenecks before they affect actual users.
Selecting the appropriate stress testing tool, however, can be challenging. Factors such as scalability, usability, reporting features, supported protocols, and integration with existing CI/CD pipelines are all crucial. A strong stress testing tool should offer realistic simulations of user activity, fine-tuned control over load generation, and comprehensive performance data for informed decision-making.
Further considerations include pricing, which can range from free open-source options to premium enterprise-grade solutions with advanced capabilities, and the technical skillset necessary to implement and effectively use the tool.
Top 10 Stress Testing Software Options of 2025
This article explores the top 10 stress testing software options available in 2025, offering a detailed overview of their advantages, disadvantages, and suitable applications. We’ll examine a variety of solutions, from free and open-source tools ideal for smaller ventures to powerful enterprise-level platforms developed for sophisticated, high-traffic systems.
Open-Source Options
-
JMeter: Apache JMeter is a widely-used open-source tool for load and performance testing. It supports various protocols and offers extensive customization options.
-
k6: k6 is a developer-centric, open-source load testing tool that integrates well with CI/CD pipelines. It uses JavaScript for scripting and offers detailed performance metrics.
-
Gatling: Gatling is another popular open-source performance testing tool known for its detailed reports and efficient resource utilization.
Commercial Solutions
-
LoadRunner Professional: Micro Focus LoadRunner Professional is a comprehensive performance engineering solution used for testing various application types.
-
NeoLoad: NeoLoad is a powerful performance testing platform designed for enterprise applications and complex test scenarios.
-
WebLOAD: WebLOAD is a robust load testing tool that offers a range of features for testing web applications.
Other Notable Tools
-
Locust: Locust is a Python-based, open-source load testing framework known for its distributed testing capabilities and user-friendly interface.
-
Taurus: Taurus provides a simple way to create and run performance tests using various open-source tools, including JMeter and Gatling.
-
BlazeMeter: BlazeMeter is a cloud-based performance testing platform offering continuous testing integration and extensive reporting capabilities.
-
Flood.io: Flood.io is a cloud-based platform designed for large-scale load testing with support for various testing tools.
By understanding the capabilities and limitations of these tools, you can select the optimal solution to ensure your software remains reliable and performs effectively, regardless of user demands.
1. GoReplay
GoReplay is a powerful open-source tool that enhances stress testing by using actual user traffic. Instead of generating synthetic load, GoReplay captures live HTTP traffic and replays it, accurately mimicking real-world usage patterns. This method is crucial for uncovering performance bottlenecks and vulnerabilities that might be missed by traditional testing. 
Practical Applications & Use Cases
-
Load Testing: Simulate peak traffic by replaying captured traffic at a higher rate. This helps determine system capacity and identify breaking points.
-
Capacity Planning: Model future growth using historical traffic data. Ensure your infrastructure can handle anticipated demand.
-
Performance Regression Testing: Integrate GoReplay into your CI/CD pipeline to automatically test new code deployments against real traffic, preventing performance regressions.
-
Troubleshooting and Debugging: Replay specific user sessions to reproduce and diagnose production issues.
-
Chaos Engineering: Introduce latency, errors, or other disruptions during replay to assess system resilience.
Features and Benefits
-
Session-Aware Replay: Preserves user session integrity, accurately reflecting user behavior and dependencies.
-
Connection Pooling and TLS Optimization: Manages connections and TLS handshakes efficiently for realistic large-scale simulations.
-
Advanced Analytics Dashboard: Offers real-time insights into metrics like response times, error rates, and throughput.
-
One-Command Setup: Simplifies implementation and reduces setup time for stress testing.
Pros
-
Real-World Realism: Employs actual user interactions for production-level stability testing.
-
Seamless Integration: Easily integrates into existing workflows and testing environments.
-
Deep Insights: Provides valuable analytics for identifying and resolving performance bottlenecks.
-
Strong Community & Industry Recognition: Supported by an active open-source community and used by many Fortune 500 companies.
Cons
-
Learning Curve: Mastering advanced features may require some initial effort.
-
Enterprise Pricing: While the community edition is free, some advanced features, such as traffic storage and data masking, require a paid enterprise license.
Pricing and Technical Requirements
GoReplay offers a free community edition with basic functions. Enterprise licensing, with pricing based on usage and requirements, is available for advanced features and support. Contact GoReplay for detailed pricing. Technical requirements are minimal, with binaries available for several operating systems.
Comparison With Similar Tools
While tools like JMeter and Gatling offer synthetic load testing, GoReplay distinguishes itself by using real user traffic, providing a more accurate and relevant stress test.
Implementation Tips
-
Capture a representative sample of your live traffic.
-
Use filtering options to focus on specific user flows or API endpoints.
-
Gradually increase the replay rate to pinpoint breaking points.
-
Monitor system resource usage during replay to find areas for optimization.
Website: https://goreplay.org
GoReplay is a valuable tool for any team prioritizing robust and reliable software. Its capacity to capture and replay real user traffic delivers high accuracy and ensures applications can handle real-world demands. The combination of its ease of use, powerful features, and community support makes it an effective stress testing solution.
2. Apache JMeter
Apache JMeter is a powerful open-source tool for stress testing. It’s designed to analyze the performance of web applications, APIs, and a wide variety of other services. While originally intended for web application testing, JMeter’s capabilities have expanded considerably.
JMeter simulates heavy loads on servers, networks, or specific objects. This helps test their resilience and analyze overall performance under different load types. The user-friendly GUI simplifies test configuration and offers detailed reporting. This makes it a valuable tool for anyone involved in performance testing.
JMeter earns its place on this list due to its versatility and extensibility. It handles a broad range of scenarios, from simulating thousands of concurrent users accessing a web application to testing the throughput of a database connection. Its support for various protocols, including HTTP, HTTPS, SOAP, REST, FTP, and JDBC, makes it adaptable to diverse testing needs.
Features and Benefits
- Cross-Platform Functionality (Java-Based): Run JMeter on nearly any operating system.
- Broad Protocol Support: Test a range of applications and services.
- Visual Reporting: Easily grasp performance metrics through clear graphs and charts.
- Distributed Testing: Scale your tests by distributing the load across multiple machines.
- Scriptable Samplers: Extend JMeter’s functionality using languages like JavaScript and Groovy for complex test scenarios.
Pros and Cons of Using JMeter
Let’s examine the advantages and disadvantages of incorporating JMeter into your testing strategy.
Pros:
- Free and Open-Source: No licensing costs, encouraging community contributions and continuous development.
- Large Active Community and Documentation: Access ample support and resources.
- Highly Extensible with Plugins: Tailor JMeter to your specific needs with a wide variety of plugins.
- Low Resource Requirements: Run comprehensive tests without overtaxing your infrastructure.
Cons:
- Limited Real Browser Simulation: JMeter doesn’t fully emulate browser behavior, potentially missing some client-side performance issues.
- GUI Can Become Slow: Managing extensive tests within the GUI can become cumbersome.
- Steeper Learning Curve: While basic usage is straightforward, advanced features require more effort.
- JavaScript Handling: Not as robust as dedicated browser tools, which may be more suitable for JavaScript-heavy applications.
Implementation and Setup Tips
- Start Simple: Begin with a basic test plan and gradually increase complexity.
- Recording Feature: Leverage the recording feature to capture user interactions and create realistic scenarios.
- Utilize Listeners: Gather performance metrics and analyze results effectively.
- Explore Plugins: Extend JMeter’s capabilities to match your specific needs.
You might be interested in: Our guide on API Stress Testing for a deeper dive into API testing.
Pricing and Technical Requirements
JMeter is open-source and free to use. It requires a Java Runtime Environment (JRE) installed on your system.
Website: https://jmeter.apache.org/
3. LoadRunner Professional
Micro Focus LoadRunner Professional is an industry-leading performance and stress testing solution for enterprise applications. While other tools offer attractive features, LoadRunner Professional distinguishes itself through its wide protocol support, strong analysis capabilities, and integration with other enterprise tools. It helps identify performance bottlenecks before deployment, preventing costly downtime and damage to your organization’s reputation.
This tool excels in complex scenarios, simulating thousands of concurrent users interacting with your application in diverse environments. Think of a critical e-commerce platform during a flash sale, or a new banking application under peak load. LoadRunner Professional emulates these real-world conditions, providing key insights into system behavior and identifying potential breaking points.
Practical Applications & Use Cases
- High-traffic web applications: Ensure the stability of e-commerce sites, online gaming platforms, and high-volume portals during peak loads.
- Enterprise resource planning (ERP) systems: Validate the performance of business processes such as order processing, inventory management, and financial reporting.
- Mobile applications: Test backend performance and responsiveness under varying network conditions and user loads.
- API testing: Evaluate API performance and scalability under heavy load.
- Database performance testing: Identify database bottlenecks and optimize query performance.
Key Features and Benefits
- Advanced Correlation and Parameterization: Realistically simulate user interactions by capturing and reusing dynamic values.
- Comprehensive Test Result Analysis: Detailed reports and visualizations pinpoint bottlenecks and areas for optimization.
- Support for Over 50 Protocols and Technologies: LoadRunner Professional covers a broad range of application environments, from web and mobile to legacy systems.
- Integrated Monitoring: Monitor server resources, network performance, and database activity during tests for a holistic view.
- AI-Powered Performance Testing Insights: Use AI to identify anomalies and predict potential performance issues.
Pros
- Robust enterprise-level functionality: Handles complex testing scenarios easily.
- Excellent technical support: Backed by Micro Focus’s support network.
- Detailed diagnostics and reporting: Provides in-depth insights into performance bottlenecks.
- Strong integration with other Micro Focus products: Seamless integration with other testing and DevOps tools.
Cons
- Expensive licensing model: A substantial investment, particularly for smaller organizations.
- Complex setup and configuration: Requires specialized knowledge and training.
- Substantial hardware requirements for controller: Needs powerful hardware for large-scale tests.
- Steeper learning curve: Requires dedicated time and effort to master.
Implementation/Setup Tips
- Plan your tests thoroughly: Define performance goals and critical user workflows.
- Start small: Gradually increase load to identify performance thresholds.
- Monitor system resources: Track CPU, memory, and network latency.
- Leverage LoadRunner’s features: Use the scripting and reporting capabilities to automate testing and analyze results.
Pricing and Technical Requirements
Contact Micro Focus for pricing information. Technical requirements depend on testing scale and protocols used. Consult the official documentation for detailed system requirements.
Website: https://www.microfocus.com/en-us/products/loadrunner-professional/overview
LoadRunner Professional, despite its complexity and cost, is a powerful tool for organizations requiring robust, enterprise-grade performance testing. While alternatives exist, few can match its comprehensive features and deep analysis capabilities, making it a valuable choice for ensuring application stability and performance.
4. Gatling
Gatling is a robust open-source load and performance testing tool. It’s designed for high performance and integrates easily into DevOps workflows. Unlike thread-based tools, Gatling uses an asynchronous, non-blocking approach leveraging Scala, Akka, and Netty. This allows it to simulate a huge number of concurrent users with minimal resources. It makes Gatling perfect for stress-testing demanding applications and APIs.
Gatling is particularly suited for testing HTTP servers. It uses a concise Domain Specific Language (DSL) for building realistic user scenarios. This code-based approach makes tests readable, maintainable, and version-controllable alongside your application code. This is essential for effective CI/CD. Think of simulating thousands of users browsing your e-commerce site, adding items to carts, and checking out – Gatling lets you define these scenarios with code, identifying performance bottlenecks before they affect your users.
Key Features and Benefits
-
DSL for HTTP Scenarios: Craft human-readable and maintainable test scenarios using Gatling’s intuitive DSL.
-
Real-time Reporting with Detailed Metrics: Monitor your application’s performance in real-time with comprehensive metrics. These include response times, throughput, and error rates. This helps you pinpoint performance bottlenecks quickly.
-
Session Recording and HAR Support: Analyze individual user sessions and integrate with HAR files for deeper analysis.
-
Easy CI/CD Integration: Gatling integrates smoothly with CI/CD pipelines, automating performance testing within your development process. Tools like Jenkins, GitLab CI, and Azure DevOps readily incorporate Gatling tests.
-
Asynchronous Concurrency Model: Simulate large loads with minimal resource consumption. This ensures accurate and reliable stress test results.
Pros
-
Excellent performance with low resource consumption: Gatling’s asynchronous model outperforms thread-based tools when simulating large numbers of users.
-
Code-based approach allows version control of tests: Manage performance tests like code, enabling better collaboration, versioning, and maintenance.
-
Beautiful and informative HTML reports: Gatling produces visually appealing reports detailing test results, making analysis easier.
-
Active development and community: Benefit from continuous improvements and a supportive community.
Cons
-
Steeper learning curve for non-developers: Some coding experience helps, even though the DSL is designed for readability.
-
Limited protocol support compared to JMeter: Gatling focuses primarily on HTTP, offering less support for other protocols.
-
Scala knowledge beneficial for advanced usage: Basic usage is simple, but advanced customization may require Scala knowledge.
-
Less extensive plugin ecosystem: Gatling’s plugin ecosystem is still growing.
Pricing and Technical Requirements
Pricing: Gatling Open Source is free. Gatling Enterprise offers advanced features, professional support, and enterprise tool integrations under a commercial license.
Technical Requirements: Requires Java Development Kit (JDK) 8 or later.
Comparison with JMeter
JMeter offers broader protocol support and a more extensive plugin ecosystem. Gatling excels in performance, its code-based approach, and its modern architecture. Choose Gatling if you prioritize HTTP performance and a DevOps-friendly approach.
Implementation/Setup Tips
- Download the Gatling open-source bundle from the official website.
- Unzip the bundle and go to the
bindirectory. - Run
gatling.sh(Linux/macOS) orgatling.bat(Windows) to launch the recorder. - Configure the recorder to capture browser traffic and generate a Scala script.
- Customize the generated script using Gatling’s DSL to define your test scenarios.
- Execute the script using the Gatling runner and analyze the reports.
Website: https://gatling.io/
5. K6 (Grafana K6)
K6 (now Grafana K6) is a modern, developer-focused performance testing tool. It’s designed for smooth integration with existing development workflows. Using JavaScript for scripting makes it easy for developers already familiar with the language to get started. This significantly reduces the learning curve compared to tools with proprietary scripting languages.
Developers can write performance tests alongside their application code. This fosters a culture of performance-driven development.
K6 excels at API testing. It’s ideal for simulating real-world scenarios, including load testing, stress testing, and soak testing. Imagine launching a new microservice. With K6, you can simulate thousands of concurrent requests. This helps identify bottlenecks and ensures stability under pressure.
The threshold feature lets you define acceptable performance limits. The test automatically fails if these limits are breached, which is perfect for CI/CD pipelines. K6 can test the resilience of your systems by simulating peak traffic loads. This helps identify breaking points and vulnerabilities before they affect your users.
The modular script organization with ES modules makes code reusable and maintainable, especially in larger projects. While API testing is K6’s primary focus, it goes beyond simple HTTP requests. K6 extensions can be used to test gRPC, WebSockets, and other protocols.
Features
- JavaScript-based scripting: Write performance tests using your existing JavaScript skills.
- Check API with threshold capabilities: Set performance goals and automate pass/fail evaluations.
- CI/CD integration: Integrate performance testing into your automated pipelines.
- Modular script organization with ES modules: Build reusable and maintainable test scripts.
- Cloud service for distributed tests (commercial version): Scale tests beyond a single machine.
Pros
- Developer-friendly with JavaScript support: Easy to learn and use.
- Low resource usage: Efficiently uses system resources, enabling larger-scale tests.
- First-class API testing capabilities: Designed for robust API performance testing.
- Excellent documentation and growing community: Plenty of resources and support available.
Cons
- Limited browser simulation: Browser-level testing is possible via extensions, but it’s not the primary focus. Consider dedicated browser testing tools like Selenium or Puppeteer for in-depth front-end performance analysis.
- Fewer protocols supported than some competitors: While extensible, it supports fewer protocols out-of-the-box than tools like JMeter.
- Less mature than established tools like JMeter: K6 is rapidly evolving, but it has a shorter history.
- Cloud execution requires paid subscription: Distributed cloud execution needs a K6 Cloud subscription. Pricing details are on the K6 website.
Implementation/Setup Tips
- Start with the official K6 documentation for installation and usage instructions.
- Use the K6 community forum for help and best practices.
- Explore the available extensions to expand K6’s functionality.
- Consider the paid K6 Cloud offering for large-scale, distributed load testing.
Website: https://k6.io/
K6 is a powerful and efficient tool. It’s particularly well-suited for developer-centric teams prioritizing API performance testing and CI/CD integration. The JavaScript-based approach simplifies the process, empowering development teams to incorporate performance testing into their workflows. While it may not be ideal for every situation, especially extensive browser-level testing or broad protocol support, K6 remains a valuable asset for modern performance testing.
6. Locust
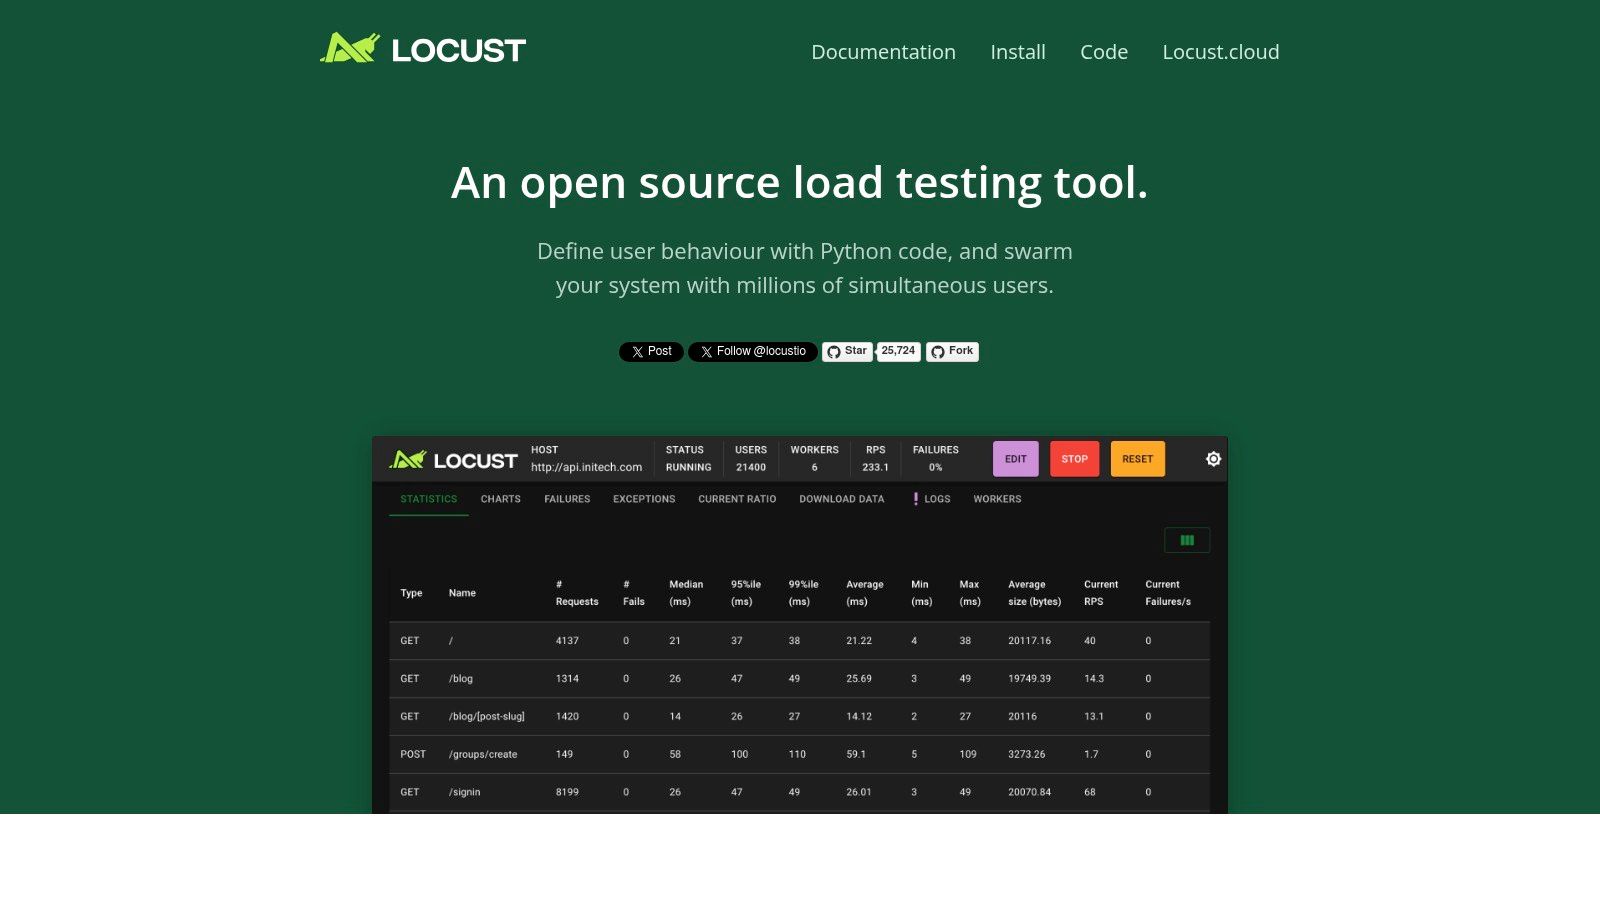
Locust is a powerful load testing tool that stands out for its developer-friendly approach. Using Python code to define user behavior offers a high level of flexibility and customization. This makes it ideal for simulating complex user scenarios, especially for teams already comfortable with the Python ecosystem.
Locust is free and open-source, allowing you to craft user behavior with familiar Python code. This contrasts with tools that rely on cumbersome UIs or domain-specific languages. With Locust, you can create intricate test scenarios mimicking real-world user interactions, going beyond simple HTTP requests to incorporate custom logic and workflows. Its distributed load generation capabilities let you simulate thousands of concurrent users, providing crucial insights into system performance under pressure.
Key Features and Benefits
- Python-based Test Scripting: Define user behavior using Python, enabling complex scenarios and easy integration with existing Python projects. This avoids the learning curve of proprietary scripting languages.
- Distributed Load Testing: Simulate massive user loads by distributing tests across multiple machines. This provides a realistic representation of real-world traffic patterns.
- Real-Time Web UI for Test Monitoring: Monitor test execution in real time through a web interface, visualizing key metrics like requests per second, response times, and error rates. This allows for quick identification of performance bottlenecks.
- Event-Driven Architecture: Locust’s event-driven architecture minimizes resource consumption. This allows for simulation of a large number of users with relatively modest hardware requirements.
- Extensible Through Hooks and Custom Classes: Customize Locust’s behavior through hooks and custom classes. This allows for integration with other tools and implementation of specific testing requirements.
Pros
- Highly Customizable with Python: Using Python offers immense flexibility for designing complex and realistic test scenarios.
- Minimal Resource Footprint: The event-driven architecture ensures efficient resource utilization, enabling large-scale simulations without needing extensive hardware.
- Excellent for API Testing: Locust excels at testing APIs and other backend services because of its code-driven approach and ability to handle complex request structures.
- Easy Integration with Existing Python Projects: Seamlessly integrates into existing development workflows and allows you to leverage existing Python libraries.
Cons
- Not Ideal for Protocol-Level Testing Beyond HTTP: While primarily designed for HTTP, testing other protocols might require extra effort.
- Less Comprehensive Reporting Than Enterprise Tools: The web UI offers real-time statistics, but it may not have the advanced reporting and analytics found in some commercial tools.
- Requires Python Knowledge: Effective use of Locust requires familiarity with Python programming.
- Basic Web UI Compared to Commercial Alternatives: The web UI, while functional, might be less polished and feature-rich compared to some commercial options.
Implementation/Setup Tips
- Install Locust with
pip install locust. - Define user behavior in a Python script by inheriting from the
LocustandTaskSetclasses. - Run Locust using the command
locust -f your_locust_file.py. - Access the web UI to configure and start the load test.
Comparison With Similar Tools
Compared to tools like JMeter, Locust provides a more code-centric approach, offering developers greater control over test scenarios. While JMeter features a more comprehensive GUI and broader protocol support, Locust’s Python integration makes it a preferred option for Python-centric teams. Tools like k6 also offer a developer-friendly experience with JavaScript. However, Locust’s maturity and the extensive Python ecosystem give it a significant advantage.
Website: https://locust.io/
Locust provides a robust and flexible approach to load testing. Its developer-friendly nature, combined with distributed testing and real-time monitoring, makes it a valuable asset for ensuring software performance and reliability under stress. While Python knowledge is required, the flexibility and control offered by Locust make it a compelling option for developers and QA engineers.
7. BlazeMeter
BlazeMeter, now a part of Perforce, is a powerful, cloud-based continuous testing platform. It’s particularly well-suited for stress testing web and mobile applications at scale. A core strength of BlazeMeter is its compatibility with JMeter. This allows current JMeter users to easily move to a cloud environment without rewriting their test scripts.
BlazeMeter isn’t just about hosting JMeter in the cloud, though. It provides a wide range of features for performance testing, API testing, and even functional testing.
This tool truly excels when simulating massive loads. Imagine needing to test your e-commerce site’s capacity for a Black Friday surge. BlazeMeter easily creates tests with millions of virtual users. These tests can originate from locations across the globe, accurately mimicking real-world user behavior. Achieving this level of scalability with on-premise solutions would be both complex and expensive.
Key Features and Benefits
-
JMeter Compatible, Yet Enhanced: Use your existing JMeter scripts while taking advantage of BlazeMeter’s expanded feature set.
-
Multi-Protocol Support: Test a range of application protocols, not just HTTP/S. This allows for thorough performance evaluations across various system components.
-
Advanced Scheduling and Reporting: Set up complex test scenarios with detailed load profiles. You then receive clear reports packed with actionable performance metrics.
-
Collaborative Test Management: Improve teamwork with shared test scripts, results, and reporting dashboards.
-
API and Functional Testing Capabilities: Extend testing beyond load tests with built-in API and functional testing options, creating a more efficient workflow.
-
Easy Scaling and Distributed Load Generation: Simulate enormous user loads from numerous global locations for an accurate view of real-world application performance.
-
Intuitive User Interface: Create, configure, and run tests with ease, even without in-depth scripting experience.
-
Seamless CI/CD Integration: Integrate BlazeMeter into your CI/CD pipelines to automate performance testing.
-
APM Integrations: Connect with Application Performance Monitoring (APM) tools to identify performance bottlenecks and gain deeper insights.
Pros
- Easily scale tests to millions of virtual users.
- Simulate realistic load from geographically diverse locations.
- User-friendly interface simplifies testing.
- Strong integrations with CI/CD tools and APM solutions.
Cons
- Costs can rise sharply for high-volume tests.
- Using advanced features effectively might require specialized knowledge.
- Enterprise-level features often come with higher-tier pricing plans.
- Limited options for offline testing.
Pricing
BlazeMeter offers tiered pricing based on factors like virtual user hours, test duration, and the features included. Visit their website for detailed pricing information.
Technical Requirements
As a cloud-based SaaS solution, BlazeMeter requires minimal local setup. You’ll primarily need a web browser and a stable internet connection. Familiarity with JMeter is helpful, particularly for using advanced features.
Implementation/Setup Tips
- Begin with a free trial to explore the platform.
- Use your existing JMeter scripts to quickly create tests.
- Take advantage of the detailed documentation and tutorials available on the BlazeMeter website.
- Consider integrating BlazeMeter into your CI/CD pipeline for automated performance testing.
Comparison with Similar Tools
While BlazeMeter excels in JMeter integration and user-friendliness, tools like LoadRunner and Gatling provide other approaches. LoadRunner is known for its broad protocol support. Gatling, on the other hand, focuses on code-based scripting and performance simulation. The ideal tool depends on your specific needs and your current set of tools.
Website: https://www.blazemeter.com/
BlazeMeter simplifies load testing. It offers a robust, cloud-based platform for simulating realistic user traffic and identifying performance bottlenecks. Its JMeter compatibility, scalability, and intuitive interface make it a valuable tool for any team dedicated to ensuring application performance under pressure. While cost is a consideration, the insights gained from thorough performance testing are often worth the investment, especially for businesses where downtime or slow performance can have significant financial and reputational consequences.
8. NeoLoad
NeoLoad, by Tricentis, is a powerful performance testing platform designed for complex enterprise applications. Its comprehensive features and focus on automation make it a valuable tool for organizations adopting DevOps and continuous testing. While the cost may be a consideration for smaller teams, its robust capabilities and user-friendly interface make it a strong contender for larger enterprises.
NeoLoad excels at simulating realistic user behavior and load scenarios. This allows teams to proactively identify and address performance bottlenecks before they impact end-users.
What Makes NeoLoad Stand Out?
NeoLoad is particularly well-suited for testing a variety of applications and architectures:
-
Complex Web Applications: NeoLoad handles dynamic web applications with ease, using automated correlation and parameterization features. This significantly reduces the scripting burden and speeds up test creation.
-
APIs and Microservices: With the growing importance of APIs, NeoLoad’s robust API testing capabilities are essential. It supports a wide range of API formats and protocols for thorough performance validation.
-
Mobile Applications: Simulate mobile network conditions and user behavior with NeoLoad. This ensures your mobile applications perform well under real-world conditions.
-
CI/CD Pipelines: NeoLoad integrates seamlessly with popular CI/CD tools like Jenkins and Azure DevOps, enabling automated performance testing as part of your delivery pipeline. This fosters a culture of continuous performance optimization.
Key Features and Benefits
Here’s a breakdown of what NeoLoad offers:
-
Automated Test Design and Maintenance: NeoLoad simplifies test creation with its intuitive drag-and-drop interface and automated recording capabilities. It also handles dynamic parameter updates and correlation, minimizing manual scripting.
-
Real-time Monitoring and Analysis: Gain immediate insights into application performance with real-time dashboards and detailed reports. This helps quickly pinpoint bottlenecks and identify areas for optimization.
-
Integration with CI/CD Pipelines: Automate performance testing within your CI/CD workflows, enabling continuous performance feedback and preventing performance regressions.
-
Hybrid Cloud/On-Premises Load Generation: Generate load from the cloud or on-premises, providing scalability and control over your testing environment.
-
Collaborative Team-Based Approach: Facilitate collaboration among team members with shared test assets, reports, and dashboards.
Pros and Cons
Here’s a quick overview of the advantages and disadvantages:
Pros:
- User-friendly interface with a relatively low learning curve.
- Excellent for complex, dynamic applications.
- Strong integration ecosystem.
Cons:
- Enterprise pricing may be prohibitive for smaller teams. Contact Tricentis for pricing details.
- Some advanced features may require significant configuration.
- The controller component can be resource-intensive.
- Fewer community resources compared to open-source options.
Implementation/Setup Tips
Getting started with NeoLoad? Consider these tips:
- Begin with a small-scale pilot project.
- Utilize NeoLoad’s training resources and documentation.
- Consider cloud-based load generation for increased scalability.
- Integrate NeoLoad with your existing monitoring tools.
Comparison with Similar Tools
NeoLoad is often compared to LoadRunner and JMeter. While JMeter is open-source and offers cost benefits, NeoLoad offers a more user-friendly interface and advanced features for enterprise-level testing. Compared to LoadRunner, NeoLoad is often praised for its simpler scripting and more modern interface.
Final Thoughts
NeoLoad is a strong option for organizations needing a comprehensive and automated performance testing solution. While cost is a factor, the platform’s ease of use, powerful features, and integration capabilities make it a worthwhile investment for ensuring the performance and scalability of critical applications.
9. LoadNinja
LoadNinja by SmartBear simplifies load testing by using real browsers, making it a powerful tool for teams focused on rapid and accurate performance testing. Instead of complex protocol-level simulations and tedious script correlation, LoadNinja lets you record and playback tests using actual browser instances. This provides more realistic performance data and significantly reduces the time spent on test creation and maintenance, making it ideal for both QA professionals and developers. This real-browser approach is particularly useful when testing complex web applications with dynamic content and AJAX calls, ensuring accurate performance metrics under load.
LoadNinja’s key features include:
- Scriptless test recording and playback
- A virtual user debugger for pinpointing performance bottlenecks
- Automated performance analytics with insightful dashboards
- TrueLoad technology for precise browser simulation
This combination allows teams to quickly identify and address performance issues before they impact users. Imagine needing to quickly assess the performance impact of a new feature rollout. With LoadNinja, you can record a user flow, instantly create a load test with hundreds of virtual users, and receive detailed performance metrics within minutes—all without writing a single line of code.
Compared to protocol-based tools like JMeter, LoadNinja offers faster test creation and more realistic performance insights, though at a higher resource cost. Its intuitive interface is a benefit for testers without extensive scripting experience, empowering them to contribute meaningfully to performance testing efforts. For a broader look at performance testing, you might be interested in this guide on application stress testing.
Pros and Cons of LoadNinja
Let’s take a closer look at the advantages and disadvantages of using this platform.
Pros:
- No scripting required: Create and modify tests quickly using the intuitive recorder and playback interface.
- Realistic testing: Uses real browsers for accurate performance data and avoids the issues of protocol-level simulations.
- Reduced time: Streamlines test creation and maintenance, freeing up time for analysis and optimization.
- Developer tools integration: Use browser developer tools for in-depth performance debugging.
Cons:
- Higher resource requirements: Running multiple browser instances consumes more resources than protocol-based tests.
- Limited protocol support: Primarily focused on web applications, with limited support for other protocols.
- Cloud-only solution: Requires an internet connection and relies on LoadNinja’s cloud infrastructure.
- Usage-based pricing: Costs can increase based on the number of virtual users and test duration. While specific pricing isn’t publicly available, LoadNinja operates on a subscription model with tiered plans based on usage. Contact SmartBear for a tailored quote.
Implementation Tips
Here are a few tips to get you started with LoadNinja:
- Start with a small number of virtual users and gradually increase the load to identify breaking points.
- Use the virtual user debugger to pinpoint performance bottlenecks in your application.
- Take advantage of LoadNinja’s analytics dashboards to track performance trends and identify areas for improvement.
LoadNinja earns its place on this list because it makes performance testing more accessible by removing the scripting barrier and providing realistic, actionable performance insights. Its ease of use, combined with its powerful features, makes it a valuable tool for any team aiming to streamline their performance testing process and ensure optimal application performance. Learn more about LoadNinja.
10. Flood.io
Flood.io stands out as a robust, cloud-based load testing platform designed for simulating high-volume user traffic. It supports several popular open-source testing tools like JMeter, Gatling, and Selenium, and offers a simplified approach to distributed testing without the burden of managing infrastructure.
Imagine needing to simulate thousands of concurrent users on your e-commerce platform just before a major sales event. Setting up the necessary infrastructure for this type of test can be overwhelming. Flood.io simplifies this process, providing on-demand access to a distributed network of load generators. You can use your existing JMeter, Gatling, or Selenium scripts, or their Element scripting language for browser-level tests. This streamlines the move to large-scale testing and lets teams use their existing skills, integrating Flood.io smoothly into their CI/CD pipelines.
Flood.io also provides comprehensive, real-time reporting, offering key insights into application performance under pressure. You can track metrics like response times, error rates, and throughput to identify and address bottlenecks, ensuring optimal performance before they affect your users.
Key Features and Benefits
-
Multi-Tool Support: Run tests using JMeter, Gatling, Selenium, or Element, accommodating varied team skills and testing needs.
-
Distributed Testing: Flood.io distributes tests across numerous servers, simulating realistic traffic from different locations.
-
Scalability: Easily scale tests from a few hundred to millions of users, replicating real-world scenarios like flash sales.
-
Real-Time Reporting: Live dashboards and detailed reports allow quick identification of performance issues.
-
Element Scripting: Simplified browser-level testing with a user-friendly scripting language.
Pros and Cons of Using Flood.io
Understanding the advantages and disadvantages can help determine if Flood.io is the right fit for your needs.
Pros:
- Flexible tool integration: Use your existing scripts and knowledge.
- Simple pricing model: Pay-as-you-go pricing based on node hours.
- Excellent for large-scale tests: Handles substantial user loads effectively.
- Good balance of usability and power: Intuitive interface with advanced features.
Cons:
- Maturity: May lack some features of established competitors.
- Advanced features may require tool knowledge: Getting the most out of the platform may require familiarity with underlying tools.
- Limited on-premises options: Primarily a cloud-based service.
- Advanced analytics may require additional setup: Deeper analysis may necessitate integrating with other tools.
Implementation Tips
- Begin with smaller tests and gradually increase the load.
- Monitor real-time reports to find and fix bottlenecks.
- Integrate Flood.io with your CI/CD tools to automate load testing within your development process.
Pricing and Website
Flood.io offers a pay-as-you-go model based on node hours used. Visit their website for current pricing.
Website: https://flood.io/
Flood.io provides a powerful and accessible load testing solution without the complexities of managing your own infrastructure. Its flexibility, scalability, and ease of use make it a valuable tool for ensuring application performance under stress and preventing costly downtime.
Head-to-Head Stress Testing Tools Comparison
| Product | Core Features | Quality (★) | Value (💰) | Audience (👥) | USP (✨) |
|---|---|---|---|---|---|
| 🏆 GoReplay | Session-aware replay, TLS optimization, connection pooling, analytics | Production-grade, strong community | Free community & premium enterprise options | Developers, QA, Enterprise IT | Real traffic mirroring & one-command setup |
| Apache JMeter | Cross-platform, multi-protocol, distributed testing | Reliable, well-documented | Completely free | Developers, testers, open-source enthusiasts | Extensive plugin ecosystem & visual reports |
| LoadRunner Professional | Advanced correlation, multi-protocol support, AI insights | Robust, enterprise-grade | Expensive licensing | Enterprise-level teams | In-depth diagnostics & integrated monitoring |
| Gatling | DSL for HTTP, real-time reporting, asynchronous model | High performance, low resource usage | Free open-source | Developers, DevOps engineers | Code-centric tests with beautiful HTML reports |
| K6 (Grafana K6) | JavaScript scripting, check API, CI/CD integration | Developer-friendly, lightweight | Free option with paid cloud services | Engineers, DevOps teams | Rich API testing & excellent documentation |
| Locust | Python-based scripting, distributed load, real-time UI | Highly customizable, minimal overhead | Free open-source | Python developers, testers | Flexible, event-driven testing through code |
| BlazeMeter | JMeter compatibility, multi-protocol, advanced scheduling | Cloud-based, intuitive | Usage-based pricing | Teams needing scalable tests | Easy scaling with seamless CI/CD integration |
| NeoLoad | Automated test design, hybrid load generation, CI/CD integration | User-friendly, robust performance | Enterprise pricing | Performance specialists, delivery teams | Automated maintenance & collaborative testing |
| LoadNinja | Real browser-based testing, scriptless recording, debugger | Accurate, realistic load simulation | Usage-based, cloud-only | QA professionals, testers without scripting | Real browser tests for faster, less complex setup |
| Flood.io | Multi-tool support, distributed grid, real-time reporting | Scalable, flexible performance | Simple pricing model | Teams performing large-scale tests | Integration of various tools with on-demand scaling |
Choosing the Right Stress Testing Software for Your Needs
Selecting the ideal stress testing software requires careful consideration. Factors like your budget, your team’s technical skills, your application’s performance needs, and your expected user base all play a vital role.
Open-source tools like JMeter, Gatling, Locust, and GoReplay offer cost-effective solutions. They provide varying levels of flexibility and community support, making them a great starting point for smaller teams or projects with limited budgets.
Enterprise-grade solutions such as LoadRunner Professional, NeoLoad, BlazeMeter, and LoadNinja provide advanced features. They also come with dedicated support and robust scalability for mission-critical applications, but at a higher cost. Choosing between tools like K6 (Grafana K6) and Flood.io depends on your specific integration and cloud-based testing needs.
Implementing Your Stress Testing Tool
When implementing your chosen tool, start with clear testing objectives. Define your key performance indicators (KPIs) and target thresholds. Begin with smaller-scale tests and gradually increase the load. This helps identify bottlenecks and performance limitations. Document your test cases and results for future analysis and optimization.
Budget and Resource Considerations
Budget and resource allocation are critical. Consider the software’s cost, and also potential investment in training, infrastructure, and ongoing maintenance. Open-source tools often require more internal expertise, while enterprise solutions typically come with comprehensive support and documentation.
Integration and Compatibility
Integration and compatibility are essential. Your chosen tool should integrate smoothly with your existing development and deployment pipelines. Consider compatibility with your application’s architecture, protocols, and technologies.
Key Takeaways
- Define your needs: Understand your application’s specific requirements and scale.
- Evaluate your budget: Balance cost with features and support.
- Consider your team’s expertise: Choose tools that match your technical skills.
- Prioritize integration: Ensure seamless integration with existing workflows.
- Start small and scale up: Gradually increase the load during testing.
Ensure your applications are resilient and perform flawlessly under pressure. GoReplay empowers you to use real user traffic for stress testing. Transform your production traffic into a powerful testing asset, identifying and resolving performance bottlenecks before they impact users. From its free, standard version, ideal for individual developers, to the feature-rich pro version designed for enterprise-scale testing, GoReplay offers flexibility and control. Experience real-world stress testing with GoReplay and deliver exceptional application performance. Learn more and download GoReplay today at https://goreplay.org.