Stress test webpage: How to Run Real-Traffic Tests with GoReplay

To really put a webpage through its paces, you have to hit it with real-world traffic in a controlled test environment. Using a tool like GoReplay for this is a game-changer because it gives you a far more accurate picture of performance and reliability than any generic, synthetic test ever could. It’s the only way to find those tricky bottlenecks that only show up under authentic user load.
Why Stress Test Your Webpage With Real Traffic
If you think you can properly stress test a webpage with predictable, synthetic scripts, you’re making a common—and potentially expensive—mistake. Real users are chaotic. They click, refresh, and abandon carts in ways that simple scripts just can’t mimic. A generic test might tell you your server can handle 1,000 concurrent connections, but it won’t show you the database lock that happens when 500 of those users try to redeem the same discount code all at once.
This is where replaying live traffic makes all the difference. By capturing the actual requests your users are making, you create a perfect, high-fidelity blueprint of real-world behavior. It’s not just about throwing a bunch of traffic at a server; it’s about re-enacting the messy, overlapping user journeys that truly push your system to its breaking point.
The True Cost of Performance Failures
Launching an untested system can be devastating for a business. Picture this: you launch a huge flash sale, the one you’ve been promoting for weeks, only to have the site crash under the first wave of customers. The immediate hit to revenue is bad enough, but the long-term damage to your brand’s reputation can be much worse. Users who hit a slow or broken site rarely come back.
There’s a reason the global stress testing solutions market is booming, with a projected compound annual growth rate of 21.7% from 2022 to 2029. During peak events, untested pages can see bounce rates jump by over 50% if load times drag past just three seconds. That translates to billions in lost revenue across the industry. This is precisely why more businesses are shifting to realistic testing methods. You can learn more about these market trends and their drivers.
The goal isn’t just to find the breaking point. It’s to understand how and why it breaks under genuine conditions, allowing you to build a more resilient and trustworthy user experience.
Uncovering Hidden Bottlenecks
A real-traffic stress test is brilliant at exposing vulnerabilities that synthetic tests almost always miss. These hidden gremlins often live in the complex interactions between different parts of your infrastructure.
- API Dependencies: Does that third-party shipping calculator slow down your entire checkout process when things get busy?
- Database Contention: How do simultaneous, complex user queries impact database performance and, more importantly, data integrity?
- Caching Inefficiencies: Is your caching layer actually helping during a traffic spike, or does it buckle and cause a cascade of failures?
By using a tool like GoReplay, you can see exactly how your system holds up in these authentic scenarios.

The process is fundamentally simple: capture live HTTP traffic and replay it in a staging environment. This is the foundation of a realistic stress test and what moves you from guesswork into evidence-based performance tuning.
Preparing Your Environment for GoReplay
A solid stress test doesn’t kick off with running the actual test—it starts with a properly prepped environment. Getting this groundwork right is probably the single most important factor for getting results that are accurate, safe, and actually mean something for your live webpage. Think of it like setting up a cleanroom for a science experiment; any contamination from a sloppy setup will just mess up your findings.
The main goal here is to build a testing ground that’s completely isolated from your live users but is also a near-perfect clone of your production setup. This lets you throw the full weight of replayed traffic at your application without worrying about a single real customer being affected.

Core Prerequisites for Setup
Before you even think about installing GoReplay and starting to stress test your webpage, you have to make sure your environment checks a few critical boxes. These are non-negotiable, whether you’re capturing traffic on production or replaying it on a staging server.
First off, you’ll need secure shell (SSH) access to both the production machine (your capture point) and the staging machine (your replay target). This is just standard practice for managing remote servers securely.
You’ll also need enough permissions to install software and sniff network traffic. On most Linux systems, that means having sudo or root access. GoReplay has to listen in on network interfaces, which is a privileged operation that a regular user account just can’t do.
Finally, think about your network. The staging server has to be reachable from wherever you’re running the GoReplay command. Make sure any firewalls are set up to allow traffic on the right ports—usually port 80 for HTTP and 443 for HTTPS—between the replay machine and the staging server.
Installing GoReplay on a Linux Server
Getting GoReplay up and running is refreshingly simple. For most folks on a standard Linux server, it’s just a matter of grabbing the latest binary and making it executable. It’s built to be lightweight with almost no dependencies.
Here’s what that looks like on a typical 64-bit Linux system:
- Download the latest release: Use
wgetto pull the compressed binary from the official source. - Extract the archive: Unpack the file with
tar. - Move the binary: Place the
gorexecutable somewhere in your system path, like/usr/local/bin, so you can run it from anywhere.
For instance, you could pop open your terminal and run these commands:
Fetch the latest version (check GitHub for the newest URL)
wget https://github.com/buger/goreplay/releases/download/v1.3.3/gor_1.3.3_x64.tar.gz
Extract the archive
tar -xvzf gor_1.3.3_x64.tar.gz
Move the executable into your path
sudo mv gor /usr/local/bin/
Once that’s done, you can check if it worked by just running gor --version. If it spits out the version number, you’re good to go.
A common mistake I see is people forgetting to use
sudowhen moving the binary. The command will just fail, and you’ll be left wondering whygorisn’t a recognized command. Always double-check your permissions.
Creating a Mirrored Staging Environment
This is where the real work begins, and it’s the most crucial part of the whole setup. Trying to run a stress test directly on your production server is asking for a catastrophe. You absolutely need a dedicated staging environment that mirrors production for any safe or meaningful testing.
So, what do I mean by “mirror”?
- Identical Infrastructure: Your staging server needs the same hardware specs (CPU, RAM, disk I/O) and the same software stack (OS, web server, runtime versions) as production.
- Cloned Database: Your app’s performance is almost always tied to its database. Use a recent snapshot of your production database so your tests are running against a realistic dataset.
- Matching Configuration: Every configuration detail—from application settings and environment variables to third-party API keys (using sandbox credentials, of course)—should be an exact match.
By creating this replica, you can be confident that any performance bottlenecks you find when you stress test webpage sessions are almost certainly present in your live environment too. For a deeper dive, there’s some great advice on the official site about GoReplay setup for testing environments.
With your environment prepped and ready, it’s time for the next step: capturing some real user traffic.
Capturing Live Traffic Without Impacting Performance
The real magic of GoReplay is how it acts like a fly on the wall. Forget about intrusive methods that add latency or introduce a new point of failure. GoReplay’s listener passively monitors network packets right from your production server. It just watches the traffic go by without ever getting in the way.
This means you can capture a perfect replica of user activity with zero impact on your live application’s performance. It’s a huge advantage when you need to stress test a webpage based on what people are actually doing, not what you guess they’re doing. You’re recording every click, search, and transaction exactly as it happens, creating a high-fidelity recording for an incredibly realistic test.
The Art of Passive Traffic Interception
Think of GoReplay as a network tap. It duplicates the packets containing HTTP requests and responses but never touches the original data stream. This is a world away from proxy-based solutions, which have to sit between your user and your server, actively processing every single request that passes through.
That distinction is critical for performance. Proxies, by their very nature, add overhead. It might be a tiny amount, but during a high-traffic event, that little bit of latency can be the straw that breaks the camel’s back. GoReplay’s passive approach sidesteps this risk entirely.
Getting started is as simple as running one command on your production server. You just need to tell GoReplay which network interface to listen on and where to save the captured traffic.
For standard HTTP traffic on port 80, the command is clean and simple:
sudo gor --input-raw :80 --output-file requests.gor
This tells GoReplay to do two things:
--input-raw :80: Listen for raw TCP packets on port 80.--output-file requests.gor: Save all captured traffic to a file namedrequests.gor.
That single command kicks off the capture process. GoReplay will now silently record every request made to your live webpage, storing it for your tests.
Handling Secure HTTPS Traffic
But what about HTTPS? Since the traffic is encrypted, GoReplay can’t just read the packets as they fly by. The solution is to provide it with your server’s TLS certificate, which allows it to decrypt the traffic as it’s being captured. This is still a passive operation and doesn’t interfere with the secure connection between the user and your server.
The command is almost identical, with just one extra flag to point to the certificate:
sudo gor --input-raw :443 --output-file secure-requests.gor --input-raw-tls-cert /path/to/your/cert.pem --input-raw-tls-key /path/to/your/key.pem
With this, you can capture an accurate representation of traffic even on fully secure websites, which is pretty much every site today.
Capturing traffic is the first step toward building a realistic load testing suite. The goal is to collect a dataset that truly represents your users’ behavior. Our guide on replaying production traffic for realistic load testing provides more depth on turning these captured files into actionable tests.
How Long Should You Capture Traffic?
The next logical question is, “So, how long should I let this run?” The answer really depends on what you want to test. Your goal is to capture a representative sample of user behavior.
- For Peak Load: Capture traffic during your busiest hour. If you run an e-commerce site, this might be during a flash sale or the holiday shopping frenzy.
- For Typical Daily Load: Let the capture run for a full 24-hour cycle. This gives you a great mix of peak and off-peak activity.
- For Specific Events: If you’re bracing for a big marketing launch, try capturing traffic from a previous, similar campaign to model the expected load.
Often, a one-hour capture during a peak period is more than enough to create a potent stress test. It gives you a concentrated dose of the most intense activity your site ever sees.
The COVID-19 pandemic was a brutal reminder of why this matters. As lockdowns pushed everyone online, web apps in sectors like e-commerce saw traffic surges of 40-70%. According to Allied Market Research, organizations that hadn’t prepared with robust stress testing watched their sites buckle under the load, costing them revenue and customer trust.
Safeguarding User Data During Capture
Capturing real traffic is powerful, but it comes with real responsibility. The captured data will contain everything users send—personally identifiable information (PII), passwords, API keys, you name it. It is absolutely critical to handle this data with care.
GoReplay has advanced features for filtering and masking sensitive data on the fly, which we’ll dive into later. For now, just remember that the raw capture file should be treated as highly sensitive. Always store it securely and restrict access to only those who need it. This ensures your stress tests are not just effective but also compliant and secure.
Running Your First Stress Test in a Staging Environment
With your raw user traffic captured and securely stored, you’re holding the key to a truly realistic stress test. Now it’s time to move from passively listening to actively testing. Let’s unleash this captured traffic onto your staging environment and see how it holds up under real pressure.
This isn’t about just dumping a firehose of traffic and hoping for the best. Think of it as a controlled experiment. You’re the scientist, carefully managing the variables to discover your webpage’s true performance limits and find those elusive breaking points. The whole point is to design a test that can be repeated, measured, and, most importantly, give you actionable insights.
Starting with a Baseline Replay
Before you crank the dial to eleven, you have to establish a baseline. This means replaying the captured traffic at its original speed (1x). This simple step is critical—it validates your entire setup and gives you a clear picture of how your staging environment performs under a normal, real-world load.
To get started, you’ll use a gor command that reads from your saved file and points the traffic right at your staging server. The command itself is pretty straightforward:
gor --input-file "requests.gor" --output-http "http://staging.yourwebapp.com"
Let’s quickly break that down:
--input-file "requests.gor": This tells GoReplay to use your captured traffic file as the source. Simple enough.--output-http "...": This directs all the replayed traffic to the URL you specify—in this case, your staging server.
Once you run this, GoReplay will replay every single user request from your capture file against your staging server, in the exact order and timing they originally occurred. Keep an eye on your server’s monitoring tools. If everything behaves as expected, you’ve just confirmed your test setup is solid and you have a reliable performance baseline.
Amplifying the Load to Find Breaking Points
Now for the fun part. The primary reason to stress test a webpage is to see how it handles loads that are way greater than normal. This is how you find the bottlenecks that cause slowdowns or outright crashes during a real traffic spike. GoReplay makes this incredibly easy with just a few key flags.
To really ramp things up, --output-http-workers is your go-to flag. It controls how many requests GoReplay sends at the same time, letting you multiply the load.
For instance, if you want to simulate 10 times the original traffic, you’d run something like this:
gor --input-file "requests.gor" --output-http "http://staging.yourwebapp.com" --output-http-workers 10
This command spawns ten “workers,” each replaying the full set of traffic independently. You can also get more granular by combining this with --output-http-speed-limit to control the requests-per-second rate, giving you pinpoint control over the test’s intensity.
My advice? Increase the load incrementally. Don’t jump straight from 1x to 50x. Start at 2x, then 5x, then 10x, and so on. This methodical approach helps you pinpoint the exact moment performance starts to degrade, rather than just discovering that a massive load crashes everything instantly.
The business impact here is huge. Performance testing is a pillar of any serious digital strategy because slow load times can inflate bounce rates by 32% for every second of delay. Simulating chaos—like a flash sale hitting a million users—is how you ensure your site stays snappy when it matters most. After optimizing based on these tests, businesses often see revenue uplifts of 20-30%. You can find more insights on the performance testing market at dataintelo.com.
This whole process is powered by the traffic you captured earlier. The flow is quite simple, as the diagram shows.
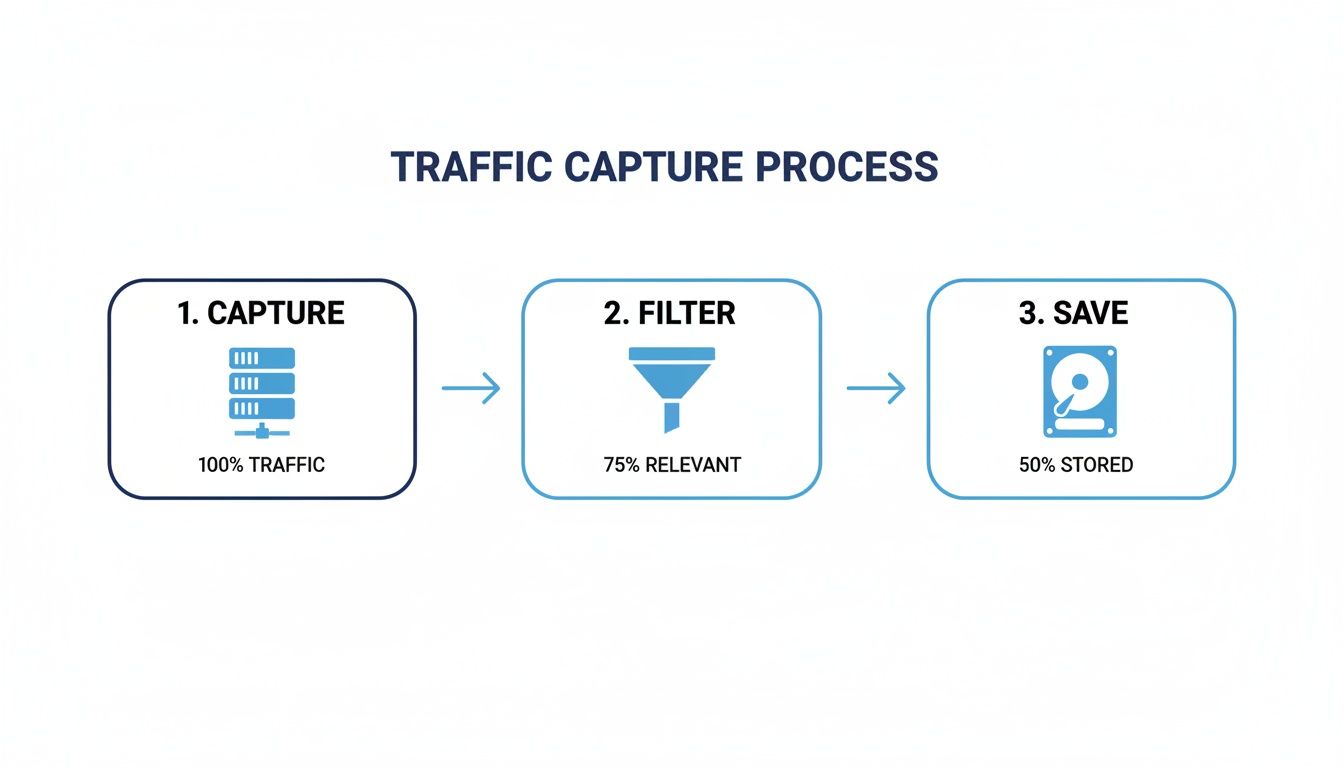
This simple “capture, filter, and save” foundation is what enables you to create these powerful, realistic stress tests.
Advanced Replay Configurations
Of course, real-world apps aren’t always simple HTTP. You’ll almost certainly need to account for TLS encryption (HTTPS) and other common complexities. GoReplay has flags to handle these scenarios gracefully.
If your staging server uses HTTPS, you’ll probably need to tell GoReplay to trust its certificate, especially if it’s a self-signed one common in dev environments. The --output-http-insecure flag is perfect for this.
gor --input-file "requests.gor" --output-http "https://staging.yourwebapp.com" --output-http-insecure
This tells GoReplay to just get on with it and send the requests without validating the TLS certificate—a totally safe and normal practice within a controlled staging environment.
Key GoReplay Flags for Stress Testing
As you get deeper into testing, you’ll rely on a handful of command-line flags to shape your tests. Here are some of the most useful ones to keep in your back pocket.
| Flag | Purpose | Example Usage |
|---|---|---|
--output-http-workers | Sets the number of concurrent workers to amplify load. | --output-http-workers 50 |
--output-http-speed-limit | Limits the replay rate to a specific number of requests per second. | --output-http-speed-limit 100/1s |
--output-http-insecure | Skips TLS certificate verification for HTTPS staging sites. | --output-http-insecure |
--output-http-timeout | Defines how long to wait for a response before timing out. | --output-http-timeout 5s |
By combining these flags, you can design highly specific and realistic stress tests. You can simulate anything from a sudden, massive traffic spike to a sustained, high-volume load over a longer period. This flexibility is what lets you move beyond basic testing into true performance engineering, building a faster, more reliable site for your users.
Monitoring Key Metrics and Analyzing Test Results
Launching a full-scale replay of user traffic is a pretty cool technical achievement, but it’s only half the story. The real gold is in what you do while the test is running and right after it finishes. This is where you turn a firehose of raw data into actual, actionable insights that will make your application stronger.
If you skip careful monitoring and analysis, you’re just throwing traffic at a server and hoping for the best. Instead, you need to put on your detective hat, watch how the system behaves under pressure, and hunt for clues that reveal its hidden weaknesses.

Pinpointing Critical Performance Indicators
During a stress test, you’re going to be swimming in data from every corner of your infrastructure. The trick is knowing which numbers actually matter. By focusing on a core set of Key Performance Indicators (KPIs), you can cut through the noise and get a clear picture of your system’s health.
Your monitoring should really cover two main areas: the server’s basic vital signs and how the application is actually performing for a user.
Server-Side Health Metrics to Watch
- CPU Utilization: Think of this as your server’s brainpower. If you see a sustained CPU load above 80-90%, that’s a massive red flag. Your server is struggling.
- Memory Usage: Keep an eye out for memory consumption that just keeps climbing and never levels off. This is a classic sign of a memory leak in your code—the kind of nasty bug that often only shows up under a heavy, sustained load.
- Disk I/O: High disk read/write activity might mean your database is getting hammered or your application is leaning too heavily on slow disk operations instead of faster memory.
- Network Throughput: Are you maxing out your server’s network card? This can quickly become a bottleneck that strangles all traffic, both coming in and going out.
For a live look at these server stats, you can’t beat simple command-line tools. htop is fantastic for CPU and memory, while dstat gives a great combined overview. But for a deeper, historical analysis, an Application Performance Monitoring (APM) tool like Datadog or New Relic is the way to go.
Interpreting Application-Level Data
Server health is one thing, but what your users feel is all about application-level metrics. These numbers tell you how your actual code is holding up under the strain.
The big two here are response time and error rates. You want to see response times stay consistently low, even as the traffic ramps up. But more importantly, you need to be on high alert for any HTTP status codes that scream “failure.”
The one metric that should grab your immediate attention is the 5xx error rate. A sudden jump in
500 Internal Server Erroror503 Service Unavailableresponses means your application is actively breaking for users. This is the clearest possible sign that you’ve found a critical breaking point.
Connecting the Dots with Real-World Scenarios
The real skill here is tying different metrics together to diagnose the root cause of a problem. A single data point rarely tells the full story; it’s the patterns that emerge when you combine them that lead to a breakthrough.
Let’s walk through a common scenario. During your test, you see average response times climbing steadily. At the same time, your monitoring shows CPU utilization spiking to 95%, but memory usage is totally stable. This pattern points directly to an application-level bottleneck. Your code is probably stuck in a computationally heavy task—like some complex data processing or an inefficient loop—that’s completely maxing out the CPU.
Now, picture a different outcome. Response times are slow again, but this time, the CPU is just chilling at 40%. However, your database monitor shows a ton of slow queries and high disk I/O on the database server. This tells you the problem isn’t your application code; it’s a database bottleneck. The web server is fine, but an unoptimized query or a missing index is making the database the weakest link in the chain.
When you learn to spot these patterns, you can quickly tell where the fire is and focus your efforts where they’ll have the biggest impact. This is how you turn abstract numbers from your stress test webpage exercise into a clear, prioritized to-do list for performance improvements.
Going Beyond the Basics: Advanced GoReplay Techniques
Once you’ve got the hang of simple replays, you can start unlocking GoReplay’s real power. Moving beyond baseline tests is where you’ll find the deepest insights, especially when you need to stress test a webpage for a massive event. This means getting smart about how you handle the traffic itself and how you scale your tests.
The magic really happens when you start modifying traffic on the fly. This isn’t just a neat trick; it’s absolutely essential for security and compliance. Think about it: your captured traffic is full of sensitive user data like passwords, session tokens, and API keys. You can’t just dump that raw data into a staging environment. It needs to be sanitized.
Masking and Modifying Sensitive Data
This is where GoReplay’s built-in modifiers come into play. They are your best friends for rewriting parts of each request, letting you strip out or mask sensitive info before it ever touches your staging application. Honestly, this is a non-negotiable step for keeping data private and staying compliant.
For instance, let’s say you need to get rid of a sensitive Authorization header from every single request. A simple command-line flag handles it beautifully:
--http-header-limiter "Host,User-Agent,Accept"
This command tells GoReplay to only allow the headers you’ve listed. Anything else, including that sensitive auth token, gets dropped on the floor.
A common real-world problem is anonymizing user data buried inside the request body. You can use regular expressions to find and replace things like email addresses or user IDs. This way, your test uses realistic request structures without exposing any PII.
Scaling Tests Across Multiple Machines
So, what happens when you need to simulate a traffic surge so big that one machine just can’t keep up? This is the classic challenge when prepping for something like a Black Friday sale or a viral product launch. The answer is to spread the load across a bunch of machines.
GoReplay was built for this. It uses a master-slave architecture where you run a single gor instance as the master, which then hands off the replay workload to several slave instances running on other servers.
This setup lets you scale your test horizontally, essentially combining the power of multiple machines to generate almost unlimited traffic. It’s how you find the absolute breaking point of your infrastructure before your users do.
Automating Performance Testing in Your CI/CD Pipeline
The ultimate goal for any sharp development team is to squash performance bugs long before they hit production. The best way to do that? Weave your GoReplay stress tests right into your CI/CD pipeline.
Here’s what that looks like in practice:
- Trigger on Deploy: A new push to the staging environment automatically kicks off the testing pipeline.
- Run the Stress Test: The CI/CD job fires up a pre-configured GoReplay command, replaying a standard captured traffic file against the new code.
- Watch the KPIs: While the test runs, the pipeline keeps an eye on critical metrics like error rates and response times.
- Pass or Fail: The job then compares the results against your benchmarks. If response times jump by more than 10% or the error rate climbs over 1%, the build fails. Done.
This automated feedback loop is your safety net. It stops performance regressions in their tracks, turning the process to stress test a webpage from a chore you do once in a while into a consistent, automated quality gate. Every single release stays just as fast and reliable as the last one.
At GoReplay, we build tools that let developers and QA teams test with absolute confidence. When you use real traffic, you stop guessing and start building truly resilient, high-performance applications. Discover how our enterprise-ready features can transform your testing strategy at https://goreplay.org.