A Guide to Software Development KPIs That Drive Real Results

Let’s be honest: most engineering teams are drowning in data but starved for real answers. They track dozens of metrics, build elaborate dashboards, and burn hours debating trendlines. Yet, after all that effort, they can’t answer one simple question: “Are we actually getting better?”
The problem isn’t a lack of data. It’s that they’re measuring the wrong things.
Why Most Software Development KPIs Miss the Mark
So many of the traditional KPIs, like lines of code written or the number of tickets closed, are just plain broken. They measure activity, not achievement. Think about it—would you judge a chef by how many pans they used instead of how the food tastes? It sounds absurd, but that’s exactly how countless organizations still evaluate their engineering teams.
The Pitfall of Vanity Metrics
These outdated “vanity metrics” don’t just create a false sense of progress; they actively poison productivity and morale. When you incentivize developers to close more tickets, they’ll inevitably rush their work, which just leads to shoddy quality and more bugs down the road. Judge them on lines of code, and you’ll get bloated, inefficient code instead of elegant solutions.
This focus on busywork over impact creates a culture where developers feel like they’re on a hamster wheel—running faster and faster but never actually getting anywhere meaningful. It disconnects their daily efforts from the larger business goals they are meant to support.
It’s a flawed approach, and it’s why we need a fundamental shift in thinking. It’s time to stop measuring busyness and start measuring what truly matters.
From Activity to Value
Modern, effective software development KPIs are built to do just that. They create a straight line between the engineering team’s work and tangible business results, focusing on what actually drives the company forward. This new mindset centers on answering the big questions:
- How quickly can we deliver value to our users? (Delivery Efficiency)
- Is the software we ship reliable and high-quality? (Product Quality)
- Are we building things that customers actually use and love? (Business Impact)
When you rebuild your measurement strategy around these core ideas, your KPIs transform from a tedious reporting chore into a powerful engine for continuous improvement. This guide will show you exactly how to find and implement the metrics that genuinely reflect your team’s health, efficiency, and contribution to the bottom line.
The Four Pillars of Meaningful Engineering Metrics
If you want to move away from feel-good “vanity metrics,” you need a solid framework. Think about it like building a house—you don’t start by picking out paint colors. You pour a strong foundation first. For software development KPIs, that foundation rests on four essential pillars that give you a balanced, complete picture of your team’s health.
Each pillar is designed to answer a critical question about your team’s performance. By organizing your metrics this way, you create a clear roadmap connecting the day-to-day grind of engineering with the big-picture goals of the business.
Let’s break down these four pillars and what they tell you.
Pillar 1: Delivery Efficiency
This pillar answers a simple, direct question: How quickly and predictably can we ship value to our users? It’s all about the speed and smoothness of your development pipeline. The metrics here shine a light on bottlenecks and process friction, helping you streamline the journey from a great idea to a live feature.
A classic KPI in this category is Cycle Time. This measures the total time it takes to get from the first code commit all the way to a production deployment. Shorter cycle times are a dead giveaway of an agile, efficient process.
Pillar 2: Product Quality
Next up, we need to ask: Is the software we deliver reliable and stable? Speed means nothing if the product is riddled with bugs. Quality metrics help you get a real handle on the stability of your codebase and understand how changes impact the end-user experience.
The goal isn’t just to find bugs but to prevent them from ever reaching your customers. One of the most important metrics here is the Change Failure Rate (CFR), which tracks the percentage of your deployments that cause a production failure bad enough to need a hotfix or rollback.
A low Change Failure Rate is a sign of a mature development process. It shows that your team can deliver new features quickly without sacrificing the stability that your users depend on.
Pillar 3: System Performance
This pillar focuses on another vital question: Is our application available and responsive for users? Even the most beautifully written, high-quality code is worthless if the system it runs on is slow or constantly crashing. Performance KPIs are non-negotiable for monitoring the health and reliability of your production environment.
These metrics have a direct line to user satisfaction and trust. A perfect example is Application Uptime, which simply measures the percentage of time your software is operational and available. For almost any modern application, consistently high uptime isn’t a “nice to have”—it’s a fundamental requirement.
Pillar 4: Business Impact
Finally, and maybe most importantly, this pillar asks: Are we building things that customers actually use and value? This is where engineering work connects directly to business outcomes. These KPIs make sure your team isn’t just shipping features for the sake of it, but is delivering tangible value that moves the company forward.
This is all about linking technical work to strategic goals. A powerful metric here is the Feature Adoption Rate, which shows you what percentage of users are actively engaging with a new feature after it’s released. It’s the ultimate validation that the team’s effort was spent on something customers truly wanted.
Here’s a quick summary of how these four pillars come together.
The Four Pillars of Software Development KPIs
| Pillar | What It Measures | Example KPIs |
|---|---|---|
| Delivery Efficiency | The speed and predictability of the development pipeline. | Cycle Time, Deployment Frequency, Lead Time for Changes |
| Product Quality | The stability and reliability of the software in production. | Change Failure Rate (CFR), Mean Time to Recovery (MTTR) |
| System Performance | The responsiveness and availability of the application. | Application Uptime, Latency, Error Rate |
| Business Impact | The value and engagement generated by new features. | Feature Adoption Rate, User Satisfaction (CSAT/NPS) |
This framework helps ensure you’re getting a complete and balanced view of engineering effectiveness.
This diagram perfectly illustrates the critical shift from tracking outdated, activity-based metrics to focusing on those that deliver real business impact.
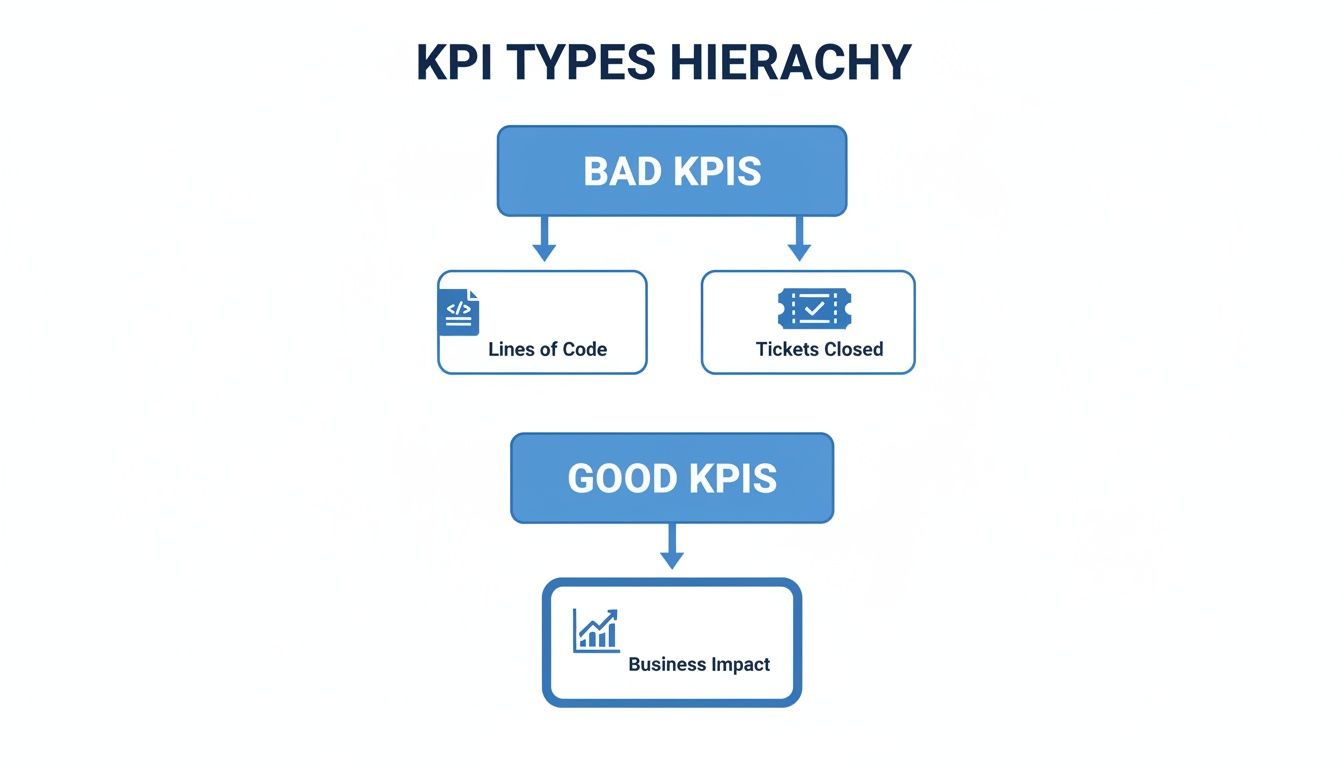
As you can see, metrics like “Lines of Code” or “Tickets Closed” are mostly noise. The real signal comes from KPIs tied directly to business value. By adopting this four-pillar framework, you ensure your measurement strategy is balanced, comprehensive, and focused on what really matters.
Mastering Delivery Velocity with DORA Metrics
To really get a grip on delivery efficiency, you have to look past raw speed. What truly matters is velocity—the power to deliver value both quickly and predictably. This is where the DORA (DevOps Research and Assessment) metrics change the game. They’ve become the gold standard for measuring what separates good engineering teams from truly elite ones.
These four key metrics offer a complete picture of your team’s ability to ship high-quality software again and again. While they’re all important, one in particular acts as a powerful barometer for your entire process health: Cycle Time.
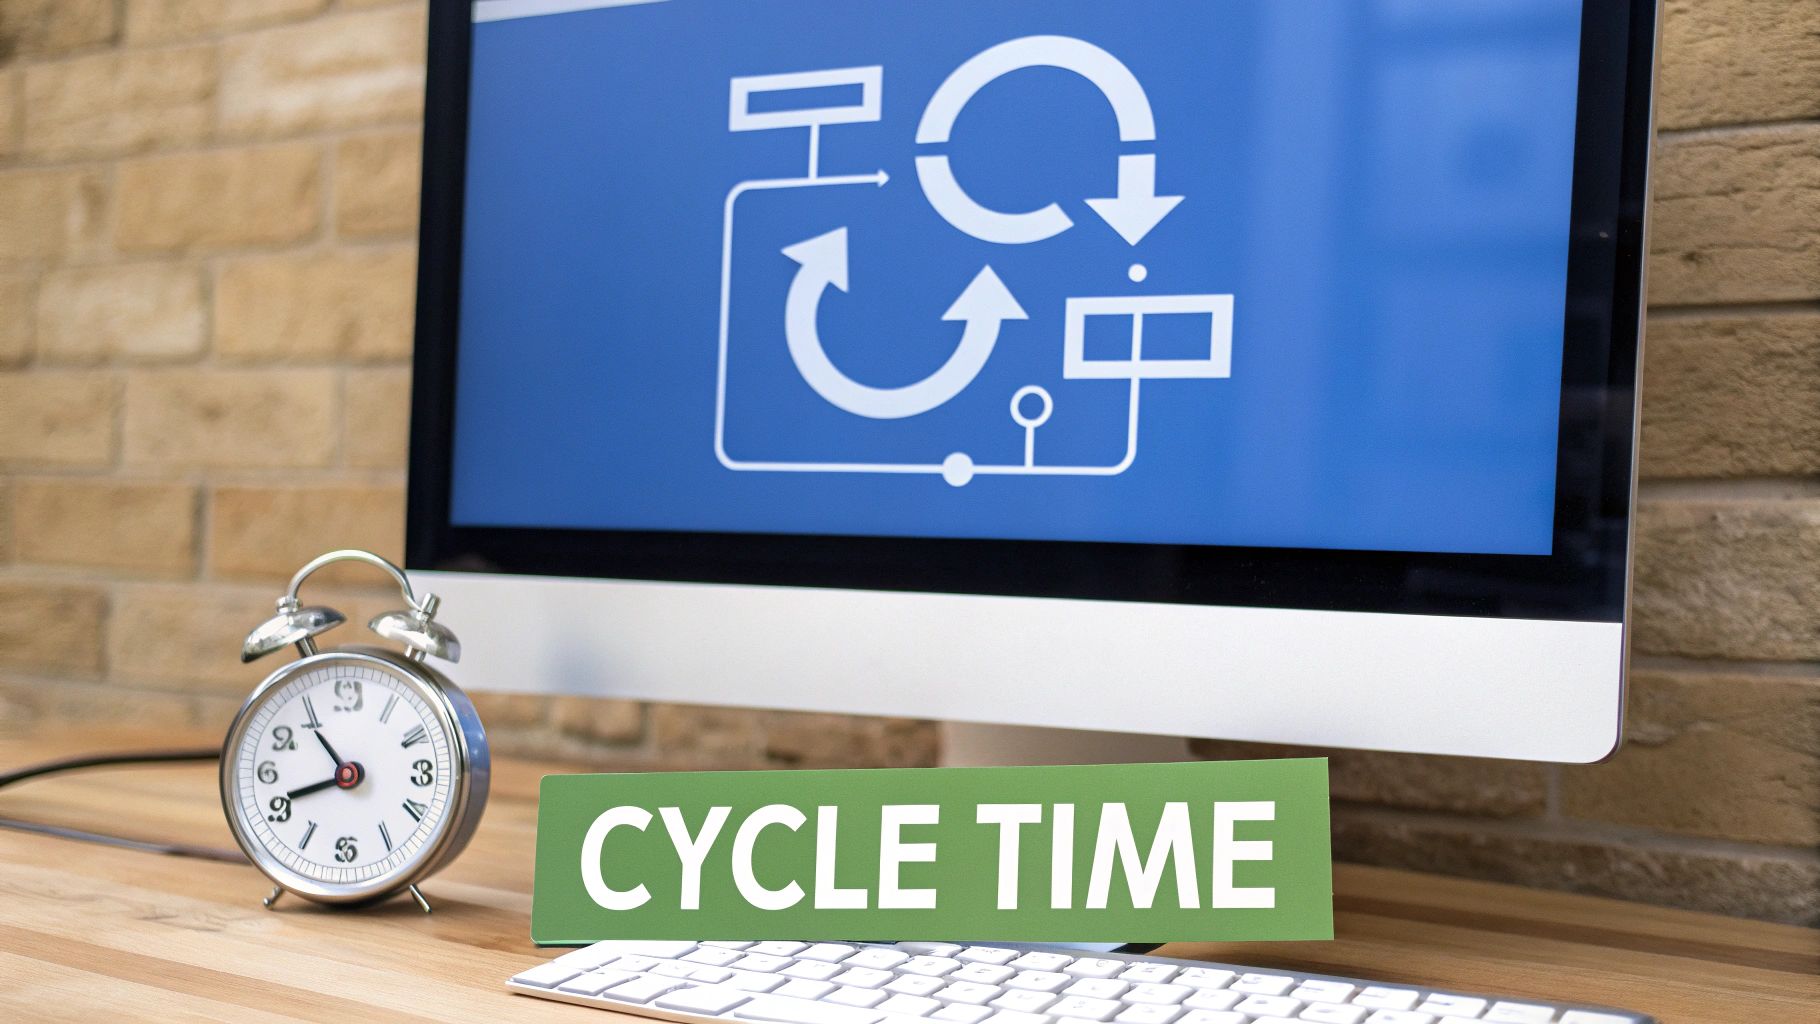
Demystifying Cycle Time
Think of Cycle Time as the total duration from “idea” to “in the hands of the user.” It tracks the full journey, starting the moment a developer commits the first line of code and ending the second it’s live in production. This one metric wraps up the efficiency of your whole workflow—from coding and code review all the way through testing and deployment.
A short Cycle Time is a dead giveaway of a lean, agile, and well-oiled engineering machine. It tells you the team has crushed friction, automated the tedious stuff, and built a pipeline that moves at the speed of innovation.
A low Cycle Time isn’t just a technical trophy; it’s a massive competitive advantage. It means you can react to market shifts faster, get user feedback sooner, and outmaneuver competitors stuck in sluggish, inefficient processes.
This powerful software development kpi is a direct reflection of your ability to execute. And with the custom software development market expected to hit $43.16 billion in 2024, teams that shrink their delivery cycles are the ones who will win.
The Anatomy of an Elite Cycle Time
So, what does “elite” actually look like? The best teams measure their Cycle Time in hours, not weeks. They pull this off through a blend of smart cultural habits and top-tier technical practices.
Here’s a peek into their playbook:
- Small, Incremental Changes: Forget massive, high-risk feature drops. Elite teams work in small, manageable batches. This cuts down the complexity of each change, making code reviews faster and deployments a whole lot safer.
- Robust Automation: They automate everything they can get their hands on, from unit tests and integration checks right up to the final deployment. This rips out manual bottlenecks and guarantees consistency.
- High-Confidence Testing: Their testing strategy gives them absolute confidence in every release. No more endless back-and-forth bug-fix loops that completely destroy Cycle Time.
That last point is where modern tooling becomes absolutely essential. How can a team possibly deploy multiple times a day without setting production on fire? The secret is simulating real-world chaos with incredible accuracy.
Slashing Cycle Time with Traffic Replay
One of the biggest anchors dragging down Cycle Time is the fear of production failures. That fear leads to painfully long testing phases, manual QA cycles, and hesitant release schedules. This is the exact problem that traffic replay tools were born to solve.
Imagine capturing the messy, unpredictable behavior of your real users and replaying it perfectly against your staging environment. That’s what tools like GoReplay make possible. By capturing and replaying live HTTP traffic, you can validate new code against reality—not just the clean, predictable world of unit tests.
This approach completely transforms your testing process and directly boosts your key software development kpis:
- Find Bugs Earlier: It uncovers weird edge cases and performance gremlins that would have otherwise slipped into production, preventing those dreaded late-night hotfixes.
- Increase Deployment Confidence: When you know a change has already survived a simulation of real production traffic, you can hit “deploy” with conviction.
- Accelerate QA Cycles: It massively reduces the burden of manual testing, freeing up QA engineers to focus on more creative and complex exploratory testing.
By integrating traffic replay, you’re not just testing code; you’re stress-testing it against reality itself. This gives teams the green light they need to deploy faster and more often, turning a key delivery metric into a powerful engine for improvement. It’s also a crucial piece of the puzzle for improving incident response, a topic we cover in our guide to reducing Mean Time to Recovery (MTTR).
How to Choose and Implement KPIs for Your Team
Knowing which software development KPIs exist is one thing. Actually picking the right ones and getting your team to use them? That’s the real challenge.
So many teams fall into the trap of measuring absolutely everything. They get buried in data but are starved for any real insight. A focused, deliberate approach isn’t just nice to have; it’s essential.
The trick is to shift your mindset from “What can we measure?” to “What do we need to improve?” Your KPIs should be a direct reflection of your strategic goals, giving you clear signals that guide your team’s decisions and daily work. This is how you make sure your metrics do more than just fill a dashboard.
Using the SMART Framework for KPIs
To avoid picking vague or unhelpful metrics, the SMART framework is your best friend. It’s a simple but powerful filter that makes sure every KPI you choose is well-defined and tied to a real outcome. Think of it as a quality check before you commit to tracking anything.
Let’s break down how this applies to engineering KPIs:
- Specific: The metric needs to target a precise area for improvement. “Improve code quality” is way too broad. “Reduce the Change Failure Rate” is specific.
- Measurable: You have to be able to put a number on it. “Reduce the Change Failure Rate from 15% to 5%” is something you can actually measure.
- Achievable: The goal has to be realistic for your team. A target of 0% Change Failure Rate might sound great, but it’s probably unattainable and will just demotivate everyone.
- Relevant: The KPI must line up with bigger business goals. Cutting down on failure rates is relevant because it directly improves the customer experience and saves the company from costly rework.
- Time-bound: Your goal needs a deadline. “Reduce the Change Failure Rate from 15% to 5% over the next quarter” creates a sense of urgency and a clear timeline for checking in.
This framework turns fuzzy goals into concrete, actionable targets. It’s the difference between saying “let’s get faster” and “let’s get our average Cycle Time for new features under 72 hours within the next two months.”
Getting Team Buy-In and Starting Small
Once you’ve used the SMART framework to identify a few key metrics, the next make-or-break step is implementation. This is as much about people as it is about data. Without your team’s buy-in, even the most perfect KPIs are doomed to fail.
KPIs should be a tool for collective improvement, not a weapon for individual performance reviews. When metrics are used to create fear or unhealthy competition, teams will naturally find ways to game the system, rendering the data useless.
To build that trust and ensure your metrics are genuinely helpful, you need a clear plan:
- Start with Why: Kick things off with an open conversation. Explain the “why” behind the new metrics—what problems are you actually trying to solve? For example, “Our long Cycle Times are delaying customer feedback, so let’s track it to find bottlenecks.”
- Collaborate on Selection: Get the team involved in picking the final KPIs. When developers help define what success looks like, they have a real stake in the outcome.
- Choose Your Tools: Figure out where the data will come from. The good news is that most of the data you need for key software development KPIs already lives in tools like Jira, GitHub, or GitLab. The goal is to automate data collection so no one is stuck with manual, error-prone tracking.
- Start with a Few Metrics: Don’t try to boil the ocean. Pick just two or three high-impact KPIs that address your most pressing goals. Once the team is comfortable and sees the value, you can slowly expand from there.
This collaborative, incremental approach makes sure your KPIs are seen as a supportive tool—something that empowers the team to improve its own processes and deliver better results. It turns measurement from a source of anxiety into a driver of positive change.
Creating Actionable Dashboards and Avoiding Common Pitfalls
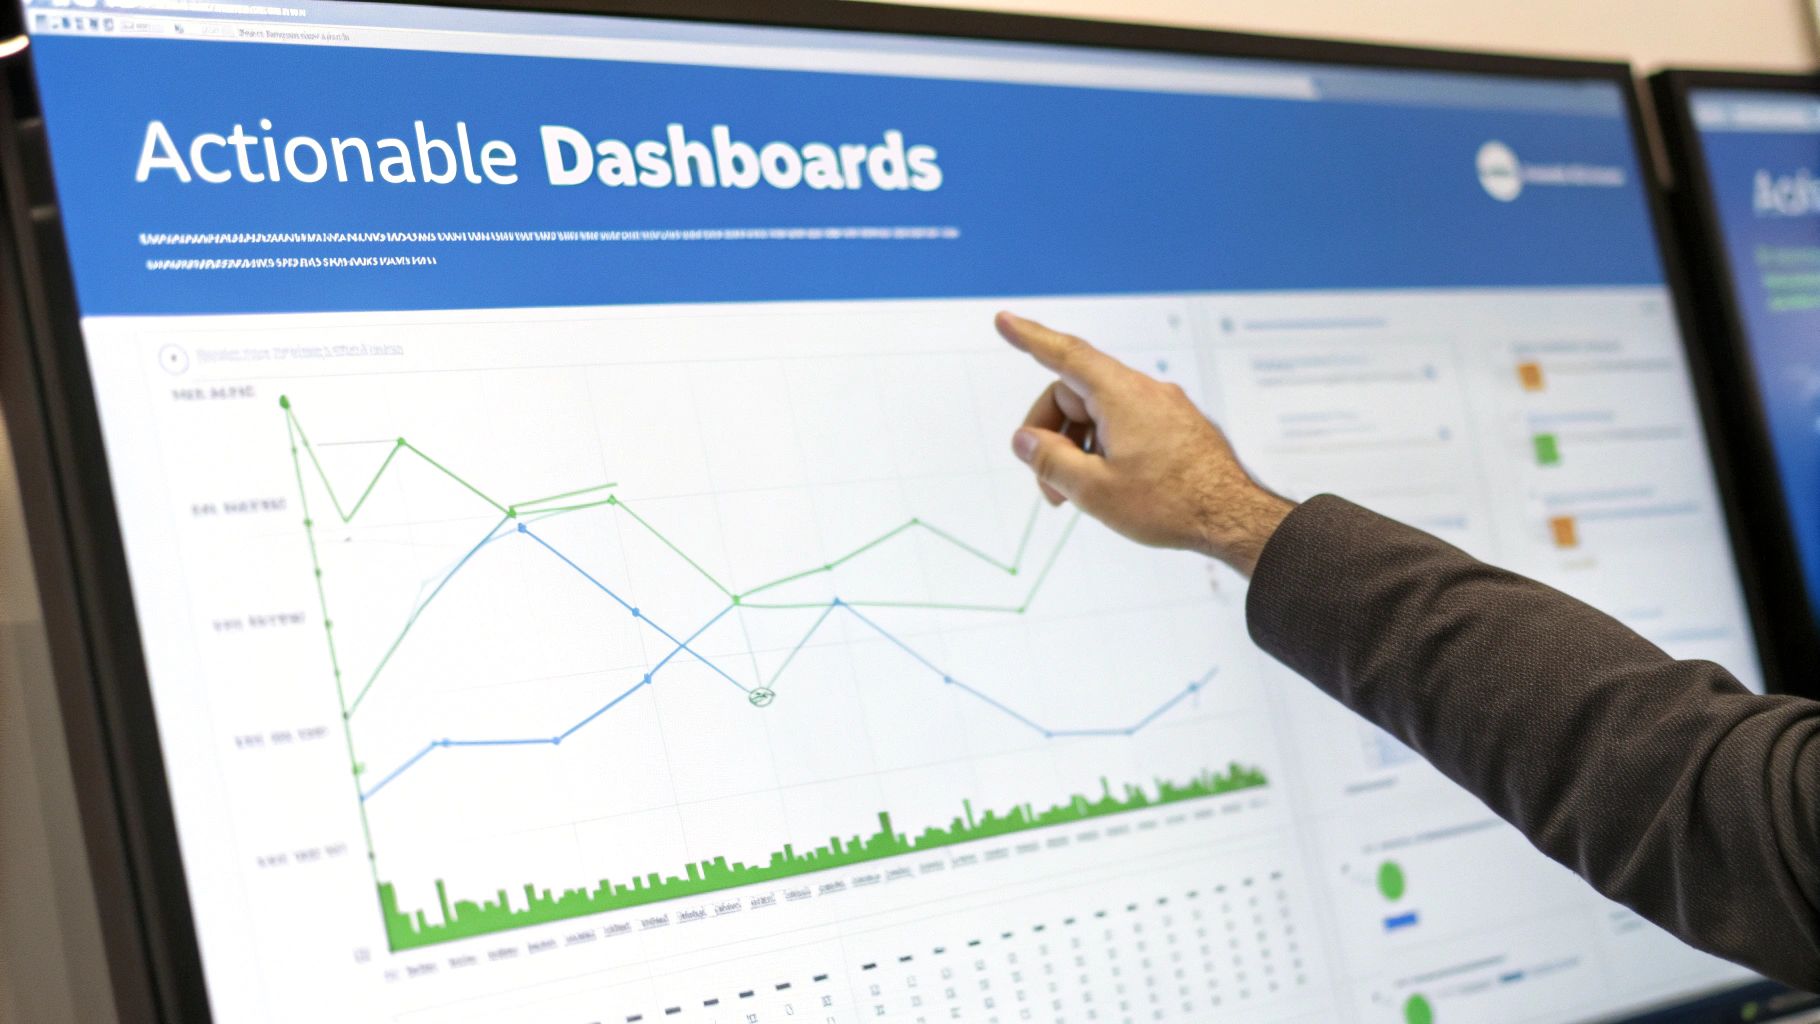
Tracking the right software development KPIs is only half the battle. Raw data is just noise. Its real power is unlocked when you turn it into a compelling story with effective dashboards. The goal isn’t just to report numbers, but to create visualizations that give you clear, actionable insights at a glance.
A one-size-fits-all dashboard rarely works. Different people need different levels of detail to make smart decisions. An executive wants a high-level view of business impact, while an engineering team needs granular data to fix specific process bottlenecks.
Designing Dashboards for Different Audiences
To make data truly useful, you have to tailor your visualizations. Always ask: who is this for, and what questions are they trying to answer?
- For Executives: Keep it focused on the big picture. Highlight trends in delivery velocity, product quality, and the business impact of your engineering work. Simple charts showing progress against strategic goals are perfect here.
- For Team Leads and Managers: Get a bit more tactical. Dashboards should center on team-level metrics like Cycle Time, Change Failure Rate, and Work-in-Progress (WIP) limits. This helps them manage workflow and spot problems before they escalate.
- For Developers: Create views that fuel continuous improvement. Show metrics tied to the code review process, PR size, and deployment frequency. This empowers the team to own their process and find ways to get better. For a deeper dive, check out our guide on building a software quality metrics dashboard.
Avoiding the Most Common KPI Pitfalls
Even with beautiful dashboards, a well-intentioned KPI strategy can go completely off the rails. It’s shockingly easy to misinterpret or misuse metrics, leading to behaviors that actively hurt team culture and productivity. Knowing the common traps is the first step to avoiding them.
The moment a metric is used to judge individual performance, its value as an improvement tool is destroyed. Teams will inevitably start to game the system, optimizing for the number instead of the outcome it represents.
To keep your KPI program healthy and productive, watch out for these pitfalls:
- Weaponizing Metrics in Reviews: Never, ever tie KPIs directly to individual performance appraisals. Use them to start team-level conversations about the process, not to rank or blame people.
- Ignoring the Context: A spike in Cycle Time isn’t automatically a bad thing. It could mean the team was tackling a complex, high-value project. Always ask “why” before you jump to conclusions.
- Focusing on Snapshots Over Trends: A single data point tells you almost nothing. The real insights come from watching trends over weeks and months. That’s how you see your team’s real trajectory and the impact of any changes you make.
- Creating a “Surveillance” Culture: Dashboards should be a transparent tool for everyone, not a secret management report. When metrics are open and owned by the team, they build collaboration and trust.
By designing audience-specific dashboards and steering clear of these common mistakes, you can build a measurement culture that fuels genuine, sustainable improvement.
Common Questions About Software Development KPIs
Jumping into the world of software development KPIs always brings up a few practical questions. Whether you’re just getting started or fine-tuning your current setup, getting straight answers to these common concerns can make all the difference. Let’s tackle the ones we hear most often.
How Many KPIs Should We Track at Once?
It’s tempting to want to measure everything, but that’s a surefire path to analysis paralysis. A much better approach is to start with just 2-3 high-impact KPIs that tie directly to your team’s most pressing goals.
For instance, if speeding up delivery is your number one priority, you’d zero in on Cycle Time and Deployment Frequency. Once your team gets comfortable using these and you’re seeing tangible benefits, you can think about adding another. This keeps everyone focused and ensures each metric actually drives action.
How Often Should We Review Our KPIs?
The right review cadence really depends on the metric itself. Some KPIs, like Deployment Frequency, offer great insights when you look at them daily or weekly to get a feel for the team’s rhythm. Others, like Change Failure Rate or Feature Adoption Rate, tell a more meaningful story when you analyze their trends over a month or even a quarter.
The real magic is in tracking trends, not just staring at single data points. A one-off spike in Cycle Time might just be a complex project. But a steady upward creep? That’s a signal of a real bottleneck you need to dig into.
Find a regular time to review the numbers together, like during team retros, and use that time to talk about what the data is telling you and decide on improvements as a group.
Can KPIs Be Gamed or Misused?
Absolutely, and it’s one of the biggest risks to watch out for. As soon as metrics are tied to individual performance reviews or used to pit teams against each other, people will naturally find ways to make the number look good—often at the expense of what actually matters. If a team is under pressure to crush its Change Failure Rate, they might just stop shipping risky (and innovative) features altogether.
To sidestep this, treat your KPIs as a tool for team-level improvement, not individual judgment. The goal is to build a culture where metrics spark curiosity and collaborative problem-solving. You’re trying to improve the system, not blame the people in it. When you keep the focus on process health, your software development KPIs become a powerful force for positive, lasting change.
Ready to slash your cycle times and deploy with confidence? GoReplay helps you validate changes against real production traffic, ensuring your reliability and performance KPIs are always on track. Discover how traffic replay can transform your testing process.