Soak Test Software: Find the Best Tools for Stability
Soak test software is a specialized type of tool built to run long-haul endurance tests on your applications. Its entire purpose is to uncover those sneaky, hard-to-find stability issues like memory leaks and resource degradation that only show up over time. The software puts your system under a consistent, moderate workload for an extended period—often 24 to 48 hours—to make sure it can run reliably without crashing or slowing to a crawl.
What Is Soak Testing and Why It Matters

Think about training for a marathon. You wouldn’t just do a few quick sprints and declare yourself ready for race day. The real test is maintaining a steady pace over a very, very long distance. Soak testing brings that exact “marathon” mindset to your software, revealing how it holds up not just under short bursts of pressure, but over time.
While other performance tests are sprints, soak testing is the ultimate endurance run. Its main goal is to verify that your system remains stable and performs well under a continuous, realistic load for a long, long time. This approach is specifically designed to catch those subtle, slow-burning problems that other tests will completely miss.
Uncovering Hidden System Weaknesses
The real magic of a soak test is its ability to expose time-dependent bugs. These are the kinds of issues that never pop up in a 15-minute load test but can bring a production server to its knees after running for 12 hours straight.
Here are the key problems that soak tests are brilliant at finding:
- Memory Leaks: This is the classic soak test discovery. It’s what happens when an application slowly eats up more and more memory over time without ever releasing it, eventually leading to sluggish performance or a full-blown crash.
- Resource Exhaustion: Systems can run out of more than just memory. A good soak test will show you if your app is failing to release database connections, file handles, or other finite system resources.
- Performance Degradation: Does your application’s response time get progressively slower after hours of continuous use? Soak testing helps you pinpoint this kind of performance decay, which often points to underlying issues with caching, database queries, or connections to third-party services.
A system that aces a load test but fails a soak test is like a sprinter who can’t finish a 5k. It’s got short-term power but lacks the long-term stability needed to survive in the real world.
Differentiating Soak Testing From Other Tests
It’s easy to get soak testing mixed up with other types of performance testing, but their goals are very different. Load testing, for example, is all about seeing how the system handles an expected peak user load for a short burst. Stress testing pushes the system way past its limits to find its breaking point.
Soak testing, on the other hand, uses a normal, sustained load. The variable isn’t how much traffic you throw at it, but for how long. This focus on longevity makes it an absolutely essential step for any application that needs high availability—think e-commerce sites, financial platforms, or critical SaaS products. The insights you get from a proper soak test are invaluable for preventing costly downtime. You can learn more about the principles behind this in our detailed guide on software endurance testing.
As our reliance on “always-on” applications grows, soak testing has become a non-negotiable part of the quality assurance cycle. Unsurprisingly, the market for tools that support it is growing, too. The software performance testing market is on track to hit around USD 1.8 billion by 2033, a clear sign of the rising demand for truly stable and reliable applications.
When you’re running a marathon, you don’t wear flip-flops. The same logic applies to soak testing. While plenty of tools can throw a quick burst of traffic at your system, very few are built for the long haul—the kind of extended, realistic testing that uncovers slow-burning disasters.
Picking the right software means looking beyond basic load generation. You need a tool that understands the unique torture of a long-duration test, from handling complex user journeys to keeping sensitive data safe. Without these specialized features, you’re just guessing, and your tests will likely miss the very memory leaks or resource exhaustion issues you’re trying to hunt down.
High-Fidelity Traffic Replay
The best way to see how your system holds up over time is to hit it with traffic that looks just like the real thing. Scripts can fake simple actions, sure, but they completely miss the chaotic, unpredictable nature of a live production environment. This is where high-fidelity traffic replay changes everything.
This isn’t about simulating users—it’s about cloning them. By capturing and replaying actual production traffic, you preserve the exact timing, request sequences, and maddening complexity of real user interactions. The result is a test that’s far more authentic than any scripted scenario could ever be, giving you a true picture of how your system will fare under sustained, real-world pressure.
Session Awareness for Stateful Applications
These days, very few applications are stateless. Users log in, fill up a shopping cart, and follow multi-step wizards. A truly effective soak testing tool has to be session-aware, meaning it understands the entire context of a user’s journey, from the first click to the last.
A tool that isn’t session-aware is like trying to have a conversation with someone who forgets what you said every two seconds. It can’t replicate meaningful, stateful interactions, leading to tests that are shallow and unrepresentative of actual use.
Session awareness ensures that your replayed traffic correctly manages user sessions, cookies, and authentication tokens. This is non-negotiable for testing any application where user state is central—think e-commerce platforms, financial services, or any SaaS product.
Critical Security and Performance Features
Beyond just mimicking user behavior, the right tool has to grapple with the technical realities of modern web traffic. A few features are absolutely non-negotiable: data masking, proper TLS handling, and smart connection management.
-
Data Masking: Replaying production traffic means you’re handling real user data, and that can include names, emails, and even passwords. Strong data masking is vital for security and compliance (hello, GDPR). This feature automatically finds and redacts or replaces sensitive information before it ever touches your test environment, protecting privacy without killing test realism.
-
TLS/SSL Support: The vast majority of production traffic is encrypted, and your testing tool better be able to handle it. It needs to seamlessly capture and replay TLS/SSL encrypted traffic to test your full application stack, just as it runs in the wild.
-
Connection Pooling: Long-duration tests can open and close millions of connections, putting a massive strain on both the testing tool and the system under test. Connection pooling is a clever optimization that reuses existing connections instead of creating new ones for every single request. This drastically reduces overhead and makes sure the test itself doesn’t become the bottleneck.
Comprehensive Analytics and Reporting
At the end of the day, a soak test is only as useful as the story it tells you. Modern soak test software must have a powerful analytics dashboard that gives you deep visibility into performance over time. This means tracking key metrics like memory usage, CPU load, response times, and error rates.
The real magic is in visualizing these metrics on a timeline. That’s how you spot the slow, creeping degradation that defines a classic soak test failure. A clean, intuitive reporting interface helps you instantly see trends, pinpoint the exact moment performance started to dip, and ultimately find the root cause. Without that, you’re just swimming in data with no direction.
Before settling on a tool, it’s worth running through a checklist to see how it stacks up against the demands of serious, long-duration testing.
Soak Test Software Feature Evaluation Checklist
| Feature | Why It’s Critical | Look for in a Tool |
|---|---|---|
| Session-Aware Replay | Accurately mimics stateful user journeys (logins, carts), which is crucial for most modern applications. | Ability to maintain user sessions, cookies, and authentication state across multiple requests. |
| High-Fidelity Replay | Ensures test traffic reflects the true complexity and timing of real user behavior, not just scripted actions. | Captures and preserves original request timing, ordering, and payload complexity from a production source. |
| Robust Data Masking | Protects sensitive user data (PII) during testing, ensuring security and regulatory compliance (e.g., GDPR). | Automatic or rule-based redaction/replacement of sensitive fields within requests and responses. |
| Native TLS/SSL Support | Allows testing of the entire encrypted traffic flow as it exists in production, without workarounds. | Seamless capture and replay of HTTPS traffic without requiring decryption proxies or certificate hacks. |
| Connection Pooling | Prevents the testing tool from becoming a bottleneck by efficiently reusing network connections. | A feature that minimizes connection overhead for high-throughput, long-duration tests. |
| Detailed Analytics | Provides the visibility needed to detect slow performance degradation and identify root causes over time. | Time-series graphs for key metrics (CPU, memory, latency, errors) and clear reporting dashboards. |
This checklist isn’t exhaustive, but it covers the core capabilities that separate a basic load generator from a true endurance testing platform. The right tool won’t just generate load; it will give you the confidence that your system is ready for the long run.
Alright, let’s get into the nitty-gritty of running a soak test. Theory is great, but putting it into practice is where you really see the benefits. Knowing the what and why is the first step, but a successful execution comes down to having the right tool and a solid process.
This walkthrough will show you how to do just that using GoReplay, a fantastic open-source tool built specifically for capturing and replaying real production traffic. We’ll go from capturing live traffic without your users noticing a thing, all the way to replaying it against your staging environment for hours or even days.
Let’s turn this complex endurance test into a simple, repeatable process for your team.
Step 1: Capture Production Traffic
First things first, you need an authentic stream of traffic. The goal is to mirror what your application handles every single day, not just what a script thinks it handles. This is where GoReplay shines—it listens to network traffic directly from your production server without getting in the way or slowing anything down.
Think of it like placing a high-fidelity microphone next to your server. It passively records every incoming HTTP request and saves it to a file. This is worlds better than scripted tests because it captures the beautiful, messy, unpredictable nature of real user behavior—exactly what you need for a true soak test.
To kick things off, you’ll run a simple command on your production server. This tells GoReplay to start listening and save everything it hears.
Listen on port 80 and save traffic to a file
gor —input-raw :80 —output-file requests.gor That’s it. GoReplay is now quietly logging every request, creating a perfect recording of user interactions. This file becomes the foundation of your soak test. For a more detailed guide, check out the official docs on GoReplay setup for testing environments.
Step 2: Replay Traffic in a Staging Environment
Now that you’ve got a rich dataset of real user traffic, it’s time to replay it against a safe, isolated staging environment. This is where you really put your system through its paces. The whole point of a soak test is to run it for a long time, so you’ll set up GoReplay to loop the captured traffic over and over again.
The process boils down to three core stages: capturing real requests, replaying them against a test system, and making sure the whole thing is secure.
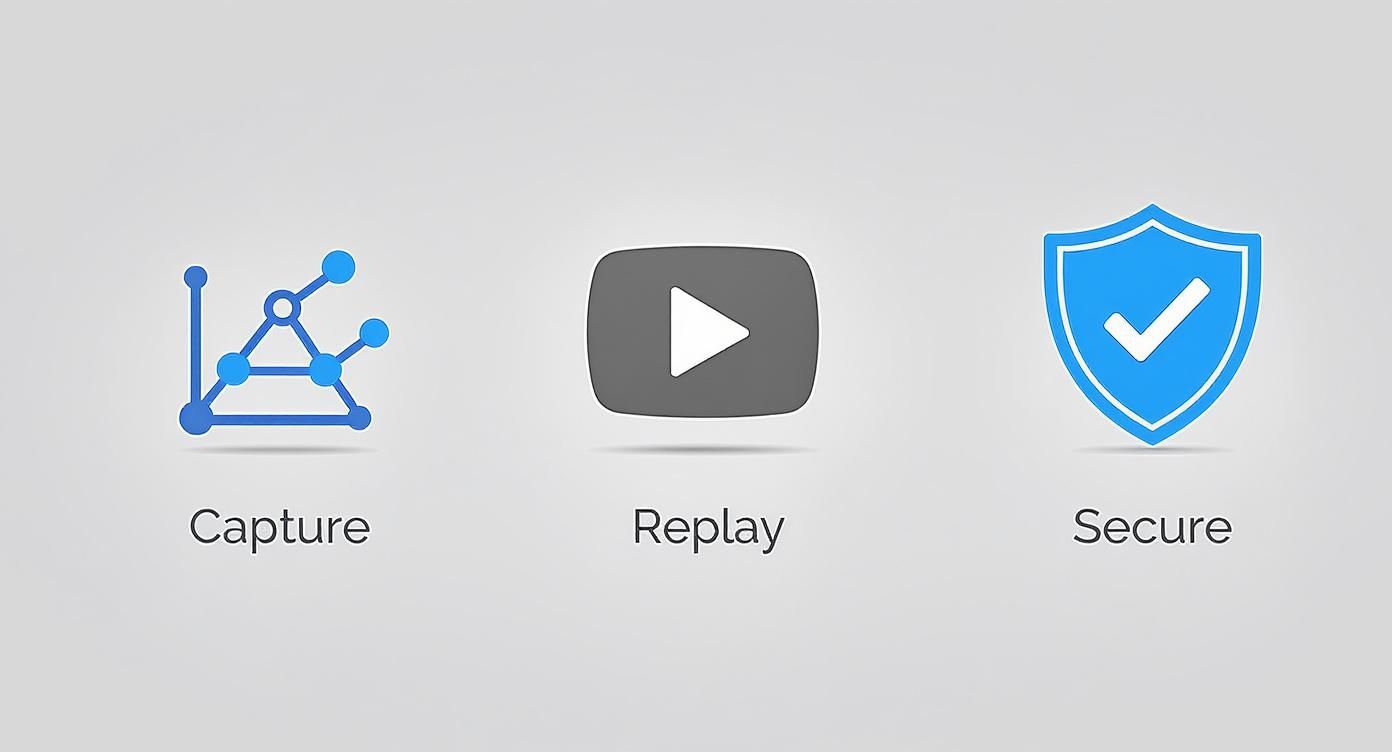
This flow shows how GoReplay turns raw production data into a powerful asset for rock-solid endurance testing.
To get the replay started, you’ll move that requests.gor file over to your testing machine and run another command. This one points the recorded traffic at your staging server, and you can even control the speed to match the exact load you want to test.
Replay traffic from the file to your staging server
gor —input-file requests.gor —output-http “http://staging.server” With that one command, the marathon begins. Your staging environment will start receiving a continuous stream of realistic traffic, simulating days of real-world activity in a much shorter timeframe.
Step 3: Monitor Key Performance Metrics
Running the test is just one part of the equation. The real insights come from what you observe while it’s running. During your soak test—whether it runs for 24, 48, or even 72 hours—you need to keep a close eye on a few key performance indicators (KPIs). Think of these as your application’s vital signs.
A soak test without monitoring is like running a marathon without a watch or a heart-rate monitor. You’re putting in the work, but you have no idea if you’re getting faster, slowing down, or about to hit a wall.
Here are the critical metrics you absolutely have to watch:
- Memory Utilization: This is the big one for spotting memory leaks. Watch for a slow, steady climb in memory usage that never levels off or drops back down. A healthy system’s memory should fluctuate but stay stable over the long haul.
- CPU Load: Some spikes are normal, but if you see a consistent upward trend in CPU usage, it could signal inefficient code or resource contention that only gets worse over time.
- Response Time: Keep tabs on both the average and 95th percentile response times. If these numbers start creeping up as the test goes on, your application is having trouble keeping up and you’ve likely found a bottleneck.
- Error Rate: A sudden jump in HTTP 5xx errors or other exceptions is a huge red flag. A stable app should keep a near-zero error rate under a consistent load.
Set up dashboards in your favorite monitoring tool—like Prometheus, Grafana, or Datadog—to visualize these trends throughout the test. Spotting these slow-burning issues is exactly why soak test software is such a critical part of any serious quality assurance strategy.
How to Analyze Soak Test Results
Running a soak test is only the beginning. The real discovery happens afterward, when you start digging through the mountains of data. A good test generates a ton of information, and your job is to find the story hidden in the numbers.
This is where you separate minor hiccups from genuine system fatigue. It means looking past simple pass/fail metrics to spot the subtle trends that signal long-term trouble. Good soak test software helps with clear visuals, but knowing what to look for is everything.
Identifying Key Indicators of System Fatigue
When you put a system under constant pressure for hours on end, things start to wear down. It might handle the first few hours just fine, but over time, fatigue sets in. You need to play detective and look for the clues that the system is getting tired. These clues often show up as slow, almost invisible changes that build up over the entire test.
Here are the primary indicators you need to track:
- Creeping Memory Usage: Is the app’s memory footprint steadily climbing without ever dropping back to a baseline?
- Degrading Response Times: Are API calls that took 50ms at the start now taking 150ms after 24 hours?
- Rising Error Rates: Are you seeing a slow but steady increase in HTTP 500 errors or other exceptions as the test drags on?
These are the classic signs of a system that can’t keep up over the long haul.
Spotting the Signature of a Memory Leak
The most common and notorious villain uncovered by soak tests is the memory leak. Think of a memory leak as a tiny, dripping faucet inside your application. One drop is nothing, but over hours or days, it can flood the whole system, causing sluggish performance and, eventually, a total crash.
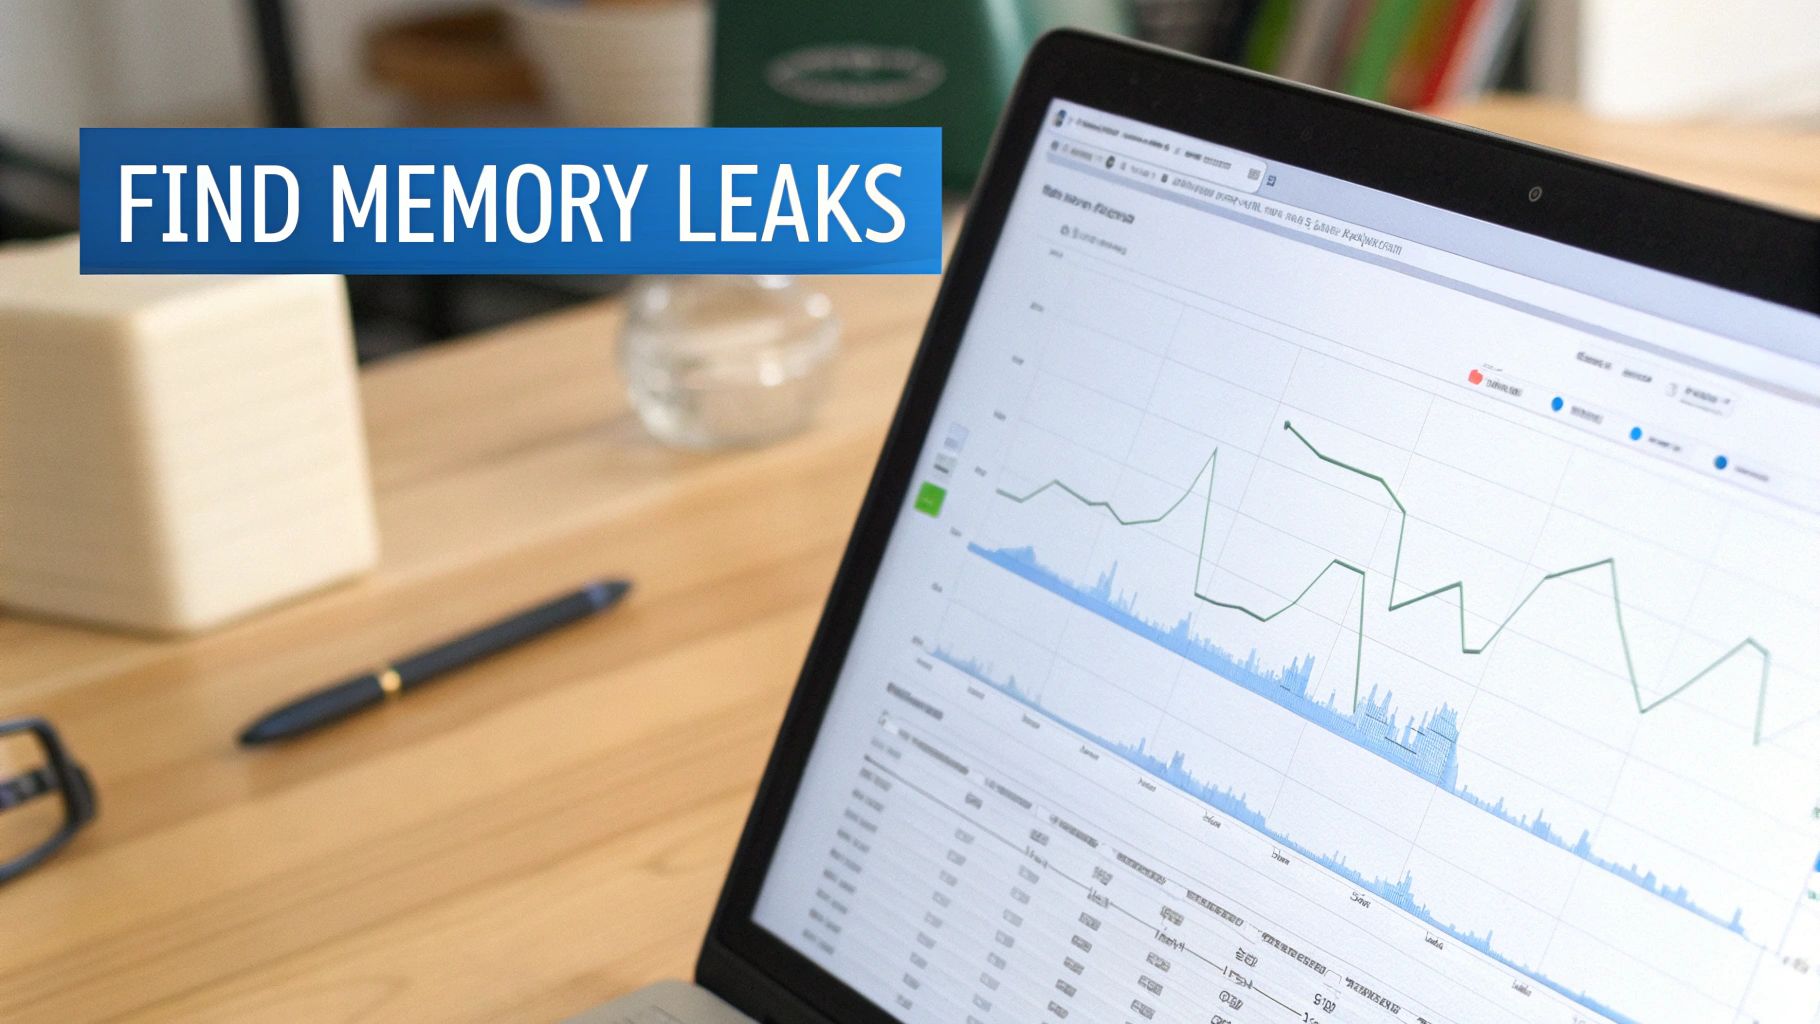
On a monitoring graph, the signature of a memory leak is impossible to miss. You’ll see a slow, steady, and relentless climb in memory consumption that never levels off. A healthy application’s memory usage should go up and down as it processes requests and garbage collection cleans up, but it always comes back to a stable baseline.
When you see a memory graph that looks like a mountain slope with no peak in sight, you’ve almost certainly found a leak. This pattern is the smoking gun that justifies the entire soak testing effort, as it’s a problem that shorter tests would never reveal.
Visualizing this trend is crucial. Use your monitoring tools to plot memory usage over the full test duration. That steady upward climb is the hard evidence you need to convince your dev team that a deep investigation is non-negotiable. Without this long-term view, these bugs often slip through the cracks until they take down production.
The growing complexity of software makes this kind of endurance testing more critical than ever. It’s why the broader software testing market is projected to grow from over USD 48 billion in 2025 to nearly USD 94 billion by 2030. This boom reflects the industry’s need for rigorous methods like soak testing to ensure applications can survive the marathon of continuous operation. You can dig into more data on this trend by reading the full market analysis from Mordor Intelligence.
Correlating Metrics for Root Cause Analysis
Finding a problem is only half the battle; the other half is figuring out where it’s coming from. A single metric, like rising memory, tells you what is happening but not why. The real key is to correlate multiple data points to uncover the root cause.
For example, if you notice response times start to degrade at the 12-hour mark, check what else was happening at that exact time. Did CPU usage also spike? Did a particular database query start timing out? By layering these metrics on the same timeline, you can connect the dots. This is how you move from just observing an issue to actually diagnosing it, making your soak test results truly actionable.
Automating Soak Tests in Your CI/CD Pipeline
Why treat soak testing like a rare, one-off event? Its true power is unlocked when it becomes a consistent, automated part of your development lifecycle. By integrating endurance tests directly into your Continuous Integration/Continuous Deployment (CI/CD) pipeline, you transform them from a reactive chore into a proactive quality gate.
This approach ensures that every significant code change is automatically vetted for long-term stability. Instead of discovering a memory leak weeks after a release, you can catch it just hours after the code is merged. This “shift-left” philosophy for endurance testing is a game-changer for maintaining high availability.
Triggering Tests Automatically in Staging
Modern CI/CD platforms like Jenkins, GitLab CI, and GitHub Actions make it straightforward to automate this process. The goal is to set up a workflow that automatically triggers a soak test in a staging environment after every successful deployment. This creates a reliable feedback loop for your development team.
Imagine a developer merges a major feature. The CI/CD pipeline runs unit tests, builds the application, and deploys it to staging. The final step? It kicks off a multi-hour soak test using your chosen soak test software. This ensures the new code doesn’t introduce subtle performance degradation.
This workflow might look something like this:
- Code Commit: A developer pushes new code to the main branch.
- Build & Deploy: The CI pipeline builds the application and deploys it to the staging server.
- Initiate Soak Test: A script in the pipeline uses a tool like GoReplay to start replaying a pre-captured traffic file against the staging environment.
- Run for Duration: The test runs for a defined period, such as 8 or 12 hours, simulating extended user activity.
Setting Up Smart Automated Alerts
An automated test is only useful if it tells you when something breaks. Manually checking dashboards isn’t scalable. Instead, the best practice is to configure automated alerts that notify your team when key performance thresholds are breached during a test.
This means integrating your monitoring tools with your alerting system (like Slack or PagerDuty). You can set specific rules to watch for the classic signs of system fatigue.
An automated alert is your system’s early warning signal. It’s the difference between finding a small problem at 3 PM on a Tuesday and having a catastrophic failure at 3 AM on a Saturday.
You should configure alerts for conditions such as:
- Memory Usage: Trigger an alert if memory consumption exceeds 80% and shows a consistent upward trend for over an hour.
- Response Time: Notify the team if the 95th percentile response time increases by more than 50% from the test’s baseline.
- Error Rate: Send an immediate high-priority alert if the HTTP 5xx error rate surpasses 1%.
This level of automation is becoming the industry standard, especially as cloud technologies add complexity. Market research shows that automated testing now represents over 55% of the total software testing market. The adoption of ‘Testing as a Service’ (TaaS), which often includes automated soak testing, grew by 27% in 2023 alone, driven by companies needing scalable testing solutions. You can find more insights on this trend from Technavio’s industry analysis.
By automating both the execution and the monitoring of your soak tests, you build a powerful safety net. This ensures that potential stability issues are caught early and consistently, long before they have a chance to impact your users and your reputation.
Frequently Asked Questions About Soak Testing
Diving into performance testing can feel like learning a new language. You’ve got terms that sound alike but mean totally different things. Let’s clear up the confusion with straightforward answers to the most common questions about soak testing.
What Is the Main Difference Between Soak Testing and Load Testing?
Think of it as a marathon versus a sprint.
Load testing is the sprint. You throw a high volume of users at your system for a short burst to see how it handles a specific peak load. The goal is to find performance bottlenecks right then and there.
Soak testing, on the other hand, is the marathon. It applies a moderate, steady load over a much longer period—we’re talking hours or even days. The goal isn’t to find the system’s breaking point from a traffic spike, but to test its endurance. This long-haul approach is the only way to uncover sneaky, time-dependent bugs like memory leaks that would never show up in a shorter test.
How Long Should a Soak Test Run?
The right duration really depends on your application, but a good rule of thumb is to run it long enough to cover at least one full business cycle.
For most applications, a 24 to 48-hour run is a solid standard. That’s usually enough time for those slow-burning issues to surface. If you’re just getting started, even a 12-hour run can be a fantastic baseline to check for obvious long-term problems and get a feel for your system’s stability. The key is giving your system enough time to settle so you can see real performance trends emerge.
The best soak tests run long enough for small, insignificant drips to become a noticeable flood. A one-hour test might show a perfectly healthy system, but a 24-hour test can reveal the critical memory leak that was destined to take down production.
Can I Use Production Traffic for Soak Testing?
Yes, and you absolutely should. Using real production traffic is the gold standard for realistic testing. It’s the only way to replicate the complex, unpredictable, and sometimes chaotic behavior of your actual users. No synthetic script can ever match it.
When you use real traffic, you’re testing against the actual patterns and edge cases your application sees every day.
Tools like GoReplay are built specifically to capture this live traffic and replay it safely in a test environment. The number one thing to get right here is data privacy. Your soak test software must have strong data masking features to automatically find and anonymize sensitive user information before it ever hits your testing pipeline. This way, you get all the realism without compromising user privacy.
What Are the Most Common Issues Uncovered by Soak Testing?
Soak tests are brilliant at catching the sneaky problems that other performance tests completely miss. By focusing on endurance instead of peak load, they expose weaknesses that only show up over time.
Here are the usual suspects:
- Memory Leaks: The classic soak test discovery. An application fails to release memory it no longer needs, slowly eating up available RAM until performance degrades and the system eventually crashes.
- Resource Exhaustion: It’s not just memory. Applications can also run out of database connections, file handles, or thread pools that aren’t being properly released after use.
- Performance Degradation: This is when response times get progressively slower as the test runs on. It often points to problems with caching, inefficient database queries, or trouble with a third-party service integration.
- Third-Party Service Failures: Extended, continuous communication with external services can reveal instability or rate-limiting issues that shorter tests would miss, causing your application to fail.
Ready to run soak tests with the realism of actual production traffic? GoReplay gives you the tools to capture, replay, and analyze real-world user behavior, helping you build more resilient and reliable applications. Find out how GoReplay can transform your testing strategy at https://goreplay.org.