A Guide to Server Performance Monitors
Server performance monitors are the tools that track the health and efficiency of your digital infrastructure. They give you the critical data needed to squash downtime and keep your user experience snappy. Think of it as a live dashboard for your server, showing you exactly what’s happening so you can spot and fix problems before they ever reach your customers.
Why Server Performance Monitoring Is Non-Negotiable

Imagine your server is the engine powering your website or app. Just like a car’s dashboard gives you crucial info on speed, fuel, and engine temp, server performance monitors provide a constant stream of data about your system’s health. Without that visibility, you’re driving blind, completely unaware of trouble until you’re stranded on the side of the road.
This kind of proactive oversight is the backbone of any reliable digital service. A sick server isn’t just a technical glitch—it creates real, and often severe, business consequences.
The Real-World Impact of Poor Server Health
When a server slows down or dies, the effects ripple outward. A sluggish e-commerce site means abandoned carts and lost sales. A lagging internal app grinds employee productivity to a halt. The end result is always the same: frustrated users and a damaged brand reputation.
Good server monitoring flips the script from reactive to proactive. Instead of scrambling to fix a crash after it happens, you can catch the warning signs—like a sudden memory spike or a disk getting full—and deal with them before they turn into major outages.
“A single hour of server downtime costs $300,000 on average for large enterprises. Proactive monitoring isn’t just an IT task; it’s a critical business function that directly protects revenue and customer trust.”
This shift is everything for maintaining a high-quality user experience and keeping the lights on. By keeping a close watch on performance, you guarantee your services stay fast, reliable, and available when people need them.
The Evolution of Monitoring
Monitoring itself has come a long way. The old-school methods were often just simple, periodic pings to see if a server was online—the digital equivalent of checking for a pulse. Today’s modern server performance monitors are light-years ahead, offering deep, real-time insights into every corner of your infrastructure.
This growth reflects a much bigger industry trend. As businesses rely more and more on complex IT systems, the global server monitoring tool market is exploding. Between 2025 and 2033, this market is projected to grow at a compound annual growth rate (CAGR) of around 15%. You can find more insights about this market growth on datainsightsmarket.com.
The message is clear: in a digital-first world, you can’t afford to guess about your server’s health.
The Four Pillars of Server Health
To really get a handle on server performance, you need to know what you’re looking at. While modern tools can throw hundreds of metrics at you, they all boil down to four fundamental pillars. Get these right, and you’re golden. Get one wrong, and you’re flying blind.
Think of your server as a chef in a ridiculously busy kitchen. Its performance isn’t just about one thing; it’s about how well it juggles everything at once. Ignoring one of these pillars is like a doctor checking your heart rate but ignoring your blood pressure—you’re missing a huge piece of the puzzle.
Let’s break down these four critical areas with some simple analogies.
The Four Pillars of Server Monitoring Explained
This table gives you a quick rundown of the core metrics, what they actually measure, and why they’re so critical for keeping your servers happy and healthy.
| Pillar | What It Measures | Analogy | Why It’s Important |
|---|---|---|---|
| CPU Usage | The percentage of processing power being used. | The server’s brainpower. | An overworked brain (high CPU) leads to slow responses and bottlenecks. |
| Memory (RAM) | How much short-term workspace is occupied. | The chef’s cutting board. | Not enough workspace causes “thrashing,” killing performance. |
| Disk I/O | The speed of reading/writing to long-term storage. | The pantry access speed. | Slow access means the CPU is stuck waiting for data, even if it’s idle. |
| Network | The amount of data moving in and out of the server. | The kitchen’s delivery highway. | A congested highway means requests and responses get stuck in traffic. |
Each pillar tells a different part of the story. You need all four to understand what’s really happening under the hood and solve problems before they impact your users.
CPU Usage: The Brainpower
The Central Processing Unit (CPU) is your server’s brain. It’s what executes instructions, crunches numbers, and processes every single request. CPU usage simply tells you how hard that brain is working, usually as a percentage.
Imagine the CPU as a brilliant mathematician. If they’re constantly working at 90-100% capacity, they’re completely swamped. New problems (requests) have to wait in line, which translates directly to slow application response times and a sluggish user experience. This is a classic bottleneck—the server just can’t think fast enough.
On the flip side, a CPU that’s always bored and idle might mean you’ve over-provisioned. You could be paying for a supercomputer when all you really need is a calculator. Good monitoring helps you find that sweet spot.
Memory Utilization: The Short-Term Workspace
If the CPU is the brain, then memory (RAM) is its desk or workspace. It’s where the server keeps all the data and applications it needs right now for quick access. Memory utilization tracks how much of that desk space is currently in use.
A server without enough memory is like a chef with a tiny cutting board. They can only prep one ingredient at a time, constantly having to put things away to make room for something else. This constant swapping of data between fast RAM and the much slower disk is called “thrashing,” and it can bring a server to its knees.
A particularly nasty issue that monitoring helps catch is a memory leak. This is when a faulty application grabs memory but never gives it back, slowly eating up the entire workspace until the server crashes.
Watching your memory usage ensures your server has enough elbow room to work efficiently without constantly running back to the filing cabinet (the disk).
Disk I/O: The Filing Cabinet Speed
Disk Input/Output (I/O) measures how fast the server can read from or write to its long-term storage—the hard drive or SSD. Think of this as how quickly your chef can grab ingredients from the pantry.
High disk I/O latency means the pantry door is stuck or everything is disorganized. The server’s brain (CPU) might be ready to go, but it’s just sitting there, waiting for data. This is a notorious performance killer for database servers or any application that juggles large files. You’ll see it as long page load times or delayed queries, even when CPU and memory look perfectly fine.
A good monitoring tool will track key disk metrics like:
- Read/Write Speeds: How fast is data moving?
- Queue Length: How many requests are waiting for the disk?
- Latency: How long does each read or write take?
Network Throughput: The Communication Highway
Finally, network throughput is the server’s connection to the outside world. It measures the data flowing in and out over the network. It’s how the server sends a webpage to a user and gets their next request back.
If the network is a highway, then too much traffic causes a jam. When the connection is saturated, data packets get delayed or even dropped. The result? Slow-loading pages, interrupted downloads, and frustrated users. This is especially critical for web servers and streaming services.
Monitoring network throughput helps you figure out if a slowdown is the server’s fault or if the problem is its connection to the internet. It answers the crucial question: Is my app slow, or is the highway just too clogged to handle the traffic?
Comparing Server Monitoring Architectures
Not all server performance monitors are built the same; how they gather data is a fundamental design choice. Getting this right is key to picking a tool that fits your specific needs for security, resource impact, and data detail. This one decision shapes how the entire monitoring system interacts with your infrastructure.
Think of it like this: an athlete could have a live-in doctor tracking every heartbeat or a specialist who just runs remote check-ups. Both assess health, but with totally different levels of access and intrusiveness. The two big architectural choices come down to deployment (agent-based vs. agentless) and data collection (push vs. pull).
Agent-Based vs. Agentless Monitoring
The biggest fork in the road is whether a small piece of software—an agent—gets installed on each server.
An agent-based approach is like having a spy on the inside. This little program runs right on the server, giving it deep, direct access to the operating system and any running applications. It can grab incredibly detailed, real-time metrics that an external tool could never hope to see.
On the other hand, an agentless approach acts more like a remote inspector. This model pulls data from outside the server, usually with standard protocols like SNMP or WMI. It’s far less intrusive and a breeze to roll out across a huge fleet of servers since there’s no software to install and manage on every single machine.
It really boils down to a trade-off. Agent-based monitoring gives you incredible data depth but adds a bit of resource overhead. Agentless monitoring is simple and lightweight but might not give you the granular insights you need.
So, what’s your priority? If you’re hunting down complex application bugs, the deep-dive view from an agent is priceless. But if you’re managing a sprawling, mixed environment and just need broad visibility with minimal fuss, an agentless tool is probably the more practical choice.
The infographic below shows what these architectures are trying to track—the core pillars of server health like CPU, memory, disk, and network.
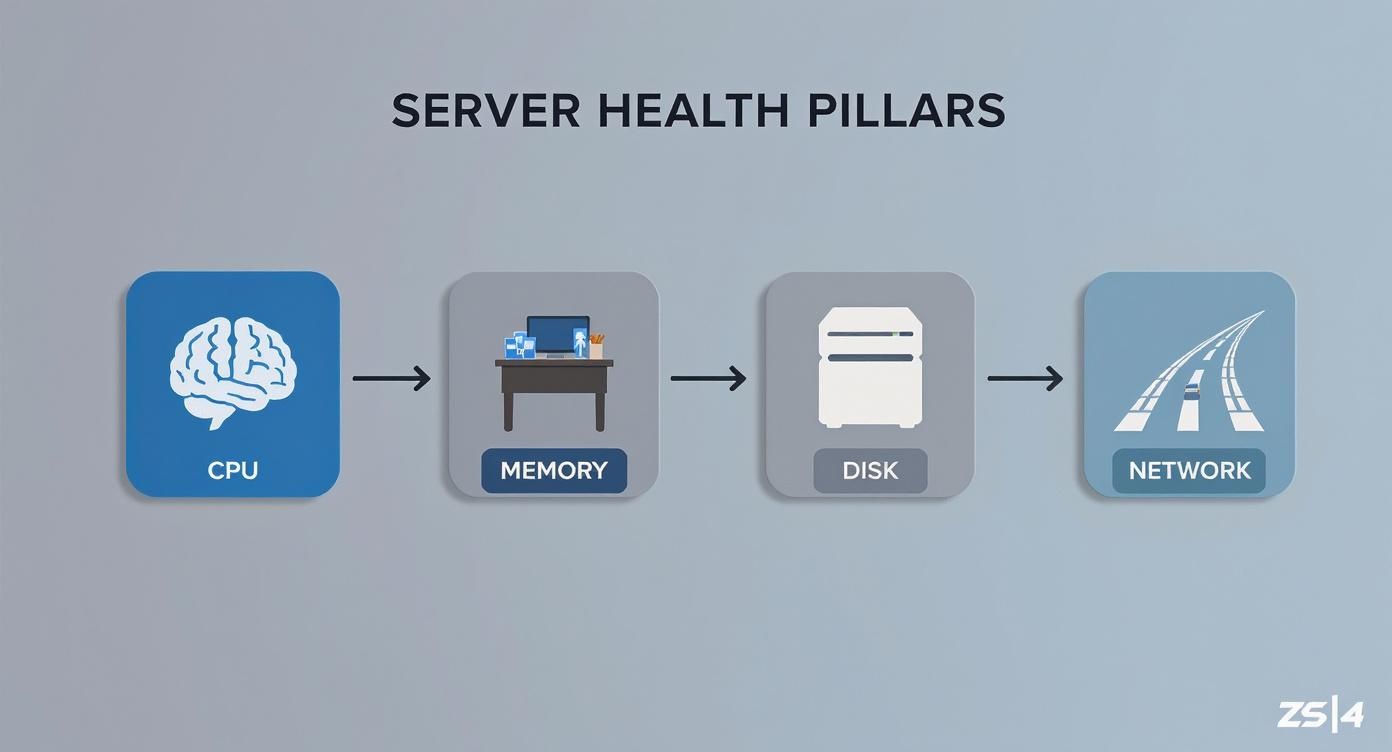
This just drives home how interconnected server resources are, which is why your data collection method—whether it’s from an internal agent or an external probe—is so crucial for getting the full picture.
The Push vs. Pull Collection Models
After deciding on an agent, the next question is how the data gets back to your central monitoring system. This is where the push and pull models come into play.
A push model is where the server (or its agent) actively sends—or “pushes”—its performance data to the central monitoring server on a schedule. Think of it as each server proactively reporting its status. This works great for dynamic environments where servers spin up and down, as they can just announce themselves and start sending data right away.
In a pull model, the central monitoring server “pulls” the data by actively pinging each server for its latest metrics. It’s more like a command center checking in on each unit. This gives you centralized control over how often data is collected and is often easier to lock down from a security standpoint, since all connections start from one trusted place.
Here’s a quick breakdown:
| Model | Data Flow | Best For | Key Advantage |
|---|---|---|---|
| Push | Server → Monitor | Dynamic, cloud environments | Scalability and flexibility |
| Pull | Monitor → Server | Stable, on-premise setups | Centralized control and security |
The explosive growth in this space shows just how critical this kind of operational intelligence has become. The global data center monitoring market was valued at about USD 1.95 billion in 2024 and is expected to hit USD 11.43 billion by 2034, growing at a CAGR of roughly 19.3%. This surge is all about the demand for real-time visibility and AI-driven maintenance. You can learn more about these data center market trends from Precedence Research.
How to Choose the Right Monitoring Tool
Picking the right server performance monitor isn’t about finding a single “best” tool. It’s about finding the one that fits your specific ecosystem like a key in a lock. The market is packed with options, and each one has its own set of strengths and weaknesses. Making the right choice means getting crystal clear on your technical needs, operational workflows, and business goals.
Think of it like choosing a vehicle. A sports car is thrillingly fast, but totally useless for hauling lumber. A semi-truck can carry a massive load, but it’s complete overkill for a quick trip to the grocery store. In the same way, a monitoring tool built for a massive enterprise is probably too complex and expensive for a small startup, while a simpler tool won’t give a larger organization the depth it needs. The goal is to find that perfect balance.
The explosive growth in this space tells a story about the complexity modern teams are dealing with. The server management software market, which includes many server performance monitors, was valued at around USD 6.4 billion in 2025 and is projected to nearly double to USD 13.0 billion by 2035. This surge is all about the need for platforms that can actually keep up with modern IT infrastructure. You can discover more insights about server management software on futuremarketinsights.com.
Core Evaluation Criteria
To cut through the noise, you need to focus your evaluation on four key criteria. These pillars will help you build a decision-making framework that lines up a tool’s capabilities with what you actually need, ensuring you invest in a solution that empowers your team, not complicates their lives.
- Scalability: Can the tool actually grow with you? A monitor that works beautifully for five servers might just crumble under the load of 500. You need to ask vendors about their architecture and how it handles a serious increase in data volume and server counts.
- Integrations: A monitoring tool can’t be an island. It absolutely has to connect seamlessly with the stack you’re already using. Does it play nice with your alerting systems like PagerDuty or Slack? Can it pull data from your cloud provider and push insights into your project management tools?
- Ease of Use: How intuitive is the dashboard, really? A powerful tool is worthless if your team finds it too confusing to use day-to-day. Look for clean UIs, customizable dashboards, and clear documentation that shortens that painful learning curve.
- Cost and Total Cost of Ownership (TCO): The price tag is just where the story begins. You have to consider the TCO, which includes licensing fees, implementation time, training costs, and ongoing maintenance. Sure, an open-source tool might be “free,” but the engineering hours you’ll sink into maintaining it can be incredibly expensive. For a deeper dive, consider reviewing this guide on selecting the right enterprise monitoring solutions.
The Rise of AI and Proactive Monitoring
Modern server performance monitors are getting smarter. They’re increasingly using artificial intelligence and machine learning to shift teams from a reactive posture—fixing things after they break—to a proactive one. These advanced features analyze historical data to spot patterns and predict problems before they ever impact your users.
Instead of just screaming that CPU usage is at 95%, an AI-powered monitor might warn you that, based on current trends, your server is likely to hit critical capacity in the next two hours. This gives your team a real chance to act.
Here are a few key AI-driven features to look for:
- Anomaly Detection: Automatically flags unusual behavior that deviates from established baselines, catching potential issues that simple rule-based alerts would completely miss.
- Predictive Analytics: Forecasts future resource needs and potential bottlenecks, which is a massive help for capacity planning and preventing performance slowdowns down the road.
- Automated Root Cause Analysis: Sifts through mountains of logs, metrics, and traces to pinpoint the likely cause of an issue, slashing troubleshooting time from hours to minutes.
By asking the right questions and prioritizing the features that match your team’s operational maturity, you can pick a tool that not only shows you what’s happening right now but also helps you get ready for what’s coming next.
Validating Performance with Traffic Replay
Standard server performance monitors are fantastic at giving you a real-time picture of what’s happening on your servers right now. They’re essential for spotting issues as they happen. But what if you could stop just reacting to problems and start predicting them?
This is where the idea of traffic replay changes the game. It lets you proactively validate how your systems will hold up under very specific, very realistic conditions. Think of it as a crystal ball for your server’s performance.
Imagine you’re about to roll out a big code update. You hope it makes things better, but hope isn’t a strategy. Traffic replay closes the gap between hope and certainty, letting you test your changes against the messy, unpredictable reality of real user traffic—all inside a safe, controlled environment.
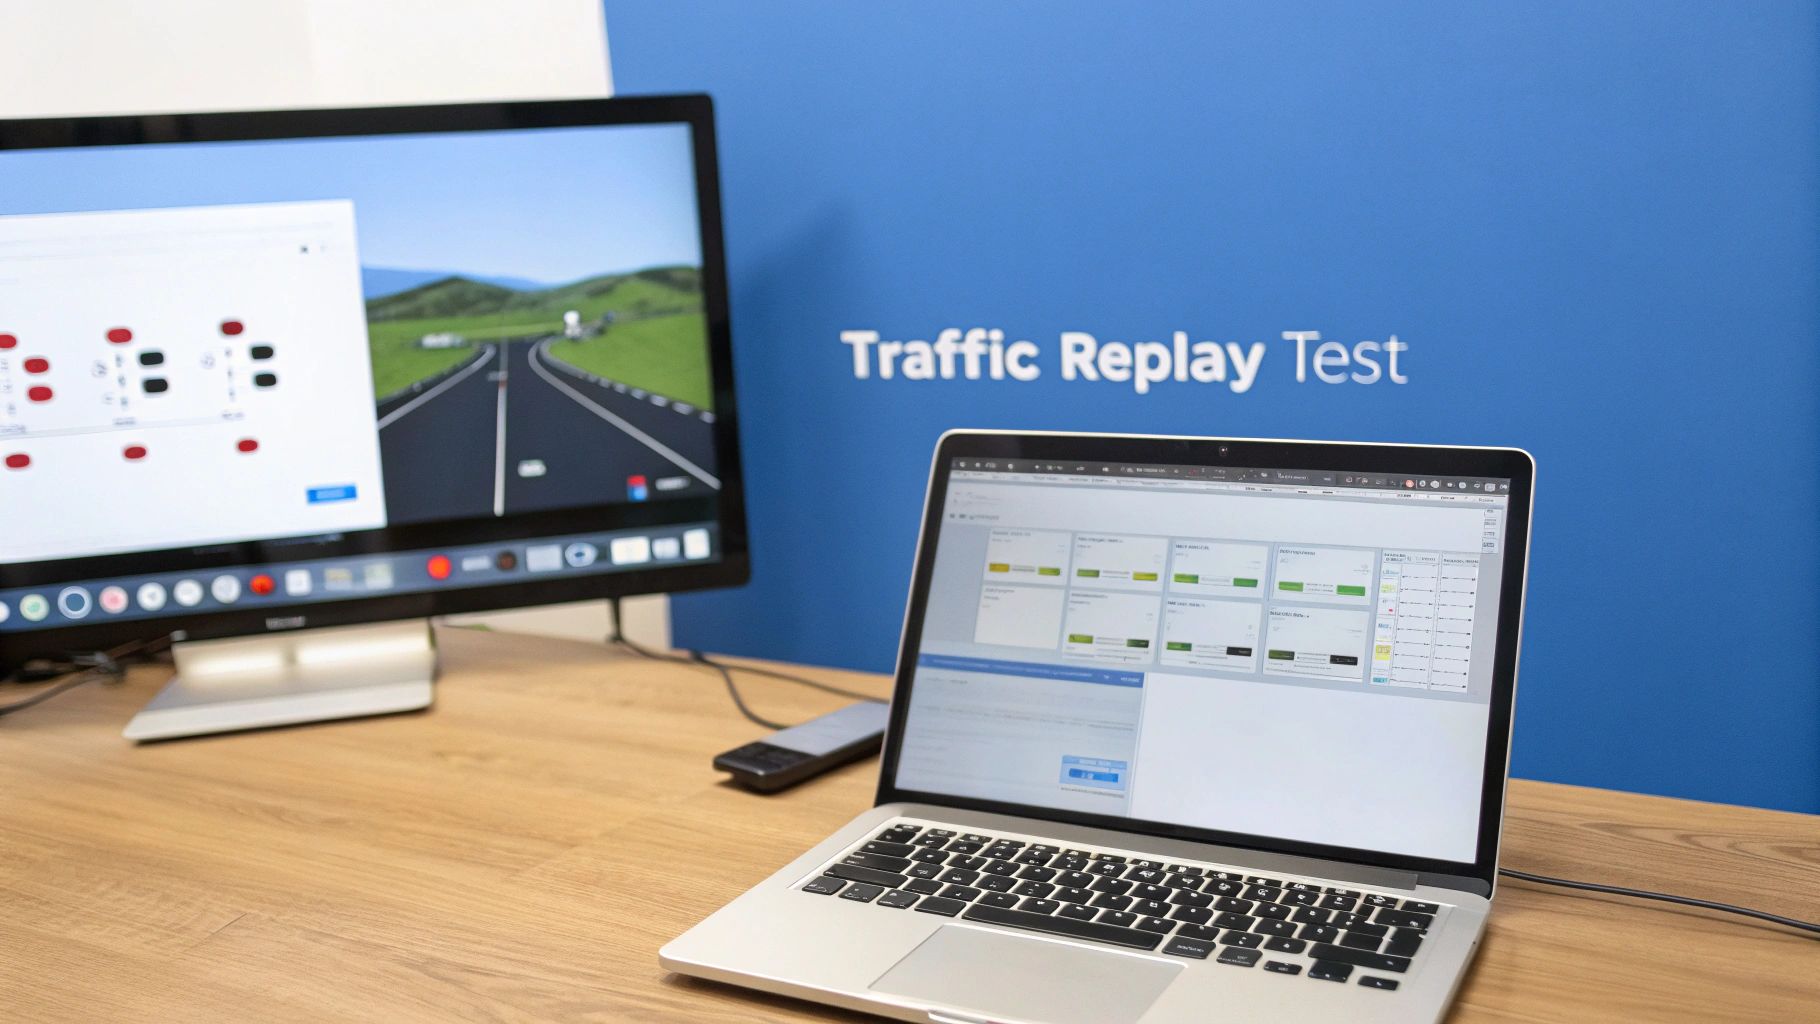
What Is Traffic Replay?
At its heart, traffic replay is simple: you capture real user traffic from your production environment and then “play it back” against a staging or test server. This isn’t your typical synthetic load test where scripts try to mimic users. This is the real deal—the genuine, chaotic, and complex patterns of your actual customers.
Tools like the open-source GoReplay are built for exactly this. They act like a VCR for your server, recording every HTTP request that comes in. Then, you can hit “play” and send that exact stream of traffic to any other environment you want.
Honestly, it’s the highest-fidelity load test you can get. You’re not guessing what users might do; you’re testing against what they actually did. For any team serious about performance, it’s an absolute game-changer.
Key Use Cases for Traffic Replay
Traffic replay isn’t some niche trick; it has practical uses that can seriously improve your development lifecycle and keep your services stable. By shifting from reactive monitoring to proactive validation, you catch problems long before they have a chance to see the light of day.
Here are a few of the most common ways teams put it to work:
- Catching Performance Regressions: A new deployment might ace all its unit tests but hide a subtle performance bug that only shows up under a real-world load. Replaying production traffic against the new code exposes these slowdowns immediately, before a single user is impacted.
- Accurate Capacity Planning: How do you really know if your servers can handle the traffic spike from that big marketing launch? Replay a past peak—or even amplify it—to find your infrastructure’s true breaking point and scale your resources with confidence.
- Verifying Optimizations: You just spent two weeks refactoring a slow API endpoint. Traffic replay lets you prove it worked. By comparing the old and new versions under the exact same load, you get scientific proof of the improvement.
By simulating real-world conditions, teams de-risk deployments and move faster with confidence. It transforms the question from “Will this break?” to “We know this won’t break.”
Integrating Replay with Your Monitoring Strategy
Here’s the thing: traffic replay doesn’t replace your traditional server performance monitors. It makes them better. The two work hand-in-hand to create a powerful performance engineering workflow. Your monitoring tools tell you what’s happening now, while replay tools help you understand what will happen next.
Here’s what that looks like in practice:
- Monitor Production: Your performance monitor flags a bottleneck—say, a CPU spike every day at 2 PM.
- Capture Traffic: You use a tool like GoReplay to capture the traffic from that specific peak period.
- Deploy a Fix: Your team codes a potential fix and pushes it to a staging environment.
- Replay and Validate: You replay that captured 2 PM traffic against the staging server, using the same monitoring tools to watch what happens.
- Compare and Confirm: By comparing the new metrics to the original ones, you can confirm with 100% certainty that your fix solved the problem under a realistic load.
This closed loop of monitoring, capturing, and replaying is the ultimate way to build stable, high-performance systems. If you’re ready to get started, a great first step is to learn how to replay production traffic for realistic load testing. This approach takes the guesswork out of performance and puts data firmly in charge.
Your Top Server Monitoring Questions, Answered
As you get your hands dirty with server performance monitoring, a few common questions always seem to come up. This section cuts right to the chase, tackling the big ones to clear up any confusion and get you ready for the real world.
Think of it as the final check-in before you go live. You know the mission, you’ve seen the intel, and you’ve picked your tools. Let’s iron out the last few details so you can deploy with confidence.
Monitoring vs. Observability: What’s the Difference?
This is easily one of the most common points of confusion. While “monitoring” and “observability” are often used together, they represent two very different ways of understanding your system. The difference is subtle but incredibly important.
Monitoring is all about watching for problems you already know can happen. You set up alerts for specific, predefined metrics—like, “let me know if CPU usage spikes above 90% for five minutes.” It’s fantastic at telling you when a known issue is occurring. It’s like a smoke detector in your house; it’s built to warn you about one specific, predictable problem.
Observability, on the other hand, is about arming yourself to understand problems you’ve never seen before. It gives you a rich, connected dataset of logs, metrics, and traces, allowing you to ask new questions and dig deep to figure out why something is broken. It’s less like a smoke detector and more like having the building’s blueprints, thermal cameras, and air quality sensors to investigate any strange event from any angle.
Monitoring tells you that a specific, known failure has happened. Observability gives you the tools to figure out completely new ways your system can break.
This matters because modern, complex systems fail in wild and unpredictable ways. Solid monitoring is your foundation, but true resilience comes from having the observability to troubleshoot the unknown.
How Much Overhead Do Monitoring Tools Add?
It’s a fair question—the act of measuring a system shouldn’t slow it down. The good news is that modern server performance monitors are designed to be extremely lightweight, but their actual footprint depends on a few things.
The overhead is directly tied to how much work the tool is doing. This is usually shaped by:
- Collection Frequency: How often is the agent gathering data? Checking every second uses more resources than checking every minute.
- Number of Metrics: Tracking thousands of granular metrics is naturally going to be more intensive than just watching the four core pillars.
- Architecture: Agent-based tools run right on your server, using a tiny slice of CPU and RAM. Agentless monitors have less impact on the server itself but can create more network chatter.
The goal is to find the sweet spot. You need enough data to see what’s going on, but not so much that you’re hurting the applications you’re trying to protect. Most commercial tools are highly optimized to have a minimal impact, often using less than 1-2% of a server’s resources.
Open-Source vs. Commercial Monitoring Tools
The “build vs. buy” debate is a classic for a reason. There’s no single right answer here—the best choice comes down to your team’s expertise, resources, and what you’re trying to achieve.
Open-Source Tools like Prometheus and Grafana are incredibly powerful and flexible. You can customize them to do just about anything. But that power comes with a steep learning curve. Setting up, integrating, and maintaining a full open-source stack requires serious DevOps skill and ongoing engineering hours. It’s like being handed a box of high-performance engine parts—you can build a race car, but only if you’re a master mechanic.
Commercial Tools offer a polished, all-in-one experience right out of the box. They usually have a simple setup process, unified dashboards, and dedicated support teams ready to help. For teams without specialized DevOps engineers, the convenience and support can be far more cost-effective in the long run. This is like buying a fully assembled car that comes with a warranty and a service plan.
This simple table might help you decide:
| Factor | Open-Source (e.g., Prometheus) | Commercial (e.g., Splunk, Datadog) |
|---|---|---|
| Initial Cost | Free (software license) | Subscription-based |
| Flexibility | Extremely high | High, but within the product’s limits |
| Setup & Maintenance | High effort, needs expertise | Low effort, vendor-supported |
| Support | Community forums | Dedicated, professional support |
| Best For | Teams with deep DevOps skills | Teams focused on speed and ease of use |
Ultimately, you have to think about the Total Cost of Ownership (TCO). Open-source software might be “free,” but you pay for it in engineer salaries and time spent on maintenance. For many businesses, a commercial tool delivers reliable monitoring faster and with a more predictable long-term cost.
Ready to move from monitoring to proactive validation? With GoReplay, you can capture and replay real user traffic to safely test your applications under realistic load. Stop guessing and start validating. Discover how GoReplay can de-risk your deployments today.