Boosting Business Performance With Robust Monitoring
In today’s fast-paced business world, maintaining peak performance is critical. Every millisecond counts, potentially translating into significant revenue gains or losses. Enterprise monitoring solutions provide the essential visibility needed to not only keep systems running, but also optimize them for maximum efficiency and profitability. These tools are no longer a luxury, but a necessity for organizations with complex IT infrastructures.
They help pinpoint performance bottlenecks, anticipate potential outages, understand user behavior, and optimize resource allocation.
Choosing the right enterprise monitoring solution can be challenging. The market is filled with numerous options, each with its own unique features and capabilities. Scalability, integration with existing systems (cloud, on-premise, hybrid), real-time alerting, data visualization, and pricing are all key factors to consider.
Key Considerations When Choosing a Solution
- Comprehensive Insights: An effective tool should provide a complete view across your entire IT stack—from applications and databases to servers and network infrastructure. This empowers you to proactively address issues before they impact your bottom line.
- Technical Considerations: Factors such as supported programming languages, deployment models (SaaS, on-premise), and API integrations are also crucial for seamless adoption and long-term value.
This guide explores the top 10 enterprise monitoring solutions of 2025, offering a detailed overview of their strengths and weaknesses. We’ll cover key features, pricing models (including free tiers and open-source options), and ideal use cases.
Whether you’re a software developer tracking down performance bottlenecks, a DevOps engineer striving for continuous delivery, a Quality Assurance specialist ensuring a smooth user experience, or a business leader looking to optimize ROI, this list will help you choose the perfect monitoring solution to elevate your business performance.
1. Datadog
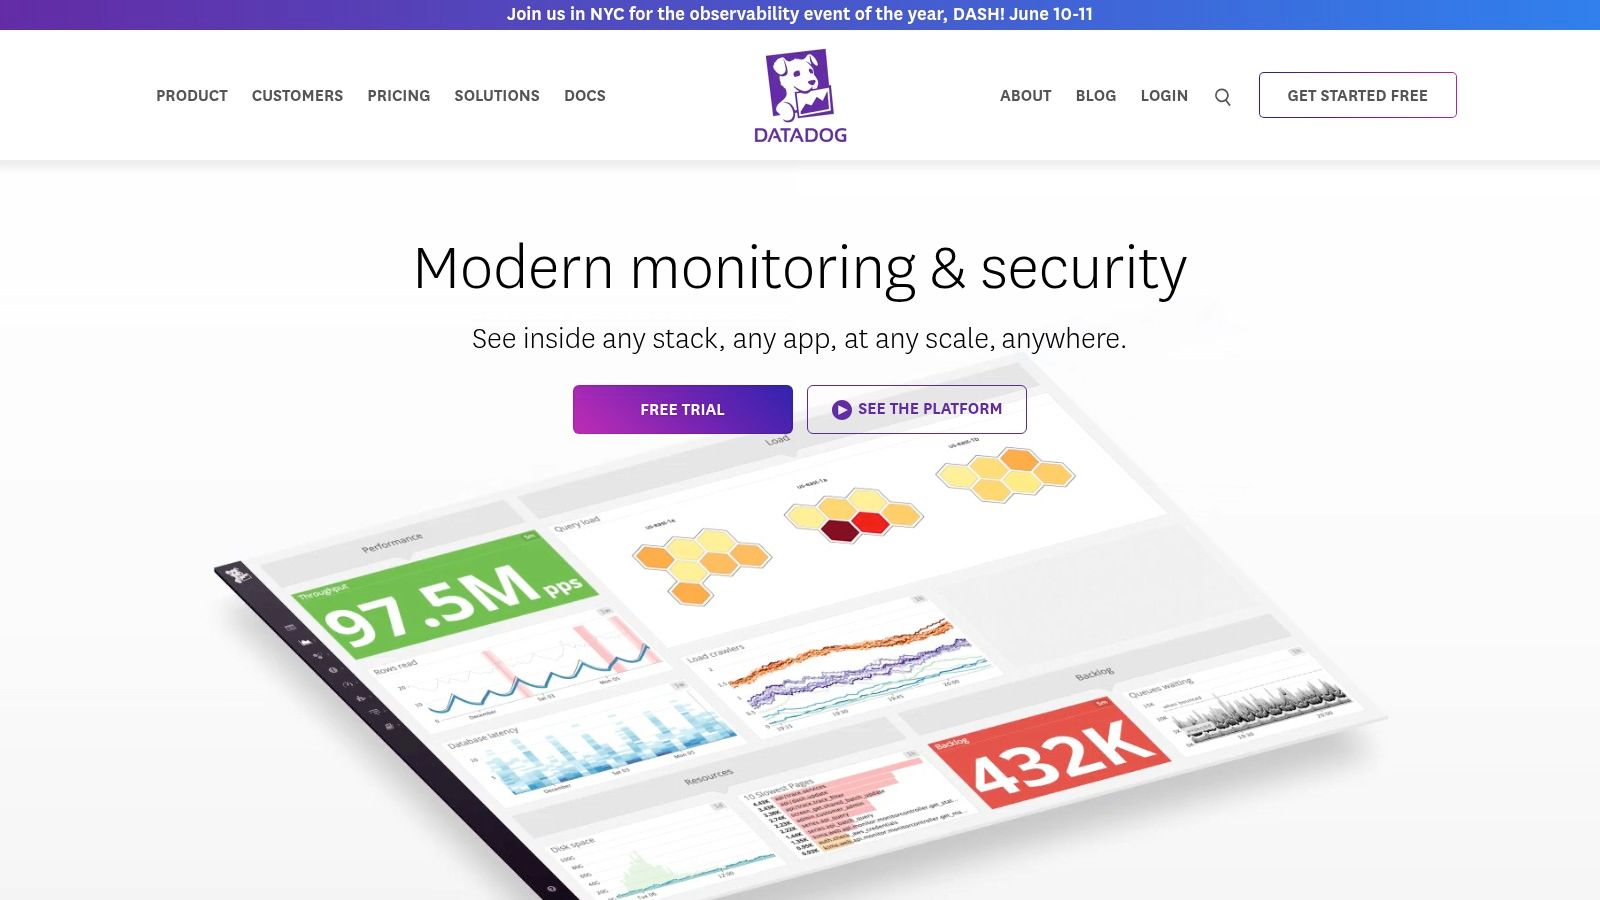
Datadog sits at the top of this list for a reason. Its comprehensive monitoring and security features provide full-stack observability for cloud-native applications. Think of it as a central hub for all your data. Metrics, traces, and logs flow in from across your entire infrastructure – servers, databases, containers, and cloud services – painting a complete picture of your technology stack’s performance and health. This empowers everyone, from DevOps and developers to business users, to understand how their systems are performing.
Whether you’re troubleshooting performance bottlenecks or hunting down security vulnerabilities, Datadog equips you with the tools to maintain peak application performance and a smooth user experience. A core strength of Datadog is its ability to connect the dots between different data sources.
Imagine a sudden spike in latency. Datadog can correlate this with specific application logs, infrastructure metrics, and even pinpoint the problematic line of code. This correlation dramatically reduces troubleshooting time and helps identify the root cause quickly. Plus, Datadog’s machine learning-driven anomaly detection proactively spots unusual patterns and potential issues before they affect your users.
Real-World Examples
For instance, imagine an e-commerce business bracing for the Black Friday rush. Datadog can help ensure optimal website performance by identifying potential bottlenecks in real time. SaaS companies can also use Datadog to monitor API performance, track error rates, and proactively identify performance degradations that could impact customers.
Datadog further simplifies monitoring with over 500 built-in integrations with common tools and services like Slack. This vast integration library lets you monitor virtually any component, regardless of vendor or technology.
Key Features
- Real-time Monitoring with Customizable Dashboards: Visualize key metrics relevant to your business needs through tailored dashboards.
- Full-Stack Observability: Gain a holistic view across your infrastructure, APM, logs, and network.
- Machine Learning-Based Anomaly Detection: Proactively address potential issues before they impact your users.
- 500+ Built-in Integrations: Seamlessly connect with your existing technology stack.
- Distributed Tracing and Service Maps: Visualize the flow of requests through your systems.
Pros and Cons
Pros:
- Comprehensive visibility across infrastructure, applications, and services.
- Powerful correlation of metrics, logs, and traces.
- Intuitive UI/UX and dashboards.
- Robust AI/ML capabilities for anomaly detection.
Cons:
- Can be costly for large deployments.
- Advanced features have a learning curve.
- Initial setup and configuration can be complex.
Website and Pricing
Website: Datadog
While Datadog offers its own robust features for testing purposes, including traffic replay, you might also want to explore other tools like GoReplay, which can complement your monitoring strategy. See: Our guide on Mastering Monitoring with GoReplay.
Pricing: Datadog uses a usage-based pricing model that depends on the features you use and the data ingested. Visit their website for specific pricing details.
Technical Requirements
As a cloud-based SaaS platform, Datadog doesn’t have specific hardware or software requirements beyond a web browser. However, installing Datadog agents on your servers and applications is necessary for data collection.
2. New Relic
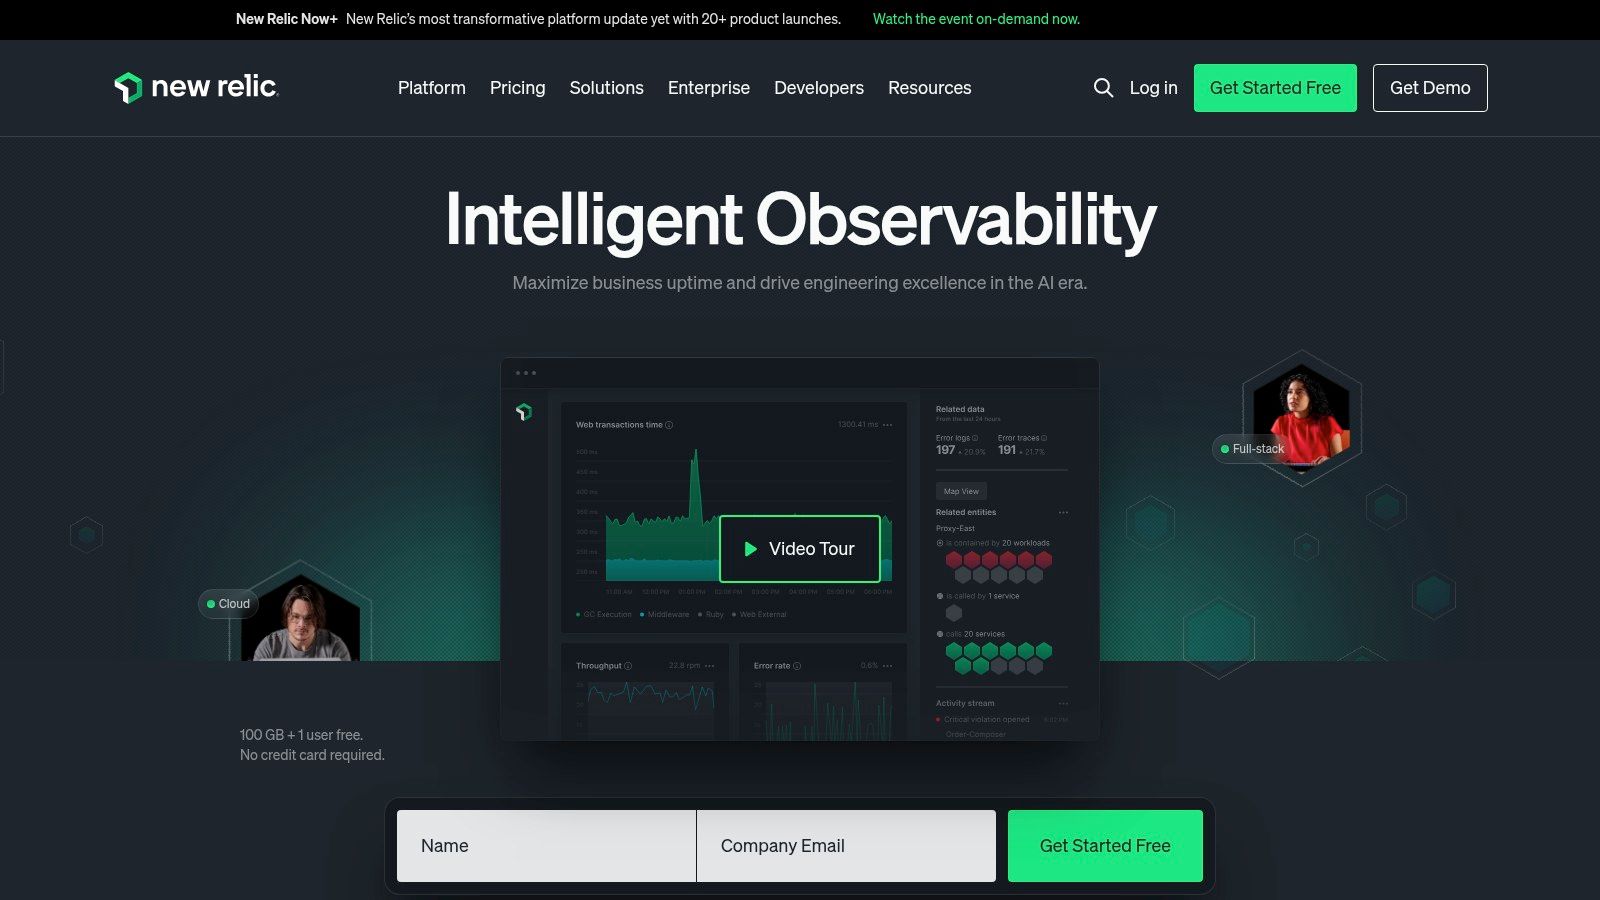
New Relic is a cloud-based observability platform providing comprehensive insights into your software stack’s performance and health. It consolidates crucial data, empowering engineering teams and business leaders to make informed decisions. From application performance monitoring (APM) and infrastructure monitoring to digital customer experience analysis, New Relic’s wide range of capabilities, unified platform, and focus on actionable insights make it a valuable tool.
Use Cases
Here are some ways New Relic can be integrated into your workflow:
-
Troubleshooting Performance Bottlenecks: Identify slow database queries, problematic code, and the root cause of performance issues impacting application responsiveness.
-
Optimizing Customer Experience: Monitor real-user interactions with your applications and websites to proactively address issues impacting customer satisfaction. Trace user journeys across platforms and pinpoint areas for improvement.
-
Proactive Incident Management: Use real-time alerts and anomaly detection to identify potential problems before they escalate. This proactive intervention minimizes downtime.
-
Infrastructure Health Monitoring: Get visibility into the performance and availability of your servers, containers, and cloud resources. Identify resource constraints and optimize infrastructure use.
-
DevOps Enablement: Facilitate collaboration between development and operations teams by providing a shared view of performance. This shared perspective streamlines troubleshooting and speeds up deployment.
Key Features and Benefits
New Relic offers a range of features and benefits:
-
Full-stack Observability: Get a holistic view of your entire software stack, from code to infrastructure, all within a single platform.
-
Applied Intelligence: Use AI-powered anomaly detection and correlation to proactively identify and resolve performance issues.
-
Real-time Alerting and Incident Management: Receive timely notifications about critical events and manage incidents with integrated workflows.
-
Custom Dashboards and Visualizations: Build custom dashboards to visualize key metrics and get deeper insights into system behavior.
-
Support for Serverless and Container Environments: Monitor and manage the performance of modern cloud-native applications.
Pros
-
Simplified Pricing Model: New Relic’s pay-per-use pricing model makes it a cost-effective solution.
-
Strong APM Capabilities: Provides detailed code-level insights to identify and resolve performance bottlenecks.
-
Excellent Transaction Tracing and Error Tracking: Easily trace transactions and identify the root cause of errors.
-
Comprehensive Digital Experience Monitoring: Capture user experience data to optimize performance and boost customer satisfaction.
Cons
-
Advanced Features May Require Significant Configuration: Setting up advanced features can be complex.
-
Some Users Report Data Retention Limitations: Data retention periods may be limited, affecting historical analysis.
-
UI Can Feel Cluttered with Many Features: The numerous features can sometimes make the interface feel overwhelming.
Implementation Tips
Here are some tips for getting started with New Relic:
-
Start with a specific goal: Define your monitoring objectives and focus on implementing the relevant features.
-
Instrument your applications: Integrate New Relic agents into your applications to collect performance data.
-
Create custom dashboards: Visualize key metrics relevant to your specific needs.
-
Configure alerts: Set up alerts for critical events to enable proactive incident management.
Comparison with Similar Tools
New Relic competes with platforms like Dynatrace, Datadog, and Splunk. While each has strengths, New Relic is known for its APM capabilities, simplified pricing, and focus on digital experience monitoring.
Website: https://newrelic.com/
New Relic is a valuable tool for organizations seeking deeper insights into their software stack’s performance. Its features, unified platform, and flexible pricing make it a compelling choice. By using New Relic, teams can improve application performance, enhance customer experience, and optimize their IT infrastructure.
3. Dynatrace
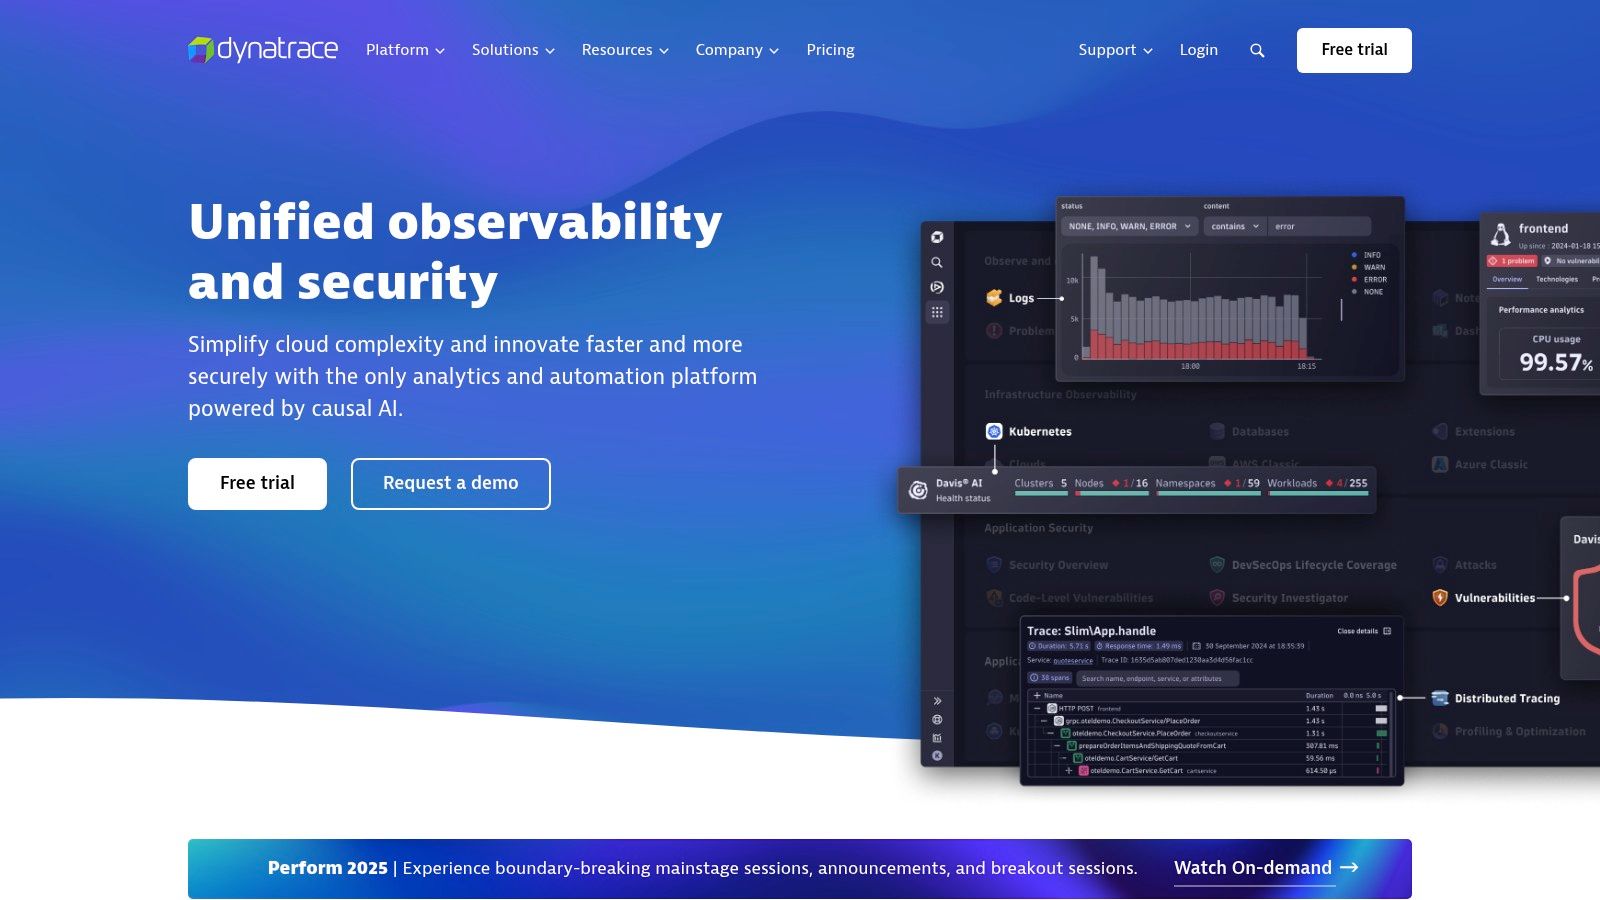
Dynatrace is a leading AI-powered, full-stack monitoring platform. It’s known for its automated root cause analysis and comprehensive performance monitoring for both infrastructure and applications. This makes it a particularly strong choice for complex, dynamic environments that demand precise insights and swift problem resolution.
Dynatrace simplifies monitoring with its OneAgent, automatically discovering and instrumenting your environment. This reduces manual configuration, minimizing blind spots and accelerating time to value. Imagine deploying a single agent and automatically monitoring your entire Kubernetes cluster, from the underlying servers to individual microservices.
The Power of Davis AI
At the heart of Dynatrace is the Davis AI engine. Davis goes beyond simple metric collection. It analyzes data in real-time, identifying anomalies and pinpointing the root cause of performance bottlenecks. It even predicts potential future issues. This proactive capability empowers DevOps teams to shift from reactive troubleshooting to proactive optimization. The result? Less downtime and better user experiences.
Key Features and Benefits
- Automatic Discovery and Instrumentation (OneAgent): Deploy OneAgent once to discover your entire infrastructure, applications, microservices, and more, simplifying setup and maintenance.
- Davis AI for Automated Root Cause Analysis: Eliminate tedious manual troubleshooting with Davis AI, which pinpoints the source of problems and drastically reduces MTTR (mean time to resolution).
- Full-Stack Monitoring: Gain a complete overview of your entire technology stack, from infrastructure performance to user experience metrics.
- Real User Monitoring and Session Replay: Understand how real users interact with your application to identify and resolve bottlenecks impacting their experience. Session replay provides a recording of user interactions, making it easier to debug user-specific problems.
- Advanced AIOps Capabilities: Harness AI-driven insights for automated anomaly detection, predictive scaling, and intelligent resource optimization.
Pros and Cons of Using Dynatrace
Pros:
- Superior AI-driven Root Cause Analysis: Davis AI excels at quickly and accurately identifying the root cause of complex performance issues.
- Comprehensive Auto-Discovery and Dependency Mapping: OneAgent simplifies deployment and provides a clear visualization of the relationships between system components.
- Low Overhead Monitoring Agent: Minimize the performance impact of monitoring on your production systems.
- Strong Support for Cloud-Native and Kubernetes Environments: Dynatrace is designed to handle the dynamic nature of modern, containerized applications.
Cons:
- Higher Price Point: Dynatrace’s advanced capabilities come at a premium compared to some competitors.
- Complex Deployment for Large Enterprises: While OneAgent simplifies initial setup, configuring and managing Dynatrace at scale can be challenging.
- Limited Customization Options: While feature-rich, Dynatrace offers fewer customization options than some open-source alternatives.
Pricing, Technical Requirements, and Implementation Tips
Pricing: Dynatrace offers tiered pricing based on consumption and features. Contact their sales team for details.
Technical Requirements: Dynatrace supports a wide range of operating systems, cloud platforms, and application technologies. Consult their official documentation for compatibility information.
Implementation/Setup Tips:
- Define Your Scope: Focus your initial monitoring efforts on critical applications and infrastructure.
- Utilize Learning Resources: Take advantage of Dynatrace’s documentation and training materials.
- Integrate with Existing Tools: Integrate Dynatrace with your current DevOps toolchain to streamline workflows and automate incident response.
Comparison with Similar Tools
Compared to tools like Datadog and New Relic, Dynatrace offers more advanced AI-driven root cause analysis, but at a higher cost. Datadog provides greater flexibility in customization and integrations, while New Relic is often a more budget-friendly option for smaller organizations.
Website: Dynatrace
Dynatrace empowers organizations that need deep performance insights and rely on automation to optimize their IT operations. Its AI-powered root cause analysis, comprehensive monitoring, and automated discovery make it a compelling choice for enterprises seeking to enhance application performance and minimize MTTR.
4. Splunk
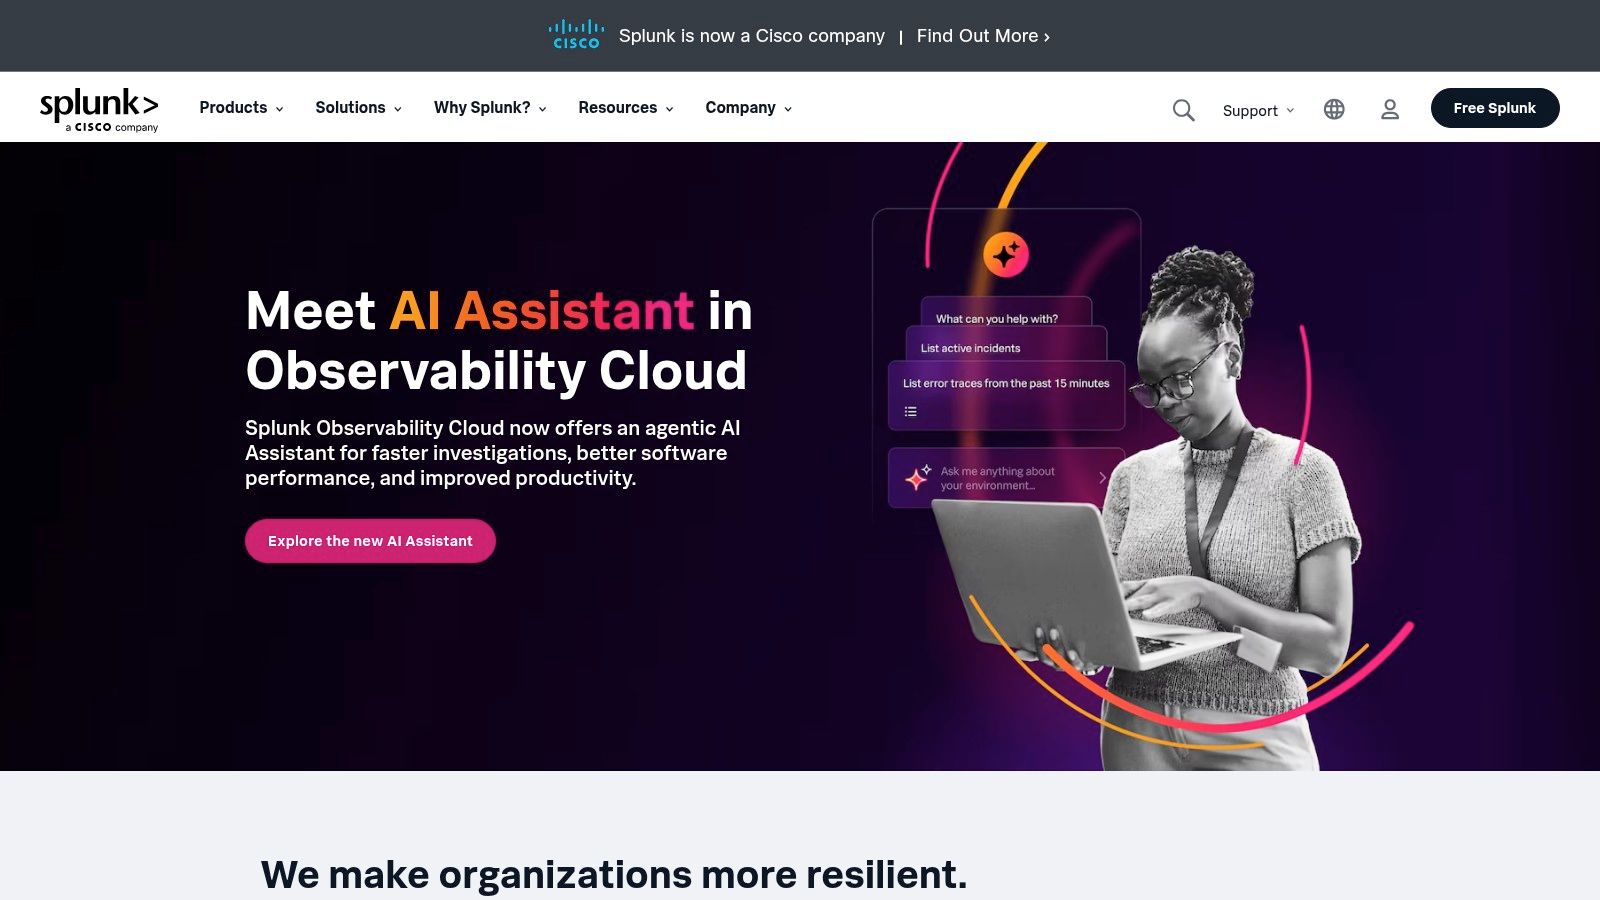
Splunk is a leading data platform known for its robust monitoring, investigation, and action capabilities. It handles various data types and is especially useful for enterprises managing large amounts of machine-generated data. With Splunk, organizations gain valuable operational insights and enhance their security posture.
Splunk ingests data from numerous sources, including servers, applications, network devices, and security logs. This creates a centralized monitoring system for an organization’s entire IT infrastructure. Splunk’s search and analytics engine, combined with its visualization and dashboarding features, helps teams identify trends, spot anomalies, and investigate performance issues.
Practical Applications and Use Cases
Here are some practical ways Splunk can be used:
-
Real-time Infrastructure Monitoring: Track server performance, identify potential outages, and proactively resolve infrastructure problems.
-
Application Performance Management (APM): Monitor application health, diagnose performance bottlenecks, and improve user experience.
-
Security Information and Event Management (SIEM): Analyze security logs, identify suspicious activity, and effectively respond to security threats.
-
Business Intelligence: Gain a complete view of operations by analyzing business data alongside IT data. This can help identify areas for improvement.
-
Compliance and Auditing: Collect and analyze audit trails to demonstrate compliance with regulatory requirements.
Key Features and Benefits
Splunk offers several key features and benefits:
-
Powerful Search and Analytics: Splunk’s Search Processing Language (SPL) facilitates complex data analysis and custom reporting.
-
Advanced Visualizations: Create interactive dashboards and reports to visualize data and easily share key insights.
-
Machine Learning: Utilize machine learning capabilities for anomaly detection, predictive analytics, and automated incident response.
-
Real-time Alerting: Receive instant notifications of critical events, enabling you to proactively address issues.
-
Extensive Integrations: Integrate Splunk with various third-party tools and services to enhance its functionality.
Pros and Cons
Like any tool, Splunk has both advantages and disadvantages:
Pros:
-
Flexible Data Ingestion and Analysis: Handles structured, semi-structured, and unstructured data from diverse sources.
-
Strong Security and Compliance: Meets stringent security and compliance standards, safeguarding your data.
-
Powerful Query Language (SPL): Enables in-depth data analysis and manipulation.
-
Scalability: Handles massive data volumes, suitable for enterprise-level data processing.
Cons:
-
Cost: Pricing based on data ingestion volume can become expensive for organizations with high data throughput.
-
Learning Curve: Mastering SPL requires time and effort.
-
Resource Intensive: Demands significant hardware resources for optimal performance.
Pricing, Technical Requirements, and Comparisons
Splunk offers various pricing plans based on ingested data volume and desired features. Contact Splunk sales for detailed pricing information. It can be deployed on-premises, in the cloud, or in a hybrid environment. Specific hardware and software requirements vary based on the deployment model and data volume.
Splunk is often compared to tools like the Elastic Stack (ELK), Datadog, and Sumo Logic. While these offer similar functionalities, Splunk’s powerful SPL, extensive integrations, and robust security features set it apart. However, cost considerations may favor open-source alternatives like ELK.
Implementation/Setup Tips
Here are a few tips for implementing Splunk:
-
Start Small: Focus on a specific use case to avoid feeling overwhelmed during initial setup.
-
Training is Key: Invest in SPL training to maximize your use of Splunk.
-
Plan for Data: Carefully consider your data volume and storage requirements to manage costs.
-
Use Available Resources: Leverage Splunk’s documentation and community resources to streamline your learning and implementation.
5. AppDynamics

AppDynamics, now a Cisco company, is a comprehensive application performance management (APM) and IT operations analytics platform. It provides deep insights into application performance, user experience, and business transactions. These insights span diverse environments, including cloud, on-premises, and hybrid deployments. This makes it a valuable tool for enterprises looking to optimize application performance and drive better business outcomes.
AppDynamics excels at correlating business transactions with underlying infrastructure issues. For example, imagine your e-commerce checkout process slows down. AppDynamics can trace the problem not just to the application server, but also pinpoint the root cause. This could be anything from a saturated database connection pool to a slow external API call. This level of detail is crucial for quick troubleshooting and performance optimization.
Key Features and Benefits
-
Business Transaction Monitoring with Code-Level Visibility: Follow key business transactions end-to-end, drilling down to specific code segments to identify performance bottlenecks. This is especially useful for developers diagnosing and resolving performance issues efficiently.
-
Automated Discovery of Application Topology: AppDynamics automatically maps the relationships and dependencies within your application environment. This visual representation simplifies understanding complex architectures and spotting potential points of failure.
-
End-User Experience Monitoring: Monitor application performance from the end-user’s perspective across various devices and browsers. This helps ensure a positive user experience and proactively address potential issues before they impact customer satisfaction.
-
AI-Powered Root Cause Analysis: Use machine learning algorithms to automatically detect anomalies and identify the root cause of performance problems, significantly reducing troubleshooting time.
-
Support for Diverse Environments: AppDynamics supports cloud-native, hybrid, and on-premises deployments, catering to modern application architectures.
Pros and Cons
Pros:
- Strong Business Transaction Correlation: Effectively connects business performance with underlying infrastructure health.
- Excellent Visualization of Application Dependencies: Offers a clear view of application architecture and interdependencies.
- Powerful Baseline Analytics and Anomaly Detection: Proactively identifies deviations from normal performance patterns.
- Deep Code-Level Diagnostics: Allows for precise identification of performance bottlenecks within the codebase.
Cons:
- Premium Pricing Structure: AppDynamics is a premium solution and can be costly, especially for large and complex environments. Carefully evaluate the pricing against your needs and budget.
- Complex Configuration for Distributed Environments: Setting up and configuring AppDynamics for highly distributed environments can be challenging and may require specialized expertise.
- Agent Overhead: The AppDynamics agent, while providing detailed monitoring, can introduce performance overhead. Careful monitoring and tuning are necessary to minimize the impact.
Implementation Tips
- Start with a focused deployment: Begin by monitoring critical business transactions and expand coverage gradually.
- Leverage the AI-powered anomaly detection: Use the built-in AI capabilities to streamline troubleshooting and identify potential issues proactively.
- Monitor agent overhead: Keep a close eye on resource utilization and adjust agent settings to optimize performance.
Comparison and Pricing
AppDynamics competes with tools like Dynatrace, New Relic, and Datadog. Each platform offers similar APM capabilities, but AppDynamics stands out with its focus on business transaction monitoring and deep code-level diagnostics. Choosing the right tool depends on your specific needs and priorities.
AppDynamics offers tiered pricing based on features and usage. Detailed technical requirements vary based on the deployment environment. Contact AppDynamics directly for detailed pricing and technical specifications.
Website: https://www.appdynamics.com/
6. Prometheus and Grafana: A Powerful Open-Source Monitoring Duo
Prometheus and Grafana are often used together, creating a robust and adaptable open-source monitoring system. This pairing is especially well-suited for dynamic, containerized environments like those built with Kubernetes. Prometheus excels at collecting and storing time-series data. Grafana transforms that data into visually appealing and insightful dashboards. Together, they provide a powerful toolkit for understanding system performance, identifying bottlenecks, and proactively resolving potential issues.
Prometheus uses a multi-dimensional data model with time-series data at its core. This allows you to query data using various labels, offering detailed insights into specific parts of your infrastructure. Its query language, PromQL, provides flexibility for complex queries and setting alerts based on defined thresholds, which is crucial for proactive incident identification and response. Plus, Prometheus smoothly integrates with service discovery mechanisms, automatically adjusting to dynamic environments like Kubernetes clusters, where services are constantly changing.
Grafana complements Prometheus by providing a visually rich platform to create customizable dashboards. These dashboards can display metrics from multiple sources, including Prometheus, giving you a single view of your entire infrastructure. Grafana’s extensive visualization options—graphs, gauges, heatmaps, and more—allow you to adapt your dashboards to specific requirements.
Practical Applications
-
Kubernetes Monitoring: Prometheus and Grafana are the industry standard for monitoring Kubernetes clusters, providing insights into resource usage, pod health, and overall cluster performance.
-
Microservices Monitoring: In a microservices architecture, Prometheus and Grafana can monitor individual services and their dependencies, helping locate performance bottlenecks and troubleshoot problems.
-
API Monitoring: Track API latency, error rates, and request volumes to ensure optimal performance and availability. You might be interested in: Our guide on API Monitoring.
-
Infrastructure Monitoring: Monitor servers, databases, and other infrastructure components for smooth and efficient operation.
Features
- Multi-dimensional data model with time series data
- PromQL for flexible querying and alerting
- Service discovery integration for dynamic environments
- Highly customizable dashboards with Grafana
- Extensive integration options with different data sources
Pros
-
Open-source with no licensing costs: This significantly lowers the cost of entry, making it attractive for organizations of all sizes.
-
Excellent for Kubernetes and container monitoring: Prometheus’s architecture is well-suited for the dynamic nature of containerized environments.
-
Highly scalable and reliable: Prometheus handles large volumes of data and is designed for high availability.
-
Strong community support and ecosystem: A large and active community provides ample resources and support.
Cons
-
Steeper learning curve compared to commercial solutions: Mastering PromQL and configuring Prometheus requires technical expertise.
-
Requires more manual configuration than some SaaS alternatives: This provides more flexibility but increases setup time and complexity.
-
Long-term storage requires additional components: Prometheus is designed for short-term storage and needs integration with other solutions for long-term data retention.
-
Less integrated APM features compared to commercial platforms: While Prometheus can collect application performance metrics, dedicated APM tools offer more in-depth analysis.
Pricing
Both Prometheus and Grafana are open-source and free to use. Grafana offers commercial enterprise plans with added features and support.
Technical Requirements
Running Prometheus and Grafana involves setting up servers or containers, configuring them, and potentially integrating them with current infrastructure components.
Comparison With Similar Tools
Commercial solutions like Datadog and New Relic offer more integrated features and user-friendly interfaces. Prometheus and Grafana offer greater flexibility, customization, and cost savings, making them attractive to organizations with specific monitoring needs and a willingness to invest in setup and configuration.
Implementation Tips
-
Start with a small, defined use case to become familiar with the tools.
-
Plan your metrics and labeling strategy to ensure effective data collection and analysis.
-
Use Grafana’s extensive library of pre-built dashboards and plugins to speed up implementation.
Website
Prometheus and Grafana
Prometheus and Grafana deserve recognition for their powerful, flexible, and cost-effective enterprise monitoring solution, especially in modern, containerized environments. While the initial setup and configuration may require more investment, the long-term benefits of customization, scalability, and community support make them a strong choice for many organizations.
7. LogicMonitor
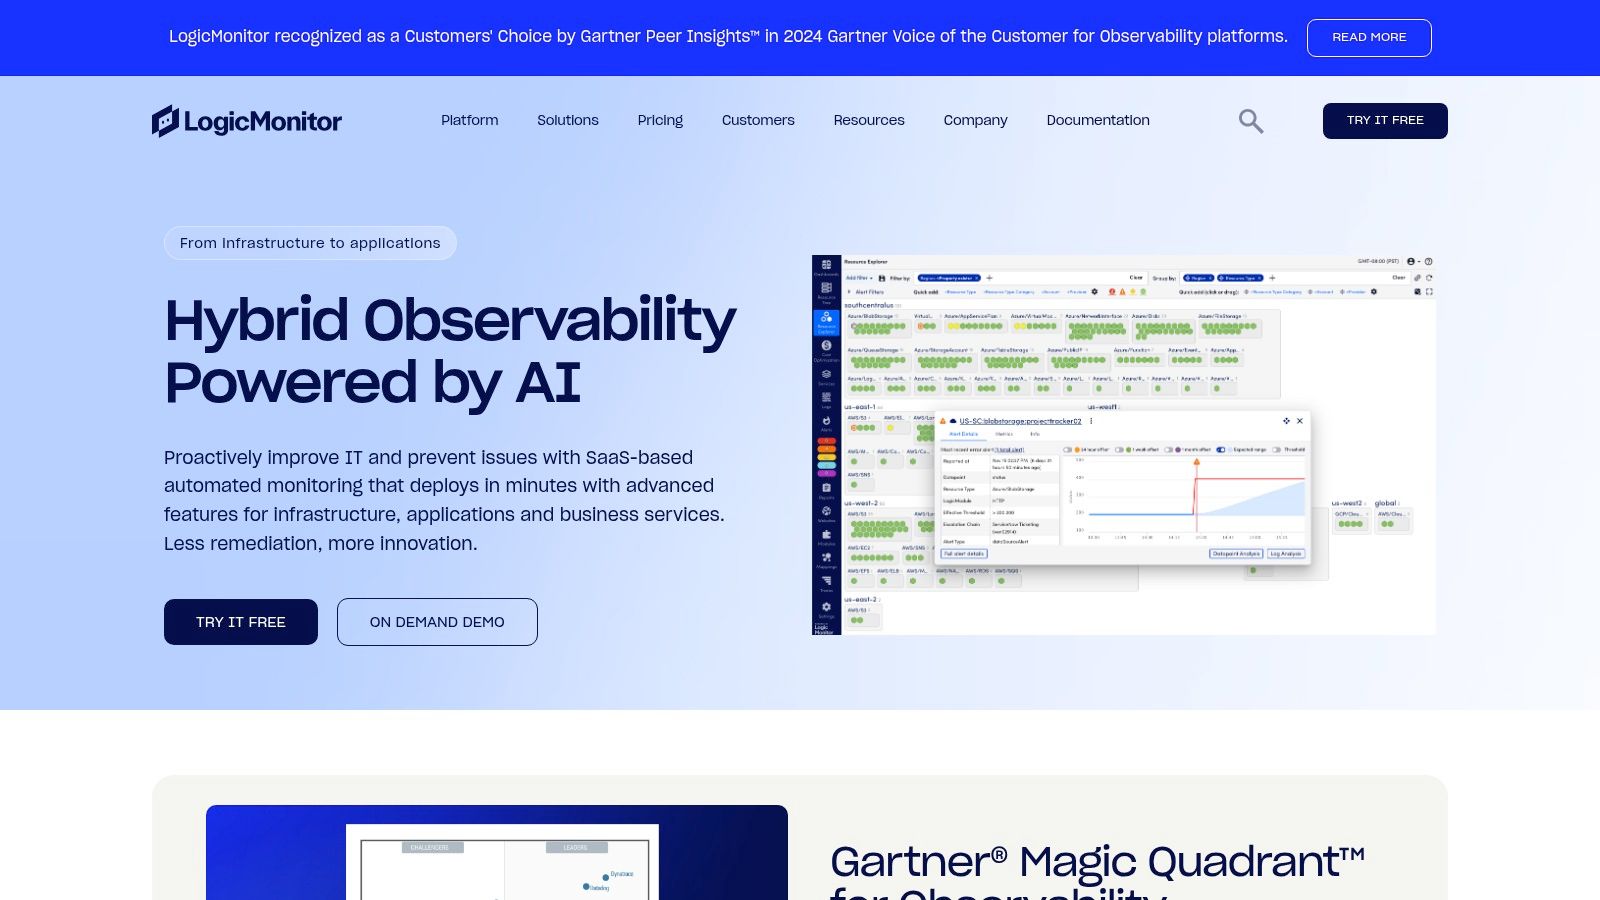
LogicMonitor is a Software as a Service (SaaS) infrastructure monitoring platform built for hybrid environments. It excels at automatically discovering and monitoring various IT assets, minimizing manual configuration. This includes everything from network devices and servers to virtual machines (VMs) and cloud resources. It’s a great option for organizations managing both on-premises and cloud infrastructure.
LogicMonitor offers complete visibility and control through a single, unified platform. Imagine effortlessly monitoring your AWS cloud resources alongside your local database servers. LogicMonitor enables this kind of holistic view, allowing for quicker troubleshooting and proactive capacity planning.
For DevOps teams using infrastructure as code, LogicMonitor’s automated discovery and monitoring features seamlessly integrate into dynamic environments. This ensures constant visibility as your infrastructure changes.
Key Features and Benefits
-
Automated Discovery and Monitoring: This feature dramatically reduces manual setup and guarantees thorough coverage of your IT environment.
-
AIOps Capabilities: LogicMonitor uses AI for anomaly detection and forecasting. This allows for proactive identification of potential problems and improved capacity planning, which is essential for preventing downtime and maintaining optimal performance. For instance, LogicMonitor can predict storage bottlenecks based on past data, allowing you to scale your resources preemptively.
-
Over 2,000 Pre-built Monitoring Templates: These templates speed up implementation and ensure consistent monitoring across various technologies and platforms. Whether you’re monitoring a Cisco router or a Microsoft SQL Server, there’s likely a pre-built template available, simplifying setup and minimizing manual configuration.
-
Multi-tenant Architecture for MSPs: This feature is perfect for Managed Service Providers handling multiple client environments.
-
LM Exchange: This community-driven platform allows users to share custom dashboards, reports, and monitoring templates.
Pros
-
Extensive out-of-the-box monitoring templates: These templates save time and effort when configuring monitoring for standard technologies.
-
Strong automation capabilities: These features simplify administration and lessen the need for manual intervention.
-
Excellent for hybrid infrastructure environments: LogicMonitor provides a single view across on-premises and cloud resources.
-
Good balance of depth and ease of use: The platform offers robust features while remaining accessible to users of varying technical skill.
Cons
-
More focused on infrastructure than application-level monitoring: While LogicMonitor does offer some application performance monitoring, its main strength lies in infrastructure monitoring. If deep application performance monitoring is your primary requirement, tools like Datadog or New Relic may be better suited.
-
UI can be complex to navigate initially: The platform’s many features can make the interface seem overwhelming at first. However, with a bit of practice, navigation becomes more intuitive.
-
Some advanced features require professional services: Accessing the full potential of some advanced features might require engaging LogicMonitor’s professional services team.
Pricing and Technical Requirements
LogicMonitor has several pricing tiers based on the number of resources being monitored. You can contact their sales team for detailed pricing information. As a SaaS product, LogicMonitor doesn’t require any on-premises infrastructure. You can access the platform simply through a web browser.
Implementation/Setup Tips
-
Leverage the pre-built monitoring templates: To get started quickly, use the existing templates designed for your specific technologies.
-
Explore the LM Exchange: The LM Exchange provides access to community-created resources that can further enhance your monitoring configuration.
-
Consider professional services for complex integrations or advanced features: LogicMonitor’s professional services team can help with implementing and customizing the platform for more complex scenarios.
Website
LogicMonitor combines automated discovery, comprehensive monitoring, and AIOps features. This makes it a solid choice for businesses looking for a robust platform to manage their hybrid infrastructure. Its wide range of templates and strong automation features contribute to fast implementation. The LM Exchange promotes community collaboration and sharing. Although the UI might initially seem complex, the comprehensive infrastructure monitoring benefits outweigh this minor downside. If efficient, automated monitoring of a diverse IT environment is a priority for your organization, LogicMonitor is worth exploring.
8. Elastic Observability
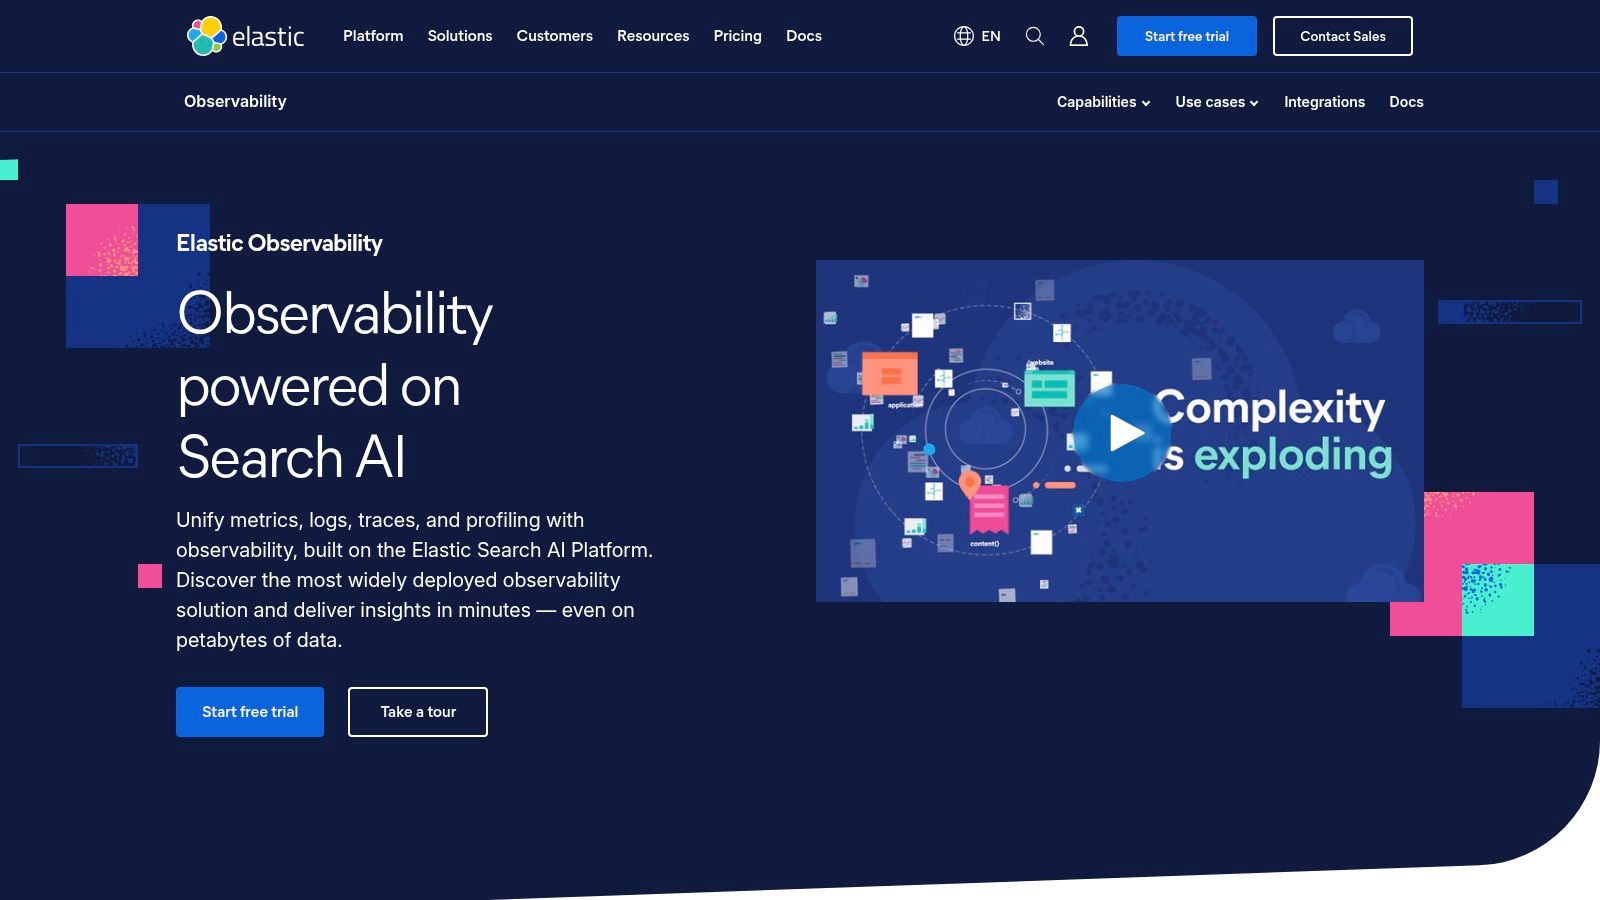
Elastic Observability, a core component of the Elastic Stack (formerly the ELK Stack), provides a powerful solution for monitoring your entire enterprise. It combines logs, metrics, and application performance monitoring (APM) traces into a single platform. This gives you comprehensive insights into the health and performance of your infrastructure, applications, and services. It’s a valuable tool for software developers, QA engineers, IT operations, DevOps professionals, and business leaders alike.
Elastic Observability uses the power of Elasticsearch, offering exceptional search capabilities and real-time data analysis. This allows you to quickly identify and diagnose performance bottlenecks, troubleshoot issues, and proactively prevent future problems. Think about quickly finding the root cause of a slow transaction in a complex microservices architecture, or identifying an emerging infrastructure issue before it affects users. That’s the potential of Elastic Observability.
Key Features and Benefits
-
Unified Data Analysis: Correlate logs, metrics, and traces for a complete understanding of your systems. This unified approach simplifies troubleshooting and speeds up resolving incidents.
-
Machine Learning: Use machine learning for anomaly detection and forecasting. This helps you proactively identify potential issues and optimize how you allocate resources.
-
Distributed Tracing: Get deep visibility into application performance with distributed tracing, allowing you to find bottlenecks and optimize specific services or transactions.
-
Infrastructure Monitoring: Monitor the health and performance of all your infrastructure, both in the cloud and on-premises, from a single platform.
-
Flexible Deployment: Choose self-managed deployments for maximum control or Elastic Cloud for a fully managed SaaS experience.
Practical Applications and Use Cases
-
Real-Time Application Performance Monitoring: Track key metrics such as latency, error rates, and throughput to ensure optimal application performance.
-
Security Monitoring: Detect and respond to security threats by analyzing logs and identifying unusual behavior.
-
Business Analytics: Gain insights into customer behavior and business operations through log and metric analysis.
-
Infrastructure Optimization: Identify resource bottlenecks and optimize how you use your infrastructure.
Pricing and Technical Requirements
Elastic offers several licensing options, including a free Basic tier, and paid Standard, Gold, and Platinum tiers with increasing features and support. You can find pricing details on the Elastic website. Technical requirements depend on your chosen deployment (self-managed versus Elastic Cloud) and the scale of your operations. Elastic provides detailed documentation for this.
Comparison With Similar Tools
Elastic Observability competes with tools like Datadog, Splunk, and Dynatrace. While these offer similar features, Elastic often stands out because of its powerful search capabilities, adaptable data model, and open-source foundation. However, setup and management can be more complex than with pure SaaS solutions.
Implementation and Setup Tips
-
Start Small: Begin by monitoring one application or service and gradually expand from there.
-
Define Clear Objectives: Decide what you want to monitor and which metrics are most important.
-
Use the Elastic Agent: Streamline data collection from multiple sources using the Elastic Agent.
-
Invest in Training: Make sure your team has the skills to manage and optimize Elastic Observability.
Pros
- Powerful search capabilities through Elasticsearch
- Highly scalable architecture
- Open and flexible data model
- Strong integrations with security and business analytics tools
Cons
- Can require significant resources for large deployments
- More complex setup than SaaS-only solutions
- Requires expertise for optimal performance tuning
Website
https://www.elastic.co/observability
Elastic Observability deserves a place on this list because it’s a powerful, flexible, and scalable solution for comprehensive enterprise monitoring. Its ability to combine logs, metrics, and traces into one platform, together with its robust search and analysis capabilities, makes it valuable for organizations that want deep insights into their systems and optimized performance. While it requires more investment in setup and management than some SaaS alternatives, the flexibility and power it offers make it a strong choice for many enterprises.
9. Zabbix
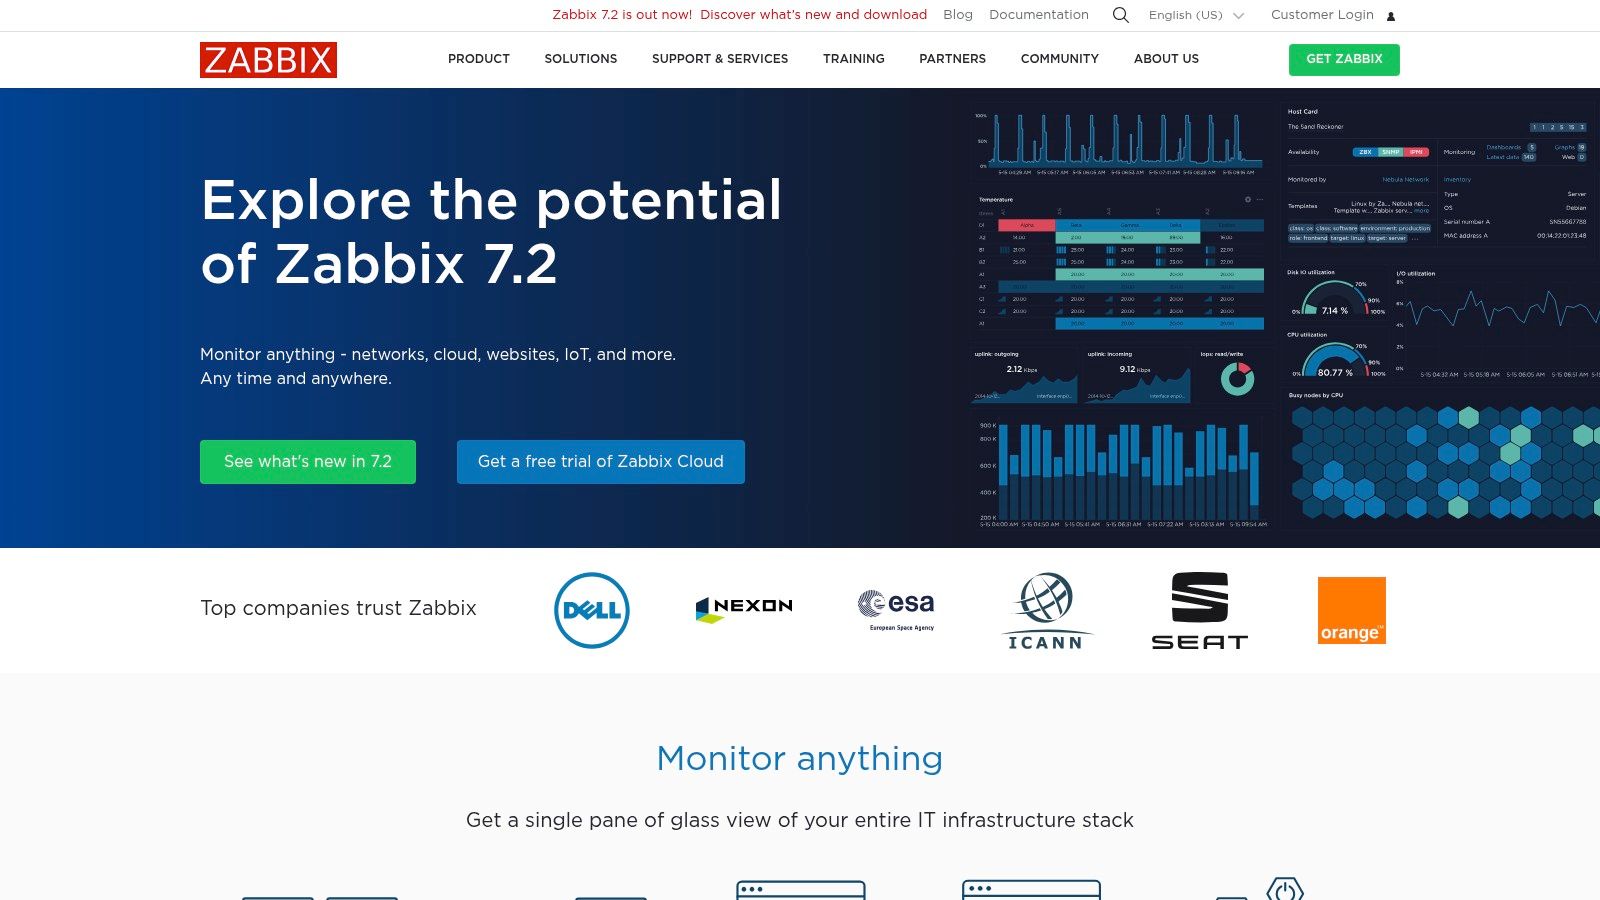
Zabbix is a powerful, completely open-source monitoring tool built for enterprise-level needs. It’s perfect for organizations wanting comprehensive infrastructure monitoring without the hefty price tag of licensed software. Its broad feature set and scalability make it a strong alternative to commercial products, particularly for those who prefer a more hands-on approach to configuration.
Zabbix monitors the availability and performance of a diverse range of IT infrastructure. This includes networks, physical and virtual servers, cloud instances, and a variety of applications. It’s particularly good at providing detailed metrics and a very adaptable notification system.
Practical Applications & Use Cases
-
Comprehensive Server Monitoring: Keep an eye on vital server metrics like CPU load, memory usage, and disk space. The agent-based approach gives you granular insights into server health.
-
Network Performance Monitoring: Monitor network hardware such as routers and switches. Measure crucial metrics like bandwidth, packet loss, and latency.
-
Cloud Infrastructure Monitoring: While not exclusively cloud-native, Zabbix integrates with cloud instances and services using various APIs and integrations.
-
Application Performance Monitoring: Monitor the performance of web applications, databases, and other important services through both agent-based and agentless methods.
-
Capacity Planning: Use Zabbix’s historical data collection and trend analysis to forecast future resource needs and optimize how you utilize your infrastructure.
Features & Benefits
-
Agent-based and Agentless Monitoring: Choose the best monitoring approach for your system. Agent-based offers richer data, while agentless is simpler to deploy.
-
Distributed Monitoring with Proxies: Scale your monitoring efforts across dispersed locations and large networks using Zabbix proxies. This takes the strain off your central server.
-
Powerful Event Correlation: Pinpoint the root cause of problems by correlating events from different monitored components.
-
Customizable Alerting and Notification System: Set up precise alerts via email, SMS, or custom scripts based on specific triggers and thresholds, enabling quick responses.
-
Template-based Monitoring with Auto-discovery: Simplify deployments with pre-built templates and automatic discovery of new devices and services.
Pros
-
Completely Open-Source: No licensing fees, saving substantial costs compared to commercial options.
-
Highly Scalable Architecture: Efficiently handles large, complex environments using distributed monitoring and proxies.
-
Extensive Monitoring Capabilities: Provides a wide range of monitoring features without the need for costly add-ons.
-
Strong Community Support: Benefit from a large, active community and readily available online resources.
Cons
-
Steeper Learning Curve: Requires more technical knowledge and time for initial setup compared to user-friendly commercial tools.
-
Dated User Interface: The interface is functional but may appear less modern than some newer monitoring tools.
-
Complex Configuration for Large Environments: Managing very large deployments can become challenging.
-
Limited Cloud-Native Monitoring Capabilities: While offering cloud monitoring, it might not be as deeply integrated as specialized cloud-native tools.
Pricing
Zabbix is free and open-source. Costs are mainly associated with the hardware and infrastructure required to run the Zabbix server and proxies, along with any potential consulting for initial setup and customization.
Technical Requirements
The Zabbix server runs on Linux. Agents are available for various operating systems, including Linux, Windows, and Unix. Supported databases include MySQL, PostgreSQL, Oracle, and SQLite.
Comparison with Similar Tools
Zabbix is often compared to Nagios, another well-known open-source monitoring solution. Both are powerful, but Zabbix tends to have more built-in features and a more modern architecture, though with a steeper learning curve. Commercial alternatives such as Datadog and Dynatrace offer more polished user interfaces and cloud-native features, but come with licensing fees.
Implementation/Setup Tips
- Begin with pre-built templates to simplify the initial setup.
- Use the auto-discovery feature for adding new devices and services.
- Use distributed monitoring with proxies for scaling larger environments.
- Take the time to learn the event correlation system to effectively troubleshoot issues.
Website: https://www.zabbix.com/
10. SolarWinds Orion Platform
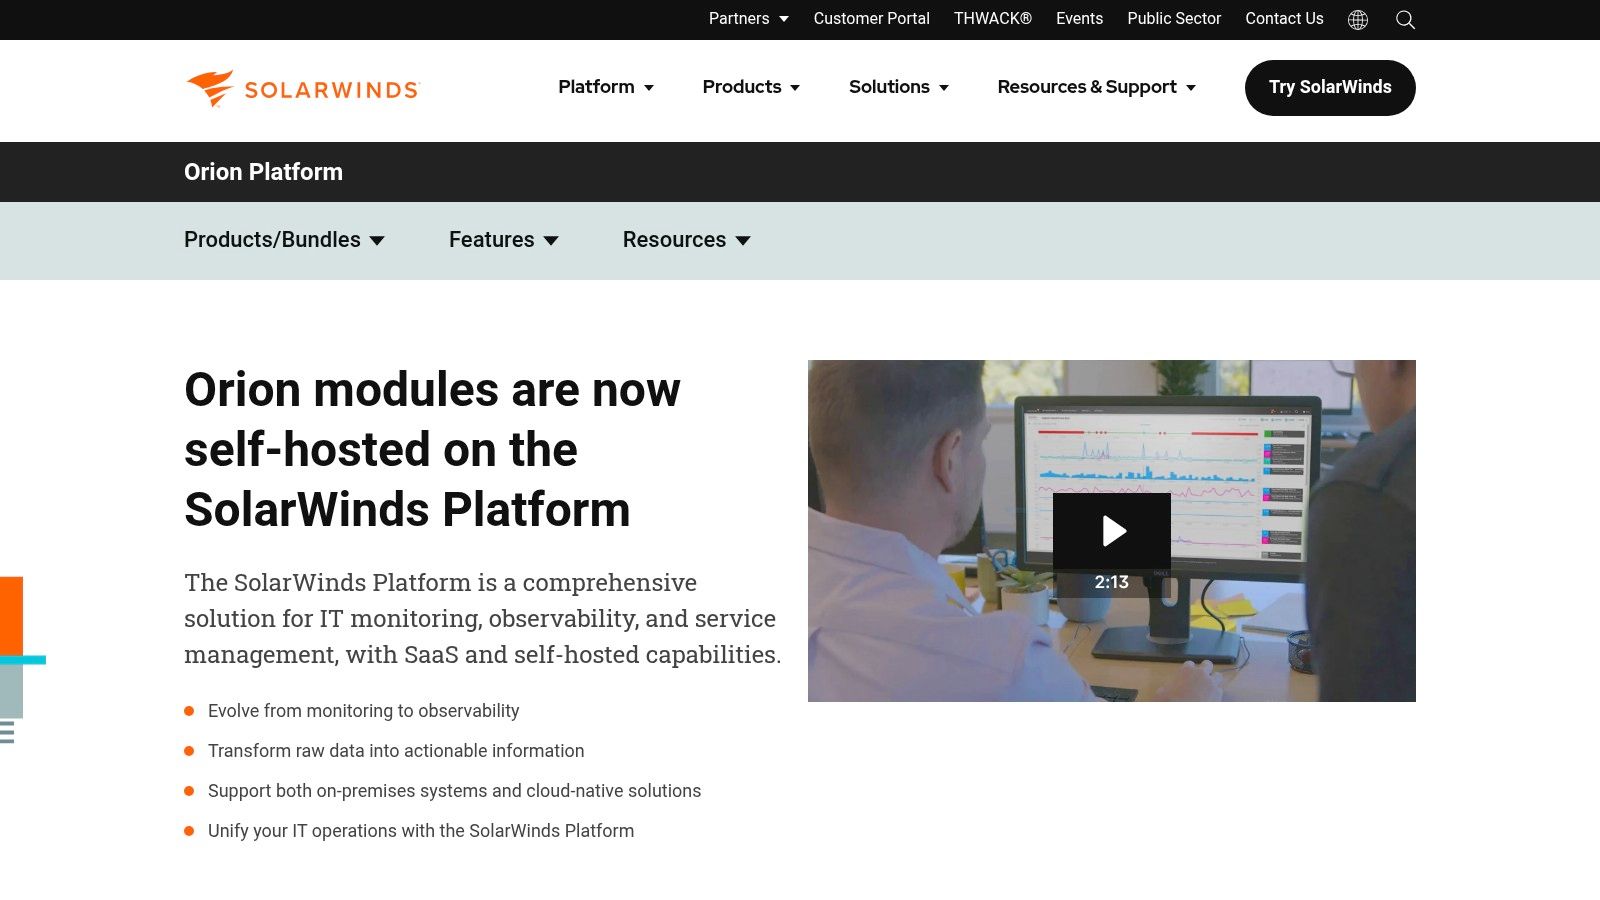
The SolarWinds Orion Platform earns a spot on this list for its comprehensive and modular approach to enterprise IT monitoring. It offers a centralized platform for managing diverse infrastructure, from network devices and servers to applications and databases. This makes it a valuable tool for ensuring performance and stability, especially for large enterprises with complex IT environments.
SolarWinds Orion’s modular design makes it highly customizable. You can begin with a core platform and add specific modules based on your needs. This tailored approach lets organizations avoid paying for unnecessary features. Need to dive deep into network performance? Add the Network Performance Monitor (NPM) module. Focused on application performance? Integrate the Server & Application Monitor (SAM). This adaptable structure allows for scaling and customization.
Key Features and Benefits
-
Modular Design: Integrate specific modules to meet unique monitoring needs. This includes network performance, server health, application performance, database performance, and log management. This focused approach minimizes unnecessary features.
-
Network Performance Monitoring and Diagnostics: Gain detailed insight into network traffic, identify bottlenecks, and troubleshoot performance problems with tools like NetFlow traffic analysis and network device polling.
-
Server and Application Performance Monitoring: Keep an eye on the health and performance of your key servers and applications, ensuring they remain available and responsive.
-
Customizable Alerting and Reporting: Set specific performance thresholds and receive alerts when these are breached. Create detailed reports to support capacity planning and performance analysis.
-
Unified Interface: Manage on-premises, hybrid, and cloud infrastructure from a single, user-friendly dashboard. This centralized management reduces IT complexity.
Practical Applications and Use Cases
-
Troubleshooting Network Latency: Identify the root cause of network slowdowns with interactive network maps and granular performance data.
-
Capacity Planning: Analyze resource usage trends to anticipate future requirements and scale your infrastructure proactively.
-
Application Performance Optimization: Find performance bottlenecks in applications and optimize code or infrastructure for better responsiveness.
-
Security Monitoring: Integrating with the Security Event Manager allows correlation of security events across your IT environment, enhancing threat detection and response.
Pros
- Comprehensive Visibility: Provides a complete view of your entire IT infrastructure.
- Strong Network Monitoring: Offers deep insights into network performance and traffic flow.
- Intuitive Interface: Features interactive network maps that simplify network management and troubleshooting.
- Deep Hardware Monitoring: Delivers detailed metrics on server and hardware health.
Cons
- Resource Intensive: Large deployments can require significant server resources to process the monitoring data.
- Complex Licensing: Understanding the licensing model for various modules can be challenging.
- Limited AIOps: Offers fewer automated root cause analysis and predictive capabilities compared to some newer platforms.
- Security Concerns: Thorough security assessments and proper configuration are critical, especially considering recent breaches.
Pricing and Technical Requirements
SolarWinds uses a modular pricing model; costs vary based on the selected modules and features. Contact SolarWinds for specific pricing details. Technical requirements also depend on the implemented modules. Consult the SolarWinds website for detailed system requirements.
Implementation/Setup Tips
- Start Small, Scale Gradually: Begin with the core platform and add modules incrementally to manage implementation complexity.
- Define Clear Goals: Outline your monitoring objectives before deploying the platform to ensure you choose the right modules and configuration.
- Invest in Training: Proper training will maximize the tool’s value and allow for efficient troubleshooting.
Comparison with Similar Tools
SolarWinds competes with tools like Datadog, LogicMonitor, and Dynatrace. While these platforms often offer more advanced AIOps features, SolarWinds excels in its in-depth network monitoring and modular design, providing a more granular and cost-effective solution for organizations prioritizing network and infrastructure monitoring.
Website: https://www.solarwinds.com/orion-platform
Enterprise Monitoring: Top 10 Tools Comparison
| Tool | Core Features ★ | UX & Quality 🏆 | Value Proposition 💰 | Target Audience 👥 | Unique Points ✨ |
|---|---|---|---|---|---|
| Datadog | Real-time dashboards, full-stack observability, ML anomaly detection | Intuitive UI, robust ML insights | Unified visibility across entire stack | DevOps, enterprise teams | 500+ integrations, distributed tracing |
| New Relic | APM, digital experience monitoring, real-time alerts | Clear code-level insights, effective tracing | Single-platform observability with flexible pricing | Developers, IT ops | Support for serverless & containers, custom dashboards |
| Dynatrace | AI-driven monitoring, auto-discovery, root cause analysis | Automated instrumentation, low overhead | Scalable cloud-native monitoring | Large enterprises, cloud teams | Davis AI engine, OneAgent technology |
| Splunk | Search-driven analytics, real-time alerting, data ingestion | Powerful visualizations, flexible queries | Data-driven insights for security & performance | Security teams, IT ops, data analysts | Robust query language, extensive ecosystem |
| AppDynamics | Business transaction tracing, end-user monitoring, code-level diagnostics | Interactive dependency maps, rich diagnostics | Optimize application performance & business outcomes | Enterprises, IT operations | Deep code visibility, AI-powered analysis |
| Prometheus and Grafana | Time-series metrics, flexible querying (PromQL), custom dashboards | Highly customizable, open-source design | Cost-effective monitoring with scalability | Dev teams, Kubernetes users | Extensive community support, open-source ecosystem |
| LogicMonitor | Automated discovery, extensive monitoring templates, AIOps capabilities | Intuitive dashboards with hybrid infrastructure | Comprehensive visibility across on-prem & cloud | IT ops, managed service providers | LM Exchange, automated asset monitoring |
| Elastic Observability | Unified logs/metrics/traces, ML anomaly detection, distributed tracing | Scalable, flexible real-time analysis | Deep search-based insights across distributed systems | Enterprises, analytics teams | Built on Elasticsearch, flexible deployment options |
| Zabbix | Agent-based/agentless monitoring, event correlation, template auto-discovery | Robust monitoring yet dated UI | Open-source solution with zero licensing fees | IT ops, open-source advocates | Scalable architecture, customizable alerts |
| SolarWinds Orion Platform | Modular monitoring, network/server diagnostics, NetFlow analysis | Interactive maps, integrated management interface | Comprehensive IT stack visibility | Enterprise IT, network teams | Deep hardware monitoring, customizable alerts |
Choosing the Right Monitoring Solution
Selecting the right enterprise monitoring solution isn’t a one-size-fits-all endeavor. It hinges on a variety of factors, including your specific needs, budget, the complexity of your infrastructure, and your team’s expertise. Ask yourself key questions: Do you need a deep dive into application performance? Is your primary focus infrastructure health? What level of detail do you need for alerting and reporting? Answering these will help narrow your choices.
This article has explored ten popular solutions. Each has its own strengths and weaknesses, catering to different monitoring philosophies and use cases. We’ve looked at everything from comprehensive platforms like Datadog and Dynatrace to the open-source flexibility of Prometheus and Grafana, and the specialized capabilities of tools like LogicMonitor and SolarWinds.
Key Considerations When Comparing Tools
When comparing tools, keep these key factors in mind:
- Features: Does the tool provide the specific monitoring capabilities you need, such as application performance monitoring, infrastructure monitoring, log management, and network monitoring?
- Scalability: Can the solution grow with your infrastructure, accommodating both your current and future needs?
- Ease of Use: How intuitive is the tool’s interface? Is it easy to set up, configure, and manage?
- Integration and Compatibility: Will the tool integrate seamlessly with your existing technology stack, including cloud providers, CI/CD pipelines, and other monitoring tools?
- Budget and Resources: Carefully evaluate the pricing model and consider the total cost of ownership, including licensing fees, implementation costs, and ongoing maintenance. Also, consider the resources required for setup, configuration, and ongoing management.
Getting Started with a New Monitoring Solution
Implementing a new monitoring solution typically involves these steps:
- Define Your Monitoring Goals: Clearly outline what you hope to achieve with the new tool. What specific problems are you trying to solve or improvements are you aiming for?
- Proof of Concept (POC): Test the tool in a non-production environment to evaluate its functionality and suitability for your specific needs. This helps you avoid costly mistakes down the line.
- Configuration and Customization: Configure the tool to monitor your specific infrastructure and applications. Set up alerts and dashboards to visualize key performance indicators and potential issues.
- Training and Documentation: Ensure your team has adequate training on how to use the new tool effectively. Utilize available documentation and support resources.
By carefully evaluating the options and considering the insights provided here, you can identify the ideal tools to ensure optimal performance, security, and reliability for your IT environment. Remember to factor in your specific needs, budget, and team expertise when making your final decision.
Ensuring Stability and Reliability with GoReplay
Ensuring system stability and reliability under real-world conditions is paramount. This is where a powerful testing strategy becomes essential. GoReplay transforms real production traffic into an effective testing tool. It captures and replays live HTTP traffic into your testing environments.
By mirroring real user interactions, GoReplay allows you to identify and resolve issues before they affect your live systems. This ensures a seamless user experience and minimizes potential downtime. From load testing to simulating complex traffic scenarios, GoReplay provides valuable insights for confidently deploying updates and maintaining optimal application performance. Explore GoReplay and experience the peace of mind that comes with truly production-ready systems.