Rest API to Test: Streamline Staging QA with Live Traffic Replay
When it comes to testing a REST API, our first instinct is often to write manual scripts or lean on tools that use synthetic, predictable data. While that’s fine for basic sanity checks, this approach almost always misses the chaotic, real-world scenarios that are the true culprits behind production outages.
Real confidence doesn’t come from a test that passes in a lab. It comes from hammering your API with traffic that mirrors what your actual users are doing, warts and all.
Why Traditional REST API Testing Just Isn’t Cutting It
If you’ve ever pushed an update that sailed through staging only to watch it crumble under a live load, you know the painful gap between theory and reality. The classic methods we rely on for unit and integration testing are essential, but they can breed a dangerous false sense of security. They simply can’t replicate the sheer complexity of a production environment.
Manual test scripts and synthetic data generators are clean. They’re predictable. Production traffic, on the other hand, is anything but. It’s messy, with bizarre request sequences, malformed inputs, and a storm of concurrent user actions that are flat-out impossible to anticipate ahead of time.
The Grind of Manual and Synthetic Tests
Tools like Postman are fantastic for functional testing—making sure an endpoint returns the right status code or payload for a specific input. But they start to show their limits when you get into performance, regression, and load testing at scale. Trying to build and maintain a comprehensive suite of synthetic tests to cover every conceivable edge case quickly becomes a soul-crushing time sink.
This maintenance burden is a huge pain point for development teams. In fact, many developers and QA engineers end up spending 60-80% of their testing time on maintenance, not on creating new, valuable tests. With 82% of organizations now adopting API-first development, the pressure for smarter testing solutions that don’t rely on artificial data is immense. You can dig into the API testing market trends to see the full picture.
The bugs that take down your service aren’t found in a perfect lab environment; they’re discovered in the chaos of production. If your testing doesn’t embrace that chaos, you’re always one step behind a potential outage.
Where The Old Ways Fail
- Unrealistic Scenarios: Synthetic tests usually stick to the “happy path.” They rarely account for the strange, unpredictable things real users do.
- Brittle Test Suites: One small API change can break dozens of handcrafted tests, kicking off another cycle of tedious maintenance and rework.
- Poor Load Simulation: Trying to simulate thousands of concurrent users with realistic request patterns is incredibly difficult with most traditional tools.
- Missed Edge Cases: You can’t script for what you don’t know exists. Real traffic is a goldmine for uncovering obscure bugs that synthetic data would never find.
This is exactly why the shift toward traffic replay is gaining so much momentum. Instead of guessing how users will interact with your API, you can capture their actual behavior. That’s how you build a truly resilient rest api to test against.
Setting Up GoReplay to Capture Production Traffic
The first step to building a truly high-fidelity rest api to test is to see what’s actually happening in production. This is where GoReplay really starts to shine.
Instead of trying to guess user behavior and write synthetic scripts, you tap directly into your live traffic stream. You get to save every real user request for later. The setup is surprisingly straightforward, too—often just a single command to get the ball rolling.
First things first, you’ll need shell access to the server where your application is running. GoReplay works by listening to network traffic on a specific port, so it has to be installed right on the machine that’s getting hit with API requests.
Starting the Traffic Capture
Once you’re in, you can kick off the capture process. The basic command tells GoReplay to listen for raw TCP traffic on a port you specify and dump it all into a file. This file becomes the raw material for all your tests.
Here’s a practical, real-world example of the command you’ll run:
sudo gor —input-raw :8080 —output-file requests.gor
Let’s quickly break this down so you know exactly what’s happening.
sudo gor: This runs the GoReplay binary with superuser privileges. You need this to listen to network ports, which is a protected operation.--input-raw :8080: This is the core instruction. It tells GoReplay to grab all incoming TCP traffic on port8080. Make sure to change this to whatever port your production application uses.--output-file requests.gor: This flag tells GoReplay to save all that captured traffic into a file namedrequests.gor. The.gorextension is the standard format for these traffic files.
This command will run in the foreground, continuously capturing requests and writing them to the file until you stop it (usually with Ctrl+C). It’s a simple but incredibly powerful way to create a perfect replica of your production workload. For a deeper dive into different setups, our guide on a complete GoReplay setup for testing environments has more examples.
Pro Tip: When you run this for the first time, let it cook during a period of typical user activity. Capturing traffic at 3 AM might not give you the realistic load you need to find those nasty performance bottlenecks or tricky bugs. I usually aim for at least an hour during a busy part of the day to get a good, chunky sample.
With your requests.gor file now full of real user interactions, you have the foundational piece you need for the next crucial steps: masking sensitive data and replaying it all against your staging environment.
How to Mask Sensitive Data for Secure Testing
Capturing real production traffic gives you an incredible asset for your rest api to test. But let’s be clear: replaying raw production data directly into a non-production environment is a massive security risk and a compliance nightmare. You simply can’t let sensitive user information—passwords, API keys, or personally identifiable information (PII)—leave your secure production network.
This is where on-the-fly data masking becomes absolutely critical. Instead of replaying raw traffic, GoReplay lets you intercept and transform requests before they’re ever written to a file or sent to your staging server. This way, your test data keeps the structure and complexity of real requests without exposing a single sensitive detail.
The magic behind this is the --middleware flag. This powerful feature lets you pipe all captured traffic through an external script. The best part? You can write this script in any language you’re comfortable with—Python, Bash, Node.js, you name it. Its only job is to read each request, modify it, and pass it along.
Implementing Middleware for Data Transformation
Let’s walk through a real-world scenario. Imagine your REST API handles user authentication. The request body probably has a JSON payload with email and password fields. Your goal is to replace the real values with safe, static ones before the traffic gets saved.
You can whip up a simple Python script, we’ll call it mask_credentials.py, to do just that:
import sys import re
for line in sys.stdin: # Use regex to find and replace the password field modified_line = re.sub(r‘“password”:\s*”.*?”’, ‘“password”: “masked_password_123”’, line) sys.stdout.write(modified_line) sys.stdout.flush()
This script is straightforward: it reads each line of the request, uses a regular expression to find and replace the password’s value, and then prints the modified line back out.
To plug this into GoReplay, you just add the --middleware flag to your capture command. It looks like this:
sudo gor --input-raw :8080 --middleware "python mask_credentials.py" --output-file requests.gor
And that’s it. Now, every request captured from port 8080 will first pass through your Python script. The resulting requests.gor file will contain the sanitized version of your traffic, completely free of real user passwords. For more advanced examples, check out our guide on masking production data for testing.
Rewriting Hostnames and Headers
Masking request bodies is just one piece of the puzzle. You also need to make sure the replayed traffic actually hits your staging environment, not production. This is another perfect job for middleware. You can easily modify your script to rewrite the Host header to point to your staging server.
Here’s how you could pull it off with a quick Bash script:
#!/bin/bash while IFS= read -r line; do echo “$line” | sed ‘s/Host: my-api.production.com/Host: my-api.staging.internal/’ done
This simple sed command swaps the production hostname for the staging one. It’s also worth noting that beyond just masking data, dedicated API security testing is crucial for finding vulnerabilities before they ever make it to production.
By combining these techniques, you create a testing workflow that is both realistic and secure. You get the benefit of production-like traffic patterns without the risk of data exposure, striking the perfect balance between high-fidelity testing and data privacy.
This approach is a game-changer in enterprise settings. For many IT teams, tools like this can slash test maintenance by up to 95%, which is a huge win for DevOps practices where microservices demand constant, rigorous validation. With the API testing market projected to hit USD 815.34 million by 2026, the need for scalable solutions is undeniable, especially in cloud-based deployments which held a massive 68.5% share in 2023.
Replaying Live Traffic Against Your Staging Environment
You’ve captured and scrubbed your traffic. Now for the fun part: replaying all that real-world user behavior against your staging environment. This is where the magic happens. You stop guessing and start seeing precisely how new code stands up to the chaotic, unpredictable nature of a live production workload.
The whole point is to simulate reality so you can find those nasty bugs, performance regressions, and scaling bottlenecks long before they ever touch a real customer.
It all starts with a single command, telling GoReplay to take your sanitized .gor file and fire it at your staging API endpoint. In an instant, that static file becomes a living, breathing test suite that perfectly mirrors what your users are actually doing.
This flow diagram shows exactly how the process works, keeping your production data safe while delivering high-fidelity traffic to your test environment.
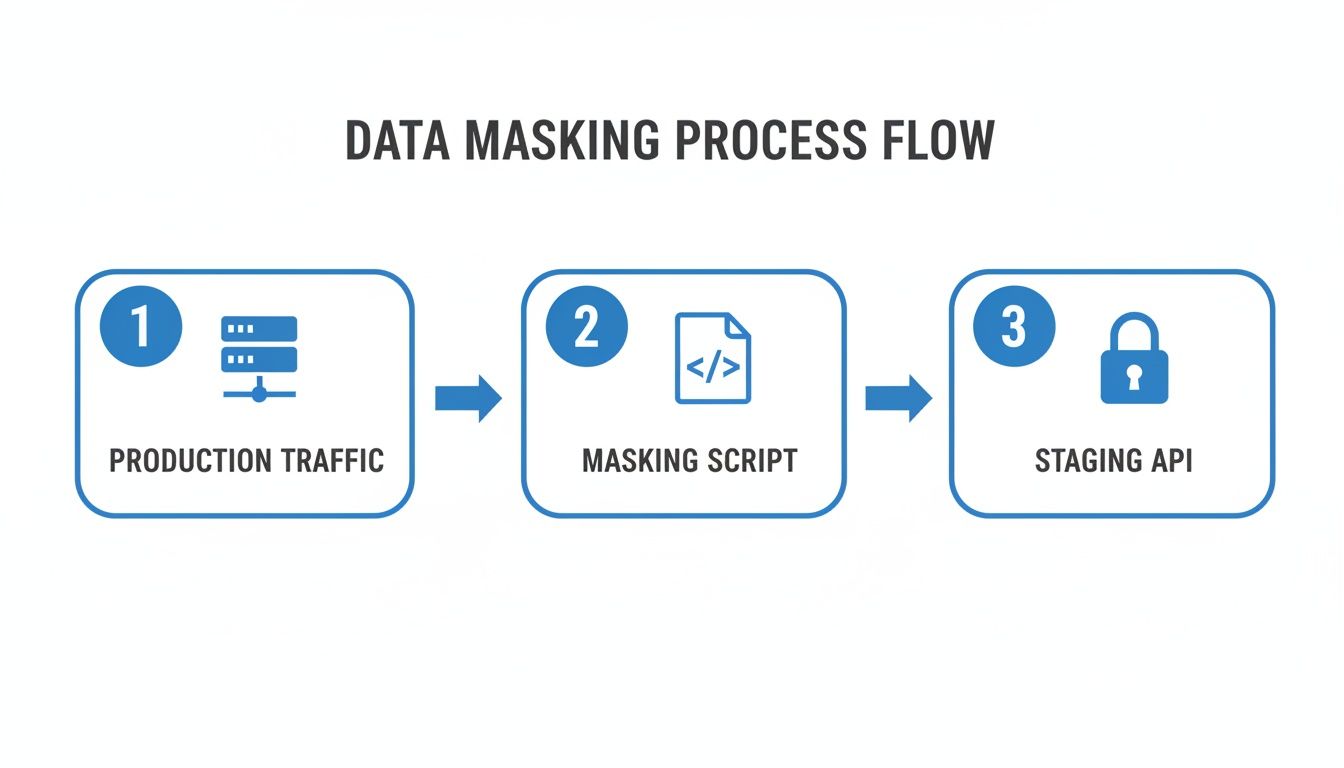
As you can see, the middleware is the critical security checkpoint, making sure no sensitive data ever leaves the production boundary.
Executing the Basic Replay
To get started, you’ll use the --input-file flag for your captured traffic and --output-http to point it at your target. The command is beautifully simple.
Let’s say your staging API lives at http://staging-api.internal. The command would look like this:
gor --input-file requests.gor --output-http "http://staging-api.internal"
Once you run that, GoReplay starts reading every request from requests.gor and sends it to your staging server, perfectly preserving the original timing between requests. This one-to-one replay is fantastic for basic regression testing—it quickly tells you if recent changes broke anything under a normal load.
Simulating Different Load Levels
But here’s where this approach really shines: you can turn a simple replay into a powerful load test just by tweaking one parameter. You aren’t stuck with the captured speed.
GoReplay lets you amplify or throttle traffic using a simple percentage multiplier.
- Stress Test: Want to see what happens at double the traffic? Just add
200%or2xto the--output-httpURL. This is perfect for finding your API’s breaking point. - Baseline Test: Need to simulate a lighter load? Use a value like
50%to get a clearer signal on performance improvements without all the noise.
For a 200% load test, the command is just a small modification:
gor --input-file requests.gor --output-http "http://staging-api.internal|200%"
By simply changing that percentage, you can start answering the really important questions. Can our new feature handle a sudden traffic spike? How does the database hold up when we double the concurrent users? This is how you get ahead of problems.
This kind of proactive testing is essential. In enterprise environments, where 93% of REST API usage demands this level of rigor, being able to safely mimic production is a game-changer. It’s no surprise that while North America currently leads in API testing, the Asia-Pacific market is catching up fast, driven by the explosive growth of microservices. You can dig into the full research on these API management market trends to see where the industry is headed.
To help you get started, here’s a quick rundown of the most common flags you’ll use when replaying traffic.
GoReplay Command Flags for Traffic Replay
| Flag | Purpose | Example Usage |
|---|---|---|
--input-file | Specifies the captured traffic file to read from. | --input-file "production-traffic.gor" |
--output-http | Defines the target HTTP endpoint for replaying traffic. | --output-http "http://test-server.local" |
--http-allow-url | Filters requests, replaying only those with a matching URL path. | --http-allow-url "/api/v2/users" |
--http-disallow-url | Filters requests, excluding any with a matching URL path. | --http-disallow-url "/admin" |
--http-set-header | Adds or overrides a specific HTTP header in replayed requests. | --http-set-header "X-Test-Session: true" |
--middleware | Executes an external script or binary to modify requests on the fly. | --middleware "./mask-pii.py" |
These flags give you granular control, letting you tailor the replayed traffic to fit almost any testing scenario you can think of.
Weaving Traffic Replay Into Your CI/CD Pipeline
Manually replaying traffic is a fantastic way to hunt down specific bugs, but the real magic happens when you automate it. By plugging traffic replay directly into your CI/CD pipeline, you turn a simple diagnostic tool into a full-blown, automated regression and performance testing powerhouse.
The goal here is simple: build a feedback loop where every single deployment gets validated against real-world traffic patterns before it ever sees the light of day.
This kind of automation is no longer a “nice-to-have.” A stunning 83.2% of organizations are moving toward API-first development, yet only a quarter of them are fully there. This gap screams for better tools that connect production realities with our testing environments. With 58% of developers still managing API specs by hand, automating a rest api to test with real traffic is a massive win. You can dig into more insights on the state of API-first development on usetusk.ai.
Imagine this: your CI server builds a new version of your app and pushes it to staging. Immediately, a new job kicks off. This job fires up GoReplay, replaying a pre-captured and sanitized traffic file against your fresh code. Instantly, you know how it holds up.
Automating the Feedback Loop
To get this running, you’ll script the replay process right into your pipeline configuration—think Jenkinsfile, GitLab CI .yml, or a GitHub Actions workflow. The script is straightforward: it just runs the gor command, points the traffic to your staging environment, and then you can analyze the fallout.
This gives you an immediate performance baseline. You can compare response times, error rates, and HTTP status codes between builds. If a new deployment introduces a 5% jump in latency or a sudden spike in 500 errors, the pipeline can fail the build on the spot. No more letting bad code sneak into production.
When you bake traffic replay into CI/CD, testing becomes a proactive gatekeeper, not a reactive scramble. Every commit gets an immediate stress test, giving you real confidence that your changes can handle the pressure.
Handling Stateful Apps with Session Awareness
Of course, most interesting applications aren’t stateless. They depend on user sessions, cookies, and authentication tokens to work. A naive replay that just blasts requests out of order will fall apart fast, generating a ton of noise and false negatives.
This is where GoReplay’s session-aware replay comes in.
It actually tracks individual user sessions, making sure that all requests from a single user are replayed in the exact sequence they originally occurred. This is absolutely critical for accurately testing complex user journeys, like:
- A user logging in, then updating their profile.
- Someone adding multiple items to a shopping cart before finally checking out.
- Any multi-step API workflow that depends on a shared state from previous requests.
This isn’t just a minor feature; it’s what allows your automated tests to truly mirror how real, stateful users interact with your system. It catches the kind of subtle, sequence-dependent bugs that a stateless replay would blissfully ignore. Pair this with some smart request filtering and rate limiting, and your CI/CD pipeline transforms into an incredibly sophisticated and reliable validation engine.
Got Questions About API Traffic Replay?
Whenever you bring a new testing method into your workflow, questions are bound to pop up. When you start replaying live rest api traffic to test your apps, a few common concerns almost always surface. Let’s tackle them head-on so your team can get the most out of this approach without hitting frustrating roadblocks.
One of the first things engineers ask is about performance. Will capturing live traffic slow down our production app?
Thankfully, tools like GoReplay are designed to be incredibly lightweight. They listen to network traffic passively—much like tcpdump—without blocking or getting in the way of the request-response cycle. The performance hit is usually so small you won’t even notice it, making it safe to run continuously even on high-traffic systems.
Another big question is about dealing with encrypted traffic.
How Do You Replay Encrypted Traffic?
The short answer is yes, you can, but it requires a specific setup. Since GoReplay listens at the raw TCP layer, it can’t decrypt TLS traffic on its own. The trick is to position GoReplay on the same machine as your application server or behind your TLS termination point, like a load balancer.
This way, you capture the plain, unencrypted HTTP requests before they get wrapped in TLS. You can then replay these requests against a staging environment that might also be running plain HTTP internally.
The key takeaway here is you don’t need to break production encryption. By strategically placing the capture process, you can get the raw HTTP requests you need securely and efficiently. You get powerful testing insights while keeping your security posture strong.
What About Dynamic Data and IDs?
This is where things get interesting. A huge challenge with replaying traffic is handling dynamic data like session tokens or auto-incrementing IDs. If you replay a POST request to create a user, it’s going to fail the second time because that user already exists.
This is where you need to get clever with traffic manipulation. Here’s how you can solve it:
- Use Middleware: Write a simple script to rewrite unique identifiers on the fly. You can randomize usernames or email addresses for each replay, making every request unique again.
- Reset Your Database: Before each test run, bring your database back to a known, clean state. This ensures you’re always starting from a predictable baseline.
- Filter Out Expected Noise: Configure your tests to ignore expected failures, like a “user already exists” error. Your real focus should be on catching unexpected
500server errors or spotting performance drops.
Successfully using a live rest api to test really comes down to how well you manage state and dynamic data. With the right mix of middleware and environment prep, you can sidestep these challenges and build a reliable, automated testing process that mirrors how your application is actually used.
Ready to stop guessing and start testing with real-world traffic? With GoReplay, you can capture and replay user interactions to find bugs before your customers do. Explore our open-source tool and pro features today at https://goreplay.org.