A Modern Playbook for Your REST API Test Strategy
At its core, a REST API test is all about validating that your API does what it’s supposed to do. It’s about sending requests to your endpoints and then meticulously checking the responses to confirm everything is working—from functionality and performance to security.
This process ensures every part of your API, from creating data to retrieving it, holds up under real-world conditions. It’s a non-negotiable practice for catching bugs before they ever see the light of day in production.
Why Your Current REST API Test Methods Are Incomplete

Let’s be honest for a second. Our traditional API testing methods have some serious blind spots. While tools like Postman are fantastic for unit tests and simple synthetic checks, leaning on them alone can create a false sense of security.
The truth is, the real world is far more chaotic and unpredictable than any scripted test can ever truly anticipate.
The main problem? Manually crafted tests just can’t mimic the complex, often erratic, behavior of real users. These scripts tend to stick to the “happy paths” with a few predictable failure cases thrown in, but they rarely capture the full, messy spectrum of genuine user interactions.
The Problem with Scripted Scenarios
Trying to write a manual REST API test suite that covers every possible edge case is a losing battle. You’ll spend forever trying, and you still won’t get there.
Think about these common headaches:
- Incomplete Coverage: Scripted tests almost always miss the subtle bugs—the ones that only pop up under very specific, concurrent request patterns you only see in production. They can’t replicate the sheer randomness of user timing and weird inputs.
- High Maintenance Overhead: Your API is constantly evolving, which means your test suite needs constant updates. This leads to brittle tests that break with the smallest changes, eating up developer time that could be spent building new features.
- Unrealistic Load Simulation: Trying to simulate production-level traffic with scripts is incredibly difficult. You can’t easily model sudden traffic spikes, the wide variety of request payloads, or the complex dance between different API endpoints that happens organically.
The goal isn’t just to see if an endpoint returns a
200 OK. It’s to confirm that it returns the right200 OKunder the messy, unpredictable conditions of a live environment.
This gap between scripted tests and production reality is exactly where the worst issues hide. Performance bottlenecks, tricky race conditions, and obscure data corruption bugs are notorious for slipping right through the cracks of even the most diligent manual testing efforts.
By admitting these limitations, we can start looking for a more realistic approach. A traffic-based testing method isn’t here to replace your existing unit tests. Instead, it’s meant to supercharge them, adding a layer of validation that truly reflects how your API behaves in the wild.
Preparing Your Environment for Realistic Testing
Before you can run a single meaningful rest api test, you need a reliable, isolated playground. It’s a simple truth: a poorly configured environment leads to flaky tests, false positives, and hours of wasted time. The real goal is to create a staging environment that mirrors production as closely as humanly possible, giving you a high-fidelity space to hunt down bugs without impacting live users.
This goes way beyond just deploying the latest code. I’m talking about replicating your production infrastructure—databases, caches, third-party service integrations, the whole nine yards. Any significant difference between staging and production completely undermines the validity of your tests. Bugs that crop up in one might not even exist in the other, and you’ll be left chasing ghosts.
This focus on realism is driving huge industry growth. The global API Testing Market was valued at USD 1,361.08 million and is on track to hit USD 6,050.36 million by 2032. That explosion reflects the critical need for solid testing in modern CI/CD workflows, where automated validation isn’t a luxury—it’s essential. You can dig into the full analysis of this market trend on maximizemarketresearch.com.
Before you get started, a good checklist can save you a world of hurt. Here’s a quick rundown of what I always make sure is in place.
Essential Environment Setup Checklist
| Component | Purpose | Key Consideration |
|---|---|---|
| Server Access | Allows installation and execution of tools. | Ensure you have sudo/root access on both production and staging servers to install and run GoReplay. |
| Network Configuration | Enables traffic capture and forwarding. | Confirm required ports are open for GoReplay to listen on production and send traffic to staging. |
| Mirrored Infrastructure | Ensures test validity and reliability. | Your staging database, cache, and service versions should match production as closely as possible. |
| Test Objectives | Defines the “why” behind your testing. | Are you hunting for regressions? Validating a new feature? Performance testing? Know your goal. |
| Data Anonymization | Protects sensitive user information. | Have a plan or tool in place to scrub PII from traffic before it hits the staging environment. |
Nailing these fundamentals from the start makes the entire process smoother and your results far more trustworthy.
Your Pre-Flight Checklist
To get started, make sure you have the foundational pieces in place. This isn’t just about software; it’s about having the right access, permissions, and a clear idea of what you’re trying to achieve.
- Server Access: You’ll need sufficient permissions on both your production and staging servers to install and run traffic capturing tools like GoReplay. Without it, you’re stopped before you even start.
- Network Configuration: Make sure the necessary network ports are open. This allows GoReplay to listen to traffic on the production server and successfully forward it to your staging environment.
- Defined Test Objectives: What are you actually trying to validate? Pinpoint your goals. Maybe you’re checking for regressions after a big refactor, validating performance under real-world load, or just making sure a new feature holds up.
A great test environment is one you can trust. If it doesn’t accurately reflect production, you’re just testing an imaginary system. Consistency is the key to confidence.
Installing and Configuring GoReplay
With your environment ready to go, it’s time to install the tool that will capture that precious real-user traffic. GoReplay is incredibly lightweight and designed to have a minimal footprint on your live services, which is exactly what you want.
Installation is usually a breeze, often just a single command on your production server. The real craft is in the configuration. This is where you’ll tell GoReplay which network interface to listen on and, critically, where to send the captured traffic. For a detailed walkthrough, our guide on GoReplay setup for testing environments covers the specific commands and best practices.
Once it’s installed, you’ll configure GoReplay to listen silently on your production server. It will capture HTTP requests and either save them or forward them in real-time to your staging environment. This setup is the foundation for everything that follows—replaying the unpredictable, messy, and totally authentic behavior of your users. It provides a level of testing realism that scripted scenarios simply can’t touch.
Alright, you’ve got your testing environment set up and ready to go. Now for the fun part. This is where we capture the chaotic, unpredictable—and ultimately, real—behavior of your users and turn it into a powerful asset for your REST API tests. We’ll be using GoReplay to listen in on your production traffic, save it, and then unleash it on your staging environment.
The real beauty of this whole approach is how non-invasive it is. GoReplay is engineered to be incredibly lightweight, which means you can capture every single request hitting your production servers without adding any noticeable performance overhead. That’s a massive win. You get a perfect, high-fidelity recording of real-world interactions without putting your live application at risk.
Listening to Your Live API Traffic
First thing’s first: we need to get GoReplay listening on your production server. This is surprisingly simple. All you have to do is run a command that tells GoReplay which network port to monitor—usually the one your API server is on, like port 80 or 443—and where to save the traffic it captures.
A basic command to get started looks something like this:
sudo ./gor --input-raw :80 --output-file requests.gor
Let’s break that down quickly:
--input-raw :80: This tells GoReplay to capture raw TCP traffic from port 80.--output-file requests.gor: And this tells it to save everything it captures into a file namedrequests.gor.
You can just let this command run for as long as you need. A few hours during peak traffic, a full day, or even a week—it’s up to you. The goal is to gather a comprehensive dataset that truly represents your typical user activity. The file you get at the end contains a perfect replica of every API request made during that time.
This is what you’ll see in the GoReplay interface, which gives you all the tools to capture and replay web traffic for some seriously robust testing.
The screenshot gets right to the point: replay real traffic to find bugs before your users do. It’s all about making your updates safer by being proactive with your quality assurance.
Replaying Traffic Against Your Staging Environment
Once you’ve got your requests.gor file, just move it over to your staging environment or any machine that can access it. Now it’s time to run GoReplay in replay mode. This is where you can get creative and start simulating all sorts of different scenarios.
The simplest replay command is straightforward:
./gor --input-file requests.gor --output-http "http://your-staging-api.com"
This command instructs GoReplay to read from your saved file and fire off all the requests to your staging API. But more often than not, you’ll want more control. For instance, you can throttle the replay speed to see how your system handles different load levels. Want to really stress-test things? You can replay the traffic at twice its original speed just by adding a multiplier.
By replaying real user sessions, you move way beyond simple endpoint checks. You’re actually testing the intricate dance between multiple API calls, the timing of concurrent requests, and the complex data patterns that only ever show up with genuine user behavior.
You can also make your tests laser-focused by filtering the traffic. Maybe you only want to test a newly updated /users endpoint. No problem. Just use GoReplay’s flags to include only requests that match a specific URL pattern. This lets you isolate and absolutely hammer a particular part of your application with realistic data.
To get a much deeper look into this, check out our article on how traffic replay improves load testing accuracy. Honestly, this method provides a level of realism that manually crafted scripts just can’t touch, ensuring your tests reflect the genuine demands on your system.
Finding Bugs Through Automated Validation
Replaying traffic to your staging server is a great way to simulate real-world load, but honestly, that’s only half the battle. The real magic in any solid rest api test happens when you can automatically pinpoint what actually broke. Just blasting your server with requests without checking the responses is like shouting into the void—you need a way to listen for the echo and notice when it sounds wrong.
This is exactly where automated validation becomes a game-changer. The core idea is simple: “diffing.” You compare the responses from your staging environment against the original ones you captured from production. This process immediately flags regressions, unexpected schema changes, or new errors that snuck in with the latest code push.
The need for this kind of automation isn’t just a hunch; it’s backed by some serious industry trends. The API Management Market is on track to explode from USD 6.89 billion to an incredible USD 32.77 billion by 2032. A huge reason for that growth? A painful 83% of developers admit that testing bottlenecks are what delay their releases. That makes automated validation less of a luxury and more of a critical investment. You can find more details on how testing impacts the API market on techjury.net.
Pinpointing Functional Regressions
Functional bugs can be the most obvious yet damaging problems you’ll face. A good diffing tool acts like a smoke detector, automatically flagging any mismatch between the production and staging responses and pointing you right to the fire.
Let’s imagine a real-world scenario: a developer refactors the user profile service. When you replay traffic, the staging server returns a 200 OK for /api/users/123, just like it did in production. Everything looks fine on the surface. But the automated diff tells a different story—it reveals the last_login field in the JSON response is now null. That’s a classic regression that could have easily slipped through the cracks.
The whole process boils down to a pretty straightforward flow of capturing, saving, and replaying traffic to create a solid test.
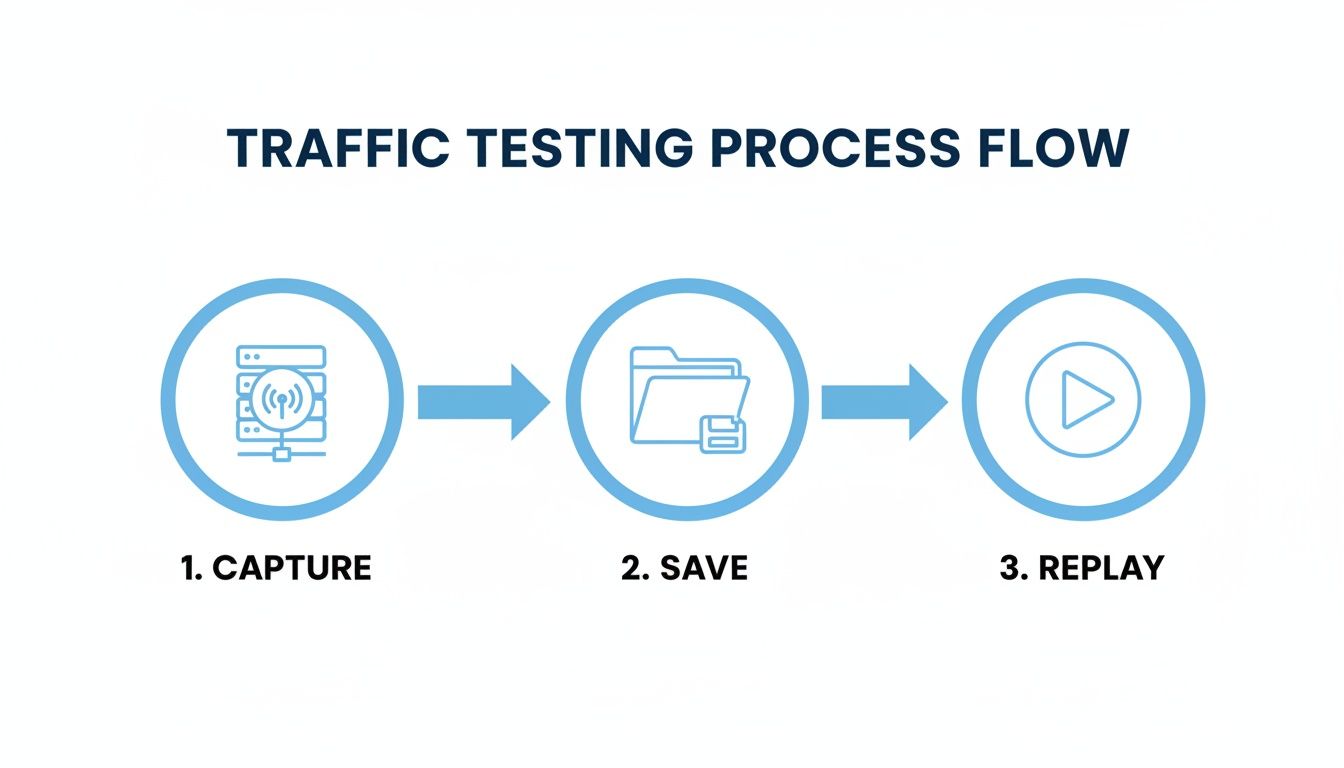
This simple three-step model—Capture, Save, Replay—is the bedrock of any realistic and repeatable testing strategy. It just works.
Monitoring Performance Metrics
Functional correctness is one thing, but your API’s performance is just as crucial. A sudden jump in response time can be as bad as a 500 error for your users. While you’re replaying traffic, you absolutely have to be monitoring key performance indicators (KPIs) at the same time.
Here are the metrics I always keep an eye on:
- Latency: You need to measure both the average and the 99th percentile (p99) response times. A spike in p99 latency is a huge red flag. It means your slowest requests are getting even slower, which often points to a bottleneck getting squeezed under load.
- Error Rate: Watch the percentage of non-2xx status codes like a hawk. If that error rate starts creeping up during a replay, it’s a clear signal that your new build is less stable than what’s currently in production.
- Throughput: Keep track of the number of requests per second your staging environment can handle. If it drops off a cliff compared to your production benchmarks, you’ve likely got a scalability problem on your hands.
By combining functional diffing with performance monitoring, you create a comprehensive quality gate. This ensures that new code not only works correctly but also performs efficiently under the stress of real-world user traffic.
This dual-pronged approach transforms your REST API test from a simple “does it work?” check into a robust validation process. It gives you the confidence to deploy changes, knowing they’ve been thoroughly vetted against realistic conditions, catching both subtle data errors and critical performance slowdowns before they ever have a chance to impact your users.
Advanced Strategies for Complex Applications
Once you’ve got a handle on capturing and replaying basic traffic, it’s time to level up. Real-world applications are messy—they’re full of sensitive data, complex user sessions, and they live inside automated deployment pipelines. To build a truly solid quality gate for your REST API test strategy, you have to tackle these challenges head-on.
Many applications, by their nature, handle personally identifiable information (PII) like names, emails, and financial details. Simply replaying that raw data into a staging environment is a huge no-go, thanks to privacy laws and internal security policies. This is exactly where data masking and request rewriting become your best friends.
Handling Sensitive Data and Dynamic Tokens
The whole point is to keep the test realistic without compromising on security. You want the structure of the original request, but you need to sanitize the sensitive bits. You can set up middleware to modify traffic on the fly, either as you’re saving it or just before replaying it.
This usually boils down to a couple of key actions:
- Data Masking: Find and replace sensitive values automatically. A common trick is to use regular expressions to swap out all email addresses in a request payload with a generic placeholder like
[email protected]. - Request Rewriting: Tweak headers or body content to fit the staging environment. This is absolutely critical for things like authentication tokens, which are usually short-lived and totally useless by the time you get around to replaying traffic. A simple rewriting rule can replace those expired production tokens with fresh, valid staging tokens.
By mastering data masking and rewriting, you make your tests both secure and effective. You get all the benefits of realistic traffic patterns without ever exposing sensitive user data or having your tests fail because of broken authentication flows.
This security-first mindset isn’t just a “nice-to-have” anymore. With API attacks having surged by a massive 400% between 2021 and 2023, the market for API Security Testing Tools is on track to explode from USD 1.09 billion to an incredible USD 9.65 billion by 2032. It’s a clear signal that we need to validate security just as rigorously as we validate functionality. You can read more about this explosive growth at Fortune Business Insights.
Creating Stateful Tests with Session-Aware Replay
So many applications are stateful. Think about a typical e-commerce flow: a user logs in, adds a few items to their cart, and then checks out. These actions are sequential and all depend on a persistent user session. A simple, stateless replay would just see a bunch of isolated requests, completely missing the context of that user’s journey.
Session-aware replay is the answer. It groups requests together based on a session identifier, whether that’s a session cookie or a user ID tucked away in the payload. This ensures that all requests from a single user’s journey are replayed in the right order and, just as importantly, are sent to the same server instance in your staging cluster. This is how you accurately test complex workflows like multi-step registration forms or an entire e-commerce checkout process.
Integrating into Your CI/CD Pipeline
Ultimately, the goal is to get this all automated. When you integrate traffic-based testing directly into your CI/CD pipeline, it stops being a manual chore and becomes an automated quality gate that runs on every single build.
Here’s what that looks like in practice:
- Trigger on Deploy: Your CI/CD tool—whether it’s Jenkins, GitLab CI, or GitHub Actions—kicks off a deployment to your staging environment.
- Initiate Replay: As soon as the new build is live, the pipeline automatically triggers a GoReplay job to run a pre-captured set of traffic against it.
- Validate and Report: The test runs, comparing the new responses and performance metrics against a known good baseline.
- Promote or Fail: If everything passes, the build gets the green light to be promoted. If any regressions are detected, the pipeline fails, stopping buggy code dead in its tracks before it can ever see the light of production.
When you first start thinking about traffic-based testing for your APIs, a few questions always pop up. It’s a totally different mindset, shifting from perfectly manicured test scripts to the messy, unpredictable reality of production traffic. Let’s dig into the most common concerns I hear from teams.
The first thing everyone wants to know is, “Will capturing live traffic slow down my production server?” It’s a great question, and the answer is almost always no. Modern tools like GoReplay are designed from the ground up to be incredibly lightweight. They operate at the network level, just listening in on the conversation without actually getting involved. The performance hit is so small, you’d be hard-pressed to even measure it.
Next up is security. “What about sensitive PII or auth tokens?” Replaying raw production traffic straight into a staging environment is a huge security no-go. This is where the smart features come in. You need tools that support on-the-fly data masking and request rewriting. This lets you set up rules to automatically find and replace sensitive data before it ever leaves the production environment, giving you realistic tests that are completely secure.
How Does This Fit With My Existing Tests?
People often assume this approach is meant to replace their existing unit and integration tests from tools like Postman. That’s definitely not the case.
Traffic-based testing isn’t a replacement; it’s a powerful complement. Your unit tests are still perfect for verifying the logic of individual components in isolation. Traffic replay, on the other hand, excels at validating the entire system under the complex, unpredictable load patterns that only real users can generate.
Think of it as a layered testing strategy:
- Unit Tests: Does this one specific function do its job correctly?
- Integration Tests: Can these two services talk to each other without breaking?
- Traffic-Based Tests: Can the entire system handle thousands of real users hammering it at once during peak hours?
Finally, there’s the practical question: “How much traffic do I really need for this to be useful?” You don’t need to capture everything, all the time. A great starting point is to grab a few hours of traffic during a peak usage window. That alone will give you a fantastic dataset covering your most common user journeys and heaviest load. As you get more advanced, you can build a whole library of traffic files to simulate different scenarios, like a Black Friday sale or a massive new feature launch.
Ready to make your API testing truly reflect reality? GoReplay lets you capture and replay real user traffic to find bugs before they hit production. Start testing with real traffic today.