Mastering GoReplay for Response Time Tests
Response time tests are all about one thing: measuring how long your system takes to answer a user’s request. Running these tests is absolutely critical for understanding the real-world user experience because slow applications kill customer loyalty and, ultimately, revenue.
Why Realistic Response Time Tests Matter

Before we jump into the “how-to” with a tool like GoReplay, let’s get grounded in why this type of testing is so fundamental. This isn’t just an academic exercise in shaving milliseconds off a load time; it’s about the very real business outcomes tied to your app’s speed and reliability.
In today’s market, user patience is razor-thin. A slow checkout process, a laggy API call, or a dashboard that spins forever—these are all direct paths to user abandonment. It’s why over 50% of users will bounce if a site takes longer than three seconds to load. If you want to dig deeper, Testsigma’s research on how response time impacts retention is a great read.
The Limits of Synthetic Testing
A lot of teams begin their performance journey with synthetic tests. They script out common user journeys to simulate traffic, and while that’s a decent starting point for a baseline, it has a massive blind spot: it almost never captures the chaotic, unpredictable nature of actual users.
Synthetic tests tend to follow the “happy path” and miss the subtle but critical issues that crop up in the wild. They just don’t account for:
- Unexpected user behavior: People clicking buttons in weird sequences, double-submitting forms, or navigating in ways you never dreamed of.
- Diverse request payloads: Real-world API calls are full of varied data, and some of it will inevitably trigger edge cases your database isn’t optimized for.
- Concurrent action hotspots: Real traffic creates intense, simultaneous pressure on specific resources—something scripted tests often smooth over and miss entirely.
This is exactly the gap that real-traffic replay tools were built to fill. Instead of guessing how your users might act, you capture how they actually act. It’s the only way to get a truly authentic performance baseline.
By replaying real, captured traffic, you move from simulation to emulation. You’re not just testing against a hypothesis of user activity; you’re testing against the ground truth of how your application is used day-to-day.
Understanding Your True Performance Baseline
When you use real traffic, you start uncovering bottlenecks that only surface under genuine load conditions. For instance, a synthetic test might report that your main product API responds in a crisp 200ms. But a real-traffic replay could reveal that for 10% of users—the ones pulling large, complex query results—the response time suddenly balloons to over two seconds.
This is the kind of insight that helps you prioritize what to fix. It transforms the conversation from “let’s make things faster” to “let’s fix this specific, user-impacting problem.” By running realistic response time tests, you gain the confidence that your system can handle the messy, nuanced reality of production traffic before you ship your next big change.
Getting Your Environment Ready for GoReplay
Jumping into response time tests without a solid foundation is a recipe for disaster. Before you can capture and replay real traffic, you need to get your environment configured correctly. This isn’t just a formality—it’s the single most important step to ensure your tests are accurate, safe, and don’t disrupt your live services.
Getting started with GoReplay is pretty straightforward, but you do need to pay close attention to server permissions and network configuration. The machine where you install GoReplay has to be able to listen to the network traffic heading for your application server. Often, this means running GoReplay on the same machine as your app or on a network gateway that sees all the relevant traffic.
Initial Installation and Setup
First things first, you need to get the GoReplay binary installed. It’s a self-contained executable, which makes life a lot easier—no wrestling with complex dependencies. Just grab the right version for your OS from the official source.
Once it’s downloaded, you’ll need to grant it the right privileges to capture network packets. On Linux, this usually involves sudo or setting specific network capabilities like CAP_NET_RAW and CAP_NET_ADMIN for the binary. This is a great security practice because it lets GoReplay monitor network interfaces without you having to run the whole process as root. For a deeper dive, our guide on GoReplay setup for testing environments has the specific commands and configs you’ll need.
Configuring the Traffic Listener
With GoReplay installed, the next job is to tell it what traffic to listen to. This is where you point it at the network interface and port your application uses. If you have a standard web app running on port 80, for example, you’d set up GoReplay to capture all the incoming traffic on that port.
This is what the GoReplay interface looks like in action—it’s all about capturing and replaying traffic seamlessly.
The screenshot really gets to the core of what makes this tool so valuable: using real traffic for incredibly robust testing. This helps you find bugs before they ever have a chance to impact your users. It’s all about mirroring production behavior to create tests you can actually trust.
A good starting point is a simple command telling GoReplay to listen to a network interface (like eth0) and dump the captured traffic into a file.
sudo ./gor --input-raw :8080 --output-file requests.gor
This little command fires up a listener on port 8080 and writes every single request it sees into a file named requests.gor. To make sure it’s working, just send some traffic to your application and watch the file size of requests.gor grow. This confirmation step is crucial—it proves your setup is capturing data correctly before you dive into more complex replay scenarios.
Getting the environment right from the start saves countless headaches down the road. A clean, verified capture is the bedrock of any reliable response time test. Rushing this stage almost always leads to skewed results or, even worse, tests that just fail to run.
This initial setup paves the way for the powerful capture-and-replay workflows that make tools like GoReplay so essential. The emphasis on realistic testing reflects a huge industry trend. In fact, the automation testing market is projected to skyrocket from USD 25.43 billion in 2022 to USD 92.45 billion by 2030, according to insights from Precedence Research. This growth just underscores the massive demand for efficient, reliable software delivery—a goal that robust testing directly supports.
Capturing and Replaying Real User Traffic
With your test environment ready, it’s time to get into the heart of realistic response time tests: capturing live traffic. This is where theory meets the messy reality of actual user behavior. By recording real production requests, you’re creating a high-fidelity asset you can use again and again to validate performance.
The idea is simple: listen to the network traffic your application receives and save it to a file. Think of it like a flight recorder for your web server. It logs every interaction without getting in the way of the live system. This capture file becomes the raw material for all your tests—a powerful tool for regression testing and pre-deployment checks.
Starting Your First Traffic Capture
Getting a capture started is usually just a single command. The trick is telling it exactly what to listen to (the network interface and port) and where to put the results (your output file). This direct approach saves you from writing complex synthetic test scripts that can only guess at what users are really doing.
Here’s a basic command to listen on a specific port and save the traffic:
sudo ./gor --input-raw :80 --output-file="production-traffic-$(date +%Y-%m-%d).gor"
This command tells GoReplay to listen to all traffic on port 80 and save it to a file stamped with today’s date. Adding a date to the filename is a simple but incredibly useful habit for keeping your captures organized. It makes finding traffic from a specific day way easier when you’re trying to track down a reported issue.
A common mistake is capturing traffic for too short a period. To get a truly representative sample, you should aim to capture over at least a full business cycle—maybe a full 24-hour period—to make sure you record both peak and off-peak usage patterns.
This visual breaks down the basic workflow for getting started, from the initial setup right into the capture phase.
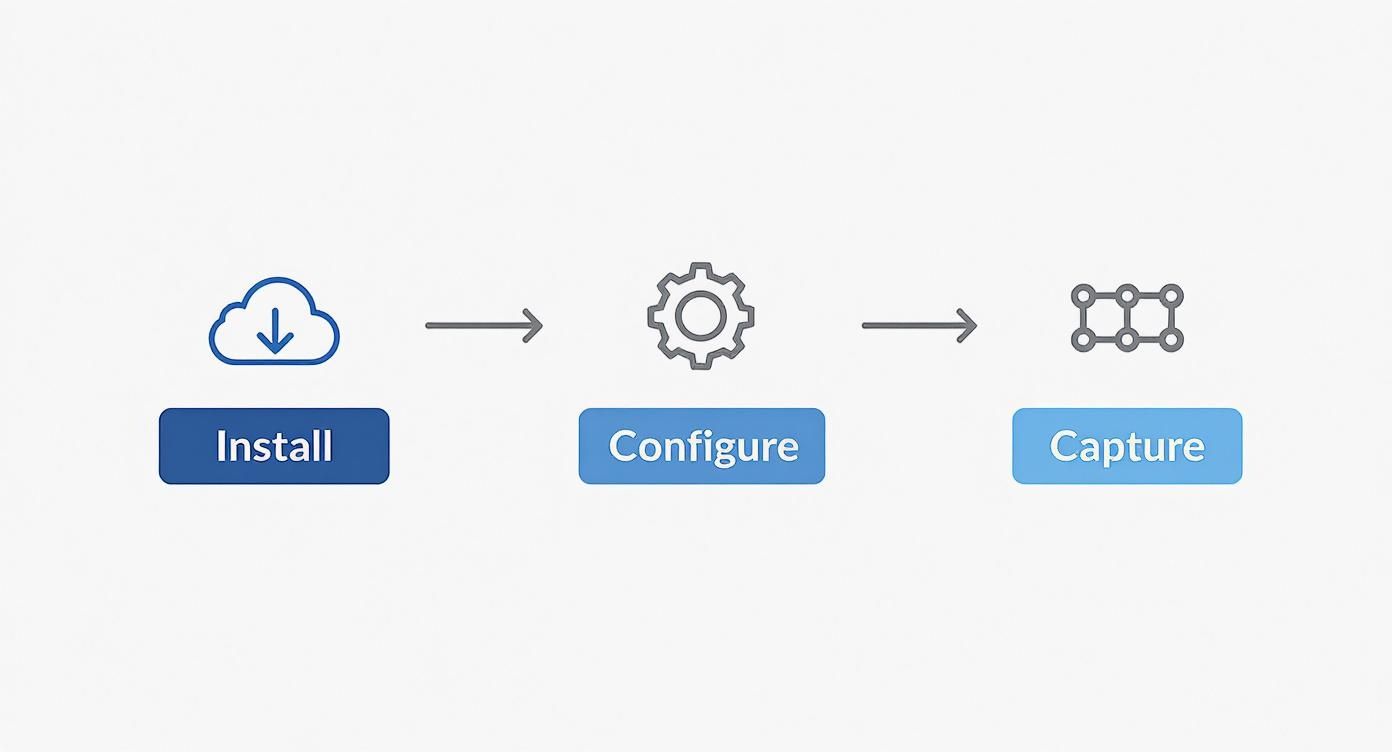
The diagram simplifies the process into three core stages—Install, Configure, and Capture—showing how each step builds on the last to create a solid, repeatable testing foundation.
Replaying Traffic Against a Test Environment
Once you have a capture file, you can play it back against a non-production environment. This is the moment of truth where you actually run your response time tests. The goal is to send that recorded traffic to a staging or development server and see how it holds up under a realistic load.
A simple replay command just needs your capture file as the input and your staging server’s address as the output.
./gor --input-file "production-traffic-2023-10-26.gor" --output-http "http://staging.server.address"
This command reads the requests from your file and forwards them to the staging server. Crucially, the replayed traffic mirrors the original timing and sequence of requests, giving you an authentic simulation of your production load on the system you’re testing.
Advanced Control Over Replay Speed and Filtering
You don’t always have to replay traffic at its original speed. Sometimes you need to push your system harder to find its breaking point or simulate a sudden traffic spike. GoReplay lets you crank up the speed to amplify the load.
Want to double the traffic rate? Just use a rate-limiting flag:
./gor --input-file "capture.gor" --output-http "http://staging.server" --output-http-rate-limit 200%
This command sends requests at 200% of their original speed, effectively simulating twice the number of users. This is invaluable for capacity planning and discovering how your system behaves just past its current peak load.
You can also filter the traffic to zero in on specific parts of your application. For example, maybe you only care about the performance of your API endpoints.
--http-allow-url /api/: Replays only requests where the path contains “/api/”.--http-disallow-url \.css: Ignores all requests for CSS files, letting you focus on dynamic application logic.--http-allow-method POST: Useful for replaying only form submissions or other data-creation events.
These filtering options give you incredible control, allowing you to isolate specific user journeys or system components for targeted performance analysis. This precision helps you move from just monitoring general performance to diagnosing specific bottlenecks in your application. By combining capture, replay, and these advanced controls, you build a robust and repeatable process for ensuring your application is fast, reliable, and ready for whatever your users throw at it.
Anonymizing Sensitive Data During Tests

Using production traffic for response time tests gives you incredibly high-fidelity results, but it comes with serious ethical and legal responsibilities. The moment you capture real user requests, you’re handling sensitive data—personal identifiers, credentials, and other private information.
Protecting this data isn’t just a good idea; it’s a must-have for maintaining user trust and complying with regulations like GDPR. A performance test should never become a security incident.
This is where data masking and anonymization are non-negotiable. The goal is to keep the structure of the traffic—the request patterns, endpoints, and payload sizes—while completely scrubbing any personally identifiable information (PII).
Luckily, tools like GoReplay are built for this exact challenge. It lets you intercept and modify traffic on the fly using middleware before it gets replayed, acting as a sanitization layer that keeps your tests both effective and secure.
Implementing Middleware for Data Scrubbing
GoReplay’s middleware feature is your go-to for data protection. It works by passing each captured HTTP request through an external script you control. This script can inspect everything—the request body, headers, and URL—and change them according to your rules.
Think about a user logging in. The captured traffic contains their email, password, and maybe a session token. Replaying that request as-is would send real credentials to your staging server. That’s a massive security risk.
A simple middleware script, written in something like Python or Go, can intercept that request and take a few critical actions:
- Hash User Identifiers: Instead of a real
user_id, the script can apply a consistent hash (like SHA-256) to it. This anonymizes the ID but ensures all requests from that same user stick together, keeping session logic intact. - Replace Credentials: Use regular expressions to find email addresses and password fields, then swap them with placeholder values like
[email protected]andfakepassword123. - Scrub Authorization Tokens: Sensitive session cookies or
Authorizationheaders with JWTs can be stripped out entirely or replaced with a valid, non-production token for your staging environment.
This approach gives you fine-grained control, transforming raw, sensitive traffic into a safe and compliant test suite.
Practical Data Masking Techniques
Putting this into practice just takes a bit of configuration. You’ll need to tell GoReplay to pipe its traffic through your custom script, which is usually done with a simple command-line flag pointing to your middleware executable.
Let’s say you have a JSON payload with user info. Your middleware script would just need to parse this JSON, find the sensitive keys, and replace their values.
Here’s a sample command that sends traffic through a Python script for sanitization:
./gor --input-file "capture.gor" --middleware "python sanitize_payload.py" --output-http "http://staging.server"
Inside sanitize_payload.py, you’d read the request from standard input, make your changes, and write the modified request back to standard output. It’s an incredibly flexible workflow that lets you build sophisticated anonymization rules specific to your app’s data structures.
The core principle of effective data masking is to be aggressive. When in doubt, scrub it out. It’s far better to accidentally anonymize a non-sensitive field than to risk leaking even a single piece of user data. A robust process is your best defense.
The complexity of this can vary a lot. For a deeper dive into more advanced strategies, check out our guide on data anonymization techniques for more insights and code examples. By building a solid, automated sanitization process, you can confidently run realistic response time tests without ever compromising on privacy or security.
Analyzing Results and Identifying Bottlenecks

Running your response time tests and gathering all that raw data is really just the beginning. The true magic happens when you start digging into those results to find the story they’re telling. This is how you turn a bunch of numbers into concrete actions that make your application faster and more dependable.
One of the most common—and dangerous—mistakes is to just glance at the average response time. Averages are notorious for hiding serious issues that hammer a small but vital group of your users. For instance, an average of 300ms might look perfectly fine on a dashboard, but it could be masking a painful reality where 5% of requests are taking over three seconds to complete.
Looking Beyond the Average
To get a real feel for what your users are experiencing, you have to look at percentiles. These are the metrics that shine a spotlight on the outliers and reveal the worst-case scenarios people are actually hitting.
- 95th Percentile (p95): This number tells you that 95% of requests were faster than this value, while the other 5% were slower. This is the metric most engineering teams I’ve worked with use to track their service-level objectives (SLOs).
- 99th Percentile (p99): This one is even stricter, showing the experience of the slowest 1% of requests. When you fix problems at the p99 level, you’re directly improving the experience for your most frustrated users.
There’s plenty of statistical analysis to back this up. Performance data almost always has long tails, which makes the average a pretty misleading metric. By focusing on the mean, you completely miss the big problems affecting a minority of users. The 99th percentile, on the other hand, gives you a brutally honest look at the worst-performing cases. For a deeper dive, check out this fantastic in-depth discussion on performance metrics.
A low average response time paired with a high p99 is the classic signature of an inconsistent user experience. It means most people are having a decent time, but a small group is hitting a performance brick wall. Find the root cause of that p99 latency, and you’ve often found the key to a massive improvement.
Correlating Slow Responses to Root Causes
Once you’ve used percentiles to confirm a problem exists, the real detective work begins: finding out where it’s happening. The goal is to connect those slow response times to specific actions or parts of your system. You can start by asking some targeted questions:
- Is the high latency isolated to a single API endpoint, like
/api/v2/search? - Does the slowness only pop up on
POSTrequests that have to write to the database? - Are all the slow requests coming from users who have a ton of data associated with their account?
By slicing and dicing your test results, you can start to isolate the trouble spots. For example, if you see that every request to your /users/{id}/profile endpoint is sluggish, you’ve just narrowed your investigation from the entire application down to a single function. That’s your starting line for digging into the code or database queries for that specific endpoint.
When you visualize this data on a dashboard, these patterns tend to jump right out, turning a sea of numbers into a clear roadmap for your debugging efforts.
To help you get started, here’s a quick-reference guide I’ve put together over the years to help diagnose the root cause of slow response times you might uncover.
Common Performance Bottlenecks and Their Causes
| Symptom | Potential Cause | Where to Investigate |
|---|---|---|
| High p99 latency, low average | A few very slow operations, garbage collection pauses, or network timeouts for specific requests. | Application logs for outlier requests, JVM/CLR metrics, specific API endpoint performance. |
| All requests are slow under load | CPU, memory, or I/O saturation. The entire system is overwhelmed. | System-level metrics (CPU/RAM usage), database connection pool stats, network bandwidth. |
| Specific API endpoints are slow | Inefficient database queries (N+1 problems), slow external API calls, complex business logic. | Code profilers, database query logs (EXPLAIN plans), distributed tracing for external calls. |
POST or PUT requests are slow | Database write contention, disk I/O bottlenecks, slow transaction commits, indexing overhead. | Database lock monitoring, disk performance metrics (iostat), table indexing strategies. |
| Initial requests are slow, then speed up | ”Cold start” problems, just-in-time (JIT) compilation, cache warming issues. | Application startup logs, cache-hit ratio metrics, connection pool initialization. |
Hopefully, this table gives you a solid starting point. The key is to use the data from your tests to form a hypothesis, and then use your monitoring and profiling tools to prove or disprove it. Happy hunting
Common Questions About Response Time Tests
When teams first dip their toes into realistic response time tests, the same questions and hurdles pop up again and again. It’s a natural part of moving from clean, synthetic scripts to the messy reality of replaying real user traffic.
Getting ahead of these common blockers is key. Let’s clear up the confusion so you can get a smoother, more effective testing workflow up and running.
Response Time Tests Versus Load Tests
One of the first things people mix up is the difference between a response time test and a load test. They’re related, sure, but they have completely different goals.
Think of it this way: a response time test is a checkup. A load test is a stress test.
Response time tests are all about measuring the speed of individual requests under normal, everyday traffic. The main metric here is latency—how long does the server take to answer a single request? The focus is entirely on the user experience during typical operations.
Load tests, on the other hand, are designed to find your system’s breaking point. You’re pushing the application with heavy, sustained traffic to see how much it can handle before it slows to a crawl or falls over. The metrics that matter here are throughput (requests per second) and resource utilization like CPU and memory.
What Is a Good Response Time?
Ah, the million-dollar question. The only honest answer is: it depends. There’s no magic number that works for every application because user expectations are completely different depending on the context.
That said, some widely accepted guidelines give you a solid place to start.
Generally, people perceive speed in these buckets:
- Under 100ms: Feels instantaneous.
- 100ms - 300ms: A slight delay, but still feels quick and responsive.
- 300ms - 1s: A noticeable pause, but usually acceptable for more complex actions.
- Over 2 seconds: This is where users get frustrated and abandonment rates start to spike.
For an e-commerce site, every millisecond can impact conversion rates. For an internal back-office tool, a one-second response might be perfectly fine. The best practice is to set a “performance budget” based on your business goals and then test to make sure you’re staying within it.
Testing Directly on Production Environments
So, can you just run these tests on your live production servers? The answer is a short and emphatic no. It might seem like the most realistic option, but it is incredibly risky.
Replaying traffic against a live environment—even at its original speed—can cause absolute chaos. You could accidentally duplicate credit card charges, corrupt customer data, or blow through rate limits with third-party APIs your application relies on. Just imagine replaying a captured session where a user placed an order. You’d be placing that same order all over again.
The gold standard is to always replay traffic against a dedicated, isolated staging or pre-production environment. This environment needs to mirror production as closely as possible—same hardware specs, same software versions, and similar data scale. This gives you a safe sandbox for realistic testing without putting your live users or your business at risk.
Handling Dynamic Tokens and CSRF Protection
Here’s a big technical hurdle you’ll hit almost immediately: security tokens. Your captured traffic is full of expired session cookies, one-time-use numbers (nonces), and Cross-Site Request Forgery (CSRF) tokens that are no longer valid.
When you replay these stale requests, your application’s security layers will do their job and reject them, causing your entire test to grind to a halt.
The solution is to modify the requests as they are being replayed. By using a middleware script, you can intercept each request on the fly, just before it hits your staging server, and update its authentication tokens in real-time.
For example, your middleware could:
- Grab a request from the replay tool.
- Strip out the old, expired
Authorizationheader. - Make a quick API call to your auth service to get a fresh, valid token for a test user.
- Inject this new token back into the request’s header.
- Send the modified request on its way to the staging server.
This dynamic rewriting makes sure every replayed request is properly authenticated. It’s an absolutely critical step for accurately testing any modern, secure web application.
At GoReplay, we know the only way to be sure your application is ready for the real world is to test it with real traffic. By capturing and replaying actual user interactions, you can find those hidden bottlenecks and fix problems before they ever see the light of day. Start testing with real traffic today using GoReplay.