
10 Production Testing Software Tools Compared for 2026
A passing test run proves the cases someone thought to write still pass. It says nothing about the request a mobile client fires when a user backs out of checkout mid-payment, or the retry storm that starts when a cache expires under load. Production testing software exists to close that gap, by recording real traffic or generating something close enough to expose what your scripted suite never imagined.
The cost of missing it is documented. NIST found that identifying and correcting defects during development accounts for roughly 80% of software-development costs, and estimated that inadequate software-testing infrastructure cost U.S. manufacturing and service industries about $59.5 billion annually in its economic-impact study of software testing. The number that matters is timing, not the total.
Buying a tool is the easy half. The harder half is deciding who owns the work and what evidence authorizes a release, which is the same problem as scaling engineering capacity for startups.
So this list sorts by the failure each tool catches: behavior drift in replay, capacity limits under load, dependency surprises, release exposure, resilience under injected faults. Every entry names what it records versus what it simulates, and what it costs in setup time as well as money.
1. GoReplay
GoReplay records live HTTP requests and replays them against an isolated test service. The failure it catches is drift: a build that passes every scripted case but answers real request shapes differently. The test workload is your production workload, same paths, same payload shapes, same timing spread, no scripting. That is the difference between testing what users do and testing what someone remembered to write down.
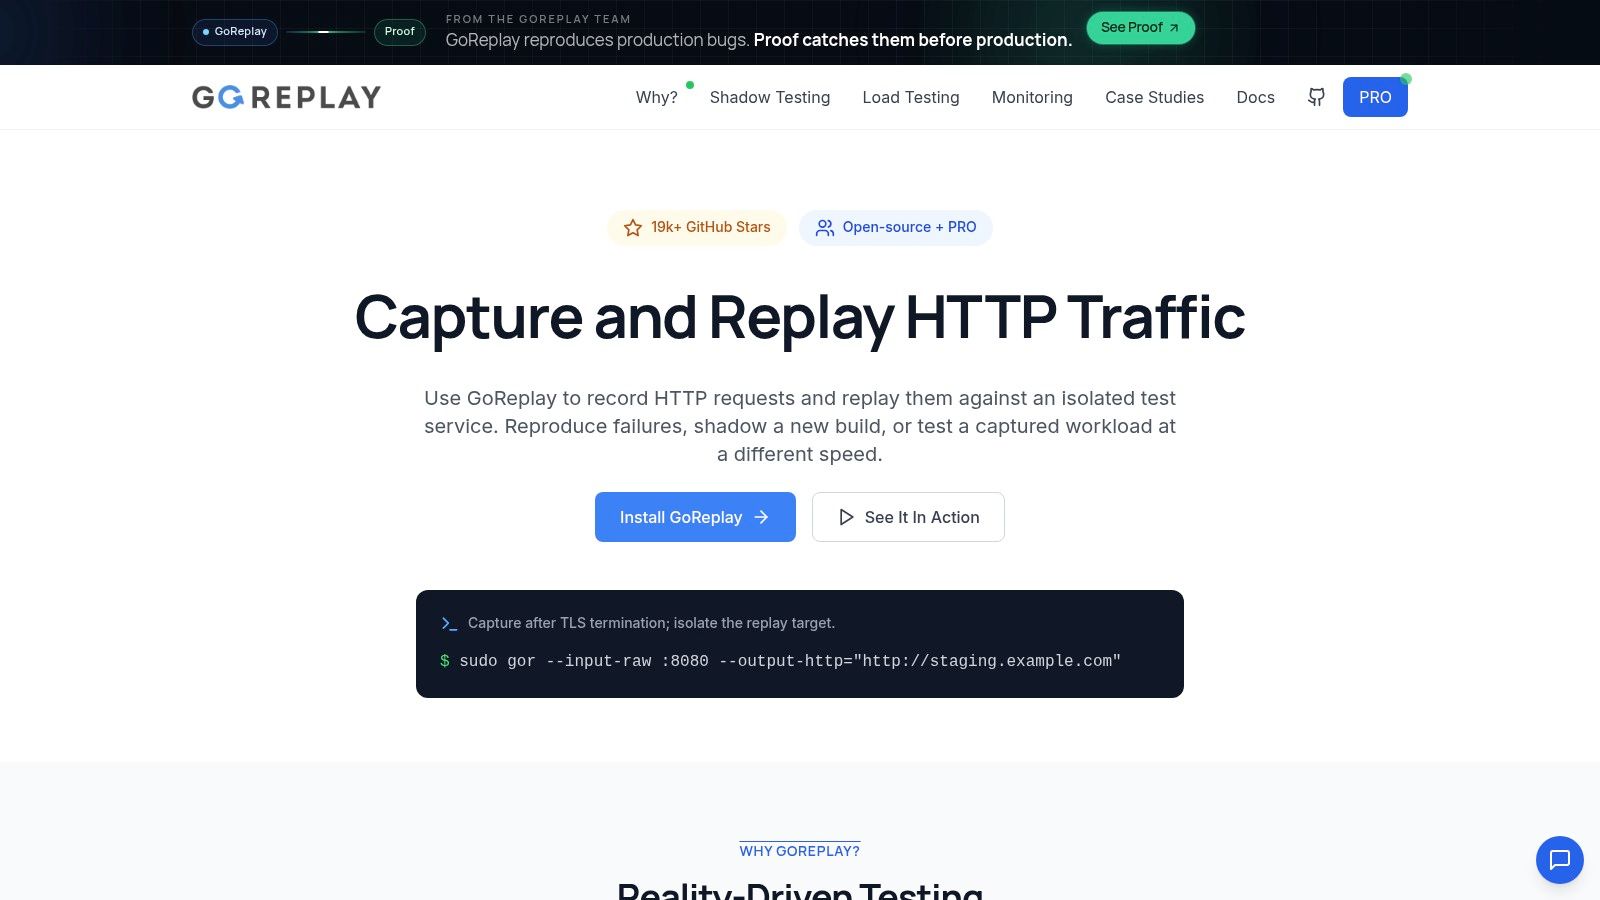
The setup work is real, and most of it is boundaries. Capture needs a plaintext point, which in practice means after TLS termination, and the replay target must be cut off from live payment, email and partner systems. Strip the requests that make no sense to repeat, rewrite the sample so external side effects stay controlled, and measure capture overhead before you leave it running in production for a week.
Where the evidence comes from
A clean replay run shows the new build tolerated the sampled traffic. Correctness is a separate question, and it lives in the comparison step. Replay at a chosen speed, watch latency, error rates and resource limits, and diff responses and application state where you expect stability rather than drift.
Interop decides most purchases in this category. An industry survey on testing in DevOps found 88% of organizations use at least two testing tools, with 23% using five or more, and 62% allocating budget to test automation and AI-assisted testing. Replay has to sit beside CI/CD, observability and test management, not replace them. The same survey reports that 50% of organizations with fully adopted DevOps practices see at least a 50% increase in release speed, which is directional vendor-survey evidence rather than a census.
Pricing splits the decision. The open-source edition is free under LGPLv3 and covers HTTP traffic capture and replay, request filtering, rewriting and middleware, a command-line interface and community support. PRO costs $2,950 per year before applicable taxes, and adds S3 capture storage and replay, keep-alive TCP session recognition, dedicated support and a commercial license on top of it.
The strongest reference case is capacity planning, not bug hunting. “Using GoReplay, we were able to accurately estimate our infrastructure requirements and highlight the flaws in our prospective setup,” said Lewis at ResDiary, whose team validated its setup before migrating the UK and Australia regions from RackSpace to Azure.
Practical rule: record read-only journeys first, search and listing and product detail, and prove your comparison step works before replaying anything that writes.
- Real request patterns: the workload reflects production payloads and sequences instead of assumed ones.
- Multiple jobs from one capture: bug reproduction, controlled-speed load testing and version comparison.
- Capture cost: you need a plaintext point after TLS termination, and a strictly isolated target.
- Price: PRO at $2,950 per year is meaningful for a small team, even with the free edition available.
Website: goreplay.org
2. Speedscale
Speedscale captures traffic, then does what most replay tools skip: it mocks the dependencies your service calls, so a replayed request doesn’t fail just because the test environment can’t reach the payment gateway. Capture runs through a sidecar, proxy, PCAP, eBPF or logs, which matters in clusters where adding a listener is politically difficult.
What it’s for, and what to measure
Microservice teams that want recorded behavior without hand-authoring every scenario. The free local proxymock lets you record and mock on a laptop before anyone signs a contract, which is the right way to evaluate it.
Replay volume is the wrong metric. In a DevTestOps survey on test automation, teams reporting “amazing” customer happiness automated about five test categories in their CI/CD pipelines on average, against two among teams reporting “terrible” happiness. The useful measure is risk-weighted coverage: which high-value journeys are represented, how many endpoints and parameters, what share of sessions replay cleanly. Fidelity matters just as much, covering ordering, timing, authentication state and stateful workflows. A thousand replays of the same GET prove nothing.
- Dependency mocking: the feature that keeps replay from collapsing in a sealed test environment.
- Transformation and redaction: data masking lands on paid plans, so privacy work is budgeted, not assumed.
- Opaque pricing: plan pricing and traffic allowances aren’t published, so cost discovery is a sales conversation.
- Free tier limits: cloud collaboration and advanced replay controls aren’t in the local tool.
Website: Speedscale
3. Keploy
Keploy records application and dependency interactions and converts them into reusable tests and mocks. Capture is eBPF-based, so nothing changes in your application code, and the recorder picks up API calls plus supported database, queue and gRPC traffic across Go, Java, Python and Node.js.
The honest limit is scope. Recorded behavior gives you regression coverage of what ran, not requirement coverage of what should run. It won’t invent a negative test for a coupon that should expire at midnight, and it won’t know that a discount stacking rule is wrong if production is wrong in the same way. Treat it as the floor under a test suite, not the whole suite.
Open-source testing adoption is broad but incomplete. In a 2024 survey on testing in DevOps, 74% of teams reported using manual testing in their strategies while 60% used open-source test-automation tools. Manual checking hasn’t gone anywhere, which is exactly why auto-generated regression suites earn their place: they cover the paths nobody will click through twice.
- No code changes: eBPF capture removes the instrumentation argument from the review.
- Mock generation: downstream services can drop out of the test environment without breaking replay.
- Support matrix: verify protocols and frameworks against your architecture before committing.
- Plan limits: free and paid tiers exist, with enterprise terms confirmed case by case.
Website: Keploy
4. Softprobe
Softprobe records service requests and responses, replays them against a newer build, and compares the results to surface changed behavior. It also captures downstream interactions, so tests can use recorded database, cache and service responses instead of live ones. That makes it a behavior-diff tool rather than a load generator, which is a more useful thing to be than the tenth load generator in your stack.
The setup detail that decides whether it works
Comparison produces noise unless you normalize first. Timestamps, generated IDs, field ordering, and floating-point rounding will all flag as differences on a build that’s fine. Decide your tolerances before the first run, or the team stops reading the report within a week.
The documented workflow here is a Java agent, so check language coverage for your services before planning around it. Public pricing isn’t apparent in the vendor materials, and capture overhead is worth measuring on a busy service rather than assuming. Recording production traffic also means a data-handling review, because a replay archive is a durable copy of whatever users sent.
- Change detection: catches behavioral drift that a pass/fail assertion misses.
- Recorded dependencies: fewer live systems required during regression runs.
- Less authoring: large regression collections come from observed traffic.
- Open questions: non-Java stacks, pricing and capture overhead need confirmation.
Website: Softprobe
5. STC LoadTester
STC LoadTester captures real API traffic as a reusable test asset, masks or randomizes sensitive values, then replays at a configured request rate or concurrent-user level. Dynamic value mapping handles authentication tokens and similar chained values, so multi-step API flows survive replay instead of dying on an expired session.
That puts it between two jobs on this list. It records genuine production traffic rather than asking you to guess a workload, and it answers capacity questions that pure replay-and-compare tools leave open.
The data problem nobody budgets for
Masking is where these projects fail. Fresh, safe test data takes time to produce in most organizations, so teams under deadline reach for raw production dumps and skip the classification work. The tool masks on capture, but it cannot decide for you which fields are sensitive or which relationships must survive.
Sanitized traffic that no longer reproduces the bug is worse than no test at all, because it reports success.
A workable sequence: classify fields by sensitivity, tokenize or synthesize the sensitive ones, preserve referential relationships so joins still work, then re-run a known failure against the sanitized sample to prove it still reproduces. Replay archives need retention rules and deletion workflows, since they are a second copy of personal data.
- Traffic-derived scenarios: closer to real request patterns than hand-scripted flows.
- Masking built in: reduces the custom tooling that privacy review usually demands.
- Configuration work: selection, variable mapping and load levels still need an owner.
- Thin public detail: limited independent reviews and no published price schedule.
Website: STC LoadTester
6. Grafana k6
Grafana k6 answers a different question: not “does the new build behave like production” but “how much can it take”. Tests are JavaScript, committed to the repository, reviewed like code, and run from the open-source CLI or Grafana Cloud. The managed tier ties results into Grafana dashboards, which shortens the trip from a latency spike to the cause.
Where it stops being useful
k6 doesn’t capture production traffic. Every scenario comes from you, so the fidelity problem stays yours: which endpoints, which payload mix, which concurrency pattern. Reaching for it as a replay substitute produces confident numbers about the wrong workload. Browser-level realism is also a different tool or extra setup.
The pricing is at least legible, which is more than most of this list. The cloud offering includes an always-free tier of 500 virtual-user hours per month, with Pro starting at $19 per month plus usage. Large or frequent tests are metered, so plan the cost before an eight-hour soak test becomes a habit.
- Low friction: the open-source CLI gets a first test running in an afternoon.
- CI-friendly: code-based scenarios fit review and pipeline automation.
- No capture: production traffic isn’t reproduced automatically.
- Metered cloud: usage-based billing punishes unplanned scale.
Website: Grafana k6
7. Artillery
Artillery covers two kinds of load failure in one tool: API saturation and client-side breakdown. API scenarios run in JavaScript or TypeScript. Browser journeys run on Playwright, so a checkout flow gets exercised with real rendering and script execution instead of a status-code check. Distributed runs execute on AWS or Azure, which takes load-generator operations off your plate if you already live in one of those clouds.
The cost shape to expect
Browser load is expensive computing. API virtual users are cheap at scale; a fleet of headless browsers rendering pages is a different bill entirely, and that shows up in infrastructure as well as licensing. Simulating journeys with real JavaScript execution catches client-side failures that API tests never see. Budget for it.
Published pricing makes the first evaluation easier: a free plan plus paid tiers, with quotas and test limits that vary by tier. Scripts still need maintenance as the application changes, and a load script nobody has run in six months is a liability dressed as coverage.
- Two jobs, one tool: API load and browser journeys share a scripting language.
- Skill reuse: JavaScript and TypeScript teams onboard quickly.
- Readable pricing: published tiers and quotas support early comparison.
- Simulated traffic only: scenarios come from your scripts, not captured production requests.
- Compute heavy: browser tests and higher-scale cloud runs add real cost.
Website: Artillery
8. Gatling
Gatling’s Community Edition is free and already generates serious load from a developer’s laptop. Paid tiers are billed monthly or annually, and Enterprise pricing is quoted on request. What the money buys is centralization: private load generators, distributed runs and collaboration across a team. That ladder from solo scripting to centrally managed testing is why it shows up in enterprise evaluations at all.
Recording gets you to the first run, not to a good test
The HAR import and HTTP proxy recorder will produce a scenario from a browsing session in minutes. What you get is a literal transcript: every asset, every analytics call, every request in the order one user happened to make them. Prune it hard. Keep the business-critical calls, parameterize the values, and separate user think time from request pacing.
Remember what Gatling runs: simulated load from scripted virtual users. A scenario built from one browsing session covers only the paths that user took. If you’re weighing scripted generators against each other, this comparison of Locust load testing approaches covers the Python alternative and where scripted tools leave gaps that recorded traffic fills.
- Multiple authoring paths: code, low-code and no-code options across editions.
- Recorded starting points: HAR import and proxy recording cut initial scripting time.
- Managed generators: private load generators and distributed runs on paid plans.
- Paid ceiling: collaboration and hosted scale sit behind paid tiers, with Enterprise quoted.
Website: Gatling
9. LaunchDarkly
LaunchDarkly doesn’t replay traffic and doesn’t generate load. It controls exposure: flags, percentage rollouts, targeted segments, experimentation, and guarded releases that watch health signals and halt a rollout when they deteriorate. In a list sorted by failure type, it earns its place because the failure it catches is release exposure. Some bugs are cheaper to find with a small audience than in another staging environment.
The release problem it actually solves
Shipping frequency has outrun verification, and many teams retest security fixes in production only well after release. Flags buy time inside that gap: limit who sees the change, watch the error rate, stop the rollout.
A typical pattern: route a checkout change to a small slice of users, attach a guarded release to your error metric, and let the automation halt the rollout if the number moves. Everyone outside the slice never touches the broken path.
The trap is flag debt. Every unreleased flag is a branch in production code that nobody tests, and stale flags become their own outage source. Set an expiry date when you create one.
- Separates deploy from release: exposure becomes a control you can tune.
- Guarded releases: automated health checks can halt a bad rollout.
- No traffic replay: it cannot tell you whether a build matches captured behavior.
- Usage-based cost: connections and seat volume drive the bill, so model it early.
Website: LaunchDarkly
10. Chaos Mesh
Chaos Mesh injects faults into Kubernetes workloads: pod kills, network partitions, DNS failures, CPU and memory pressure, storage errors. Experiments are declared as Kubernetes resources, scoped by selectors, and orchestrated in workflows. It answers the question your functional suite never asks, which is what happens when a dependency disappears mid-request.
Measure recovery, not just failure
Recovery is the number leadership cares about. DORA’s delivery metrics organize around five measures, including change-fail rate, the share of deployments that require immediate intervention such as a rollback or hotfix after causing a production failure, and failed-deployment recovery time, which captures how long it takes to restore service after a change-related impairment. DORA refined that second metric from the older mean-time-to-recover idea specifically to isolate failures caused by production changes. Chaos experiments give you a rehearsal for both.
The blast radius is the experiment design. Scope a namespace, cap the duration, and have the rollback command written down before you start.
The risk is genuine. Fault injection on a shared cluster with weak RBAC is an outage you scheduled yourself, so start in a dedicated namespace with a recovery drill. This explainer on chaos testing covers the experiment design that keeps blast radius small.
- Open source: no license cost, full control over experiment definitions.
- Real failure behavior: finds reliability gaps that load tests miss.
- Kubernetes only: needs cluster expertise and careful access control.
- Not a replay tool: says nothing about matching captured production behavior.
Website: Chaos Mesh
How the production testing software options differ on free access, paid pricing and best use
| Item | Free option | Paid pricing | Best for |
|---|---|---|---|
| GoReplay | Free open-source edition with HTTP capture, replay, filtering, rewriting, middleware, and CLI | PRO: $2,950 per year; taxes may apply | Recommended for realistic production-traffic replay, bug reproduction, and load testing |
| Speedscale | Free local proxymock for local mocking and basic recording | Paid-plan pricing not publicly listed | Microservice teams that need traffic replay, dependency mocking, and cloud collaboration |
| Keploy | Open-source core; free-tier limits should be confirmed | Paid cloud and enterprise plans; pricing not specified | Generating regression tests and mocks from recorded application interactions |
| Softprobe | Free option not specified | Public pricing not apparent | Java teams comparing replay results to detect behavior changes |
| STC LoadTester | Free start available | Full pricing schedule not publicly listed | Replaying anonymized API traffic at configured throughput or concurrency |
| Grafana k6 | Free open-source CLI; free cloud tier includes 500 virtual-user hours per month | Pro starts at $19 per month plus usage | Developers building code-based performance tests for CI/CD |
| Artillery | Free cloud plan | Team: $199 per month; Business: $499 per month | Teams testing APIs and browser journeys with JavaScript or TypeScript |
| Gatling | Free Community Edition | Basic: €89 per month; Team: €356 per month billed annually; Enterprise: custom pricing | Teams progressing from code-based tests to managed or distributed testing |
| LaunchDarkly | Free Developer plan | Foundation is usage-based; Enterprise pricing is custom | Gradual production rollouts, feature validation, and release control |
| Chaos Mesh | Open-source | No paid pricing specified | Kubernetes teams testing resilience through controlled fault injection |
Match the Tool to the Failure You Need to Catch
Start from the question you need answered, not from a feature matrix. If the question is whether a rewrite, a framework upgrade or a migration behaves like the system it replaces, you need capture and replay with response comparison. GoReplay’s open-source edition is a low-cost place to run that experiment on your own traffic for a week, and its PRO tier at $2,950 per year adds S3 storage, keep-alive TCP session recognition and a commercial license when the workflow proves out.
If the question is capacity, a load generator answers it. k6, Artillery and Gatling all produce numbers you can defend, but every scenario comes from you, so their accuracy is bounded by how well you modeled the workload. Expect to spend more time on scenario maintenance than on the initial script.
If the question is dependency isolation, Speedscale and Keploy attack it from different angles, one with mocking in the capture path, the other by generating tests and mocks from observed interactions. Both reduce how much infrastructure a test environment needs, and both demand a support-matrix check against your stack before you commit.
If the question is exposure, LaunchDarkly handles it with flags and guarded rollouts, which is not testing in the replay sense but often the faster route to limiting damage. If the question is failure behavior, Chaos Mesh is the only entry here that breaks things on purpose.
Three things I’d insist on in any evaluation, regardless of tool:
- Trial on your own traffic: vendor demos use clean payloads and forgiving latencies. Yours won’t.
- Interoperate or skip: replay results have to correlate with deployments and incidents, or nobody will look at them.
- Sanitize before you scale: keep captured data free of credentials and personal details, and prove masking works by re-running a known failure against the sanitized sample.
The failure mode to avoid is buying coverage theatre. A dashboard showing thousands of replayed requests, with no owner reading the diffs and no stop condition tied to the results, gives you the cost of production testing and none of the protection. Pick the failure you’re most afraid of this quarter, instrument it, and let the tool earn the next line of budget.
Real production traffic exposes the sequences, payload shapes and timing your scripted suite never wrote down, and GoReplay turns that traffic into a reusable test workload you can replay against an isolated environment before a release ships. Capture requests, filter and rewrite what shouldn’t be replayed, run the sample at a controlled speed, and compare responses and resource limits between versions. Visit GoReplay to start with the free open-source edition and see what your production traffic finds.