A Practical Guide to Performance Test JMeter

So, what exactly is a performance test with JMeter? At its core, it’s about using this powerful open-source tool to throw a simulated crowd of users at your application, API, or server. It’s how engineers find performance bottlenecks, check for stability under pressure, and make sure the user experience doesn’t fall apart before a big launch.
Think of it as a controlled stress test to prevent real-world crashes during peak traffic.
Why JMeter Is Still a Go-To for Performance Testing
Before we jump into building a script, it’s worth taking a moment to understand why Apache JMeter has stuck around for so long and remains a staple in any performance engineer’s toolbox. It’s not just that it’s free. The real power comes from its flexibility, massive community, and the fact that it runs just about anywhere. For over two decades, it’s been the trusted solution for validating application performance.

This isn’t just a niche tool. JMeter commands a respectable 11.7% market share in the software testing space, with a huge user base in the United States and within mid-sized companies. Its popularity is built on a foundation of solid capabilities that tackle the big questions about performance.
The Core Tests You’ll Be Running
To get the most out of JMeter, you need to know what kinds of questions you’re trying to answer. Each test type serves a different purpose.
- Load Testing: This is your bread and butter. You’re testing how the system performs under expected traffic. It answers the question, “Can our app handle a normal Tuesday afternoon peak without grinding to a halt?”
- Stress Testing: Here, you’re intentionally pushing the system past its limits to see where it breaks. This helps you find the absolute maximum capacity and, just as importantly, understand how it fails. Does it slow down gracefully or crash and burn?
- Scalability Testing: This measures how well your application can “scale up” as user load increases. The goal is to see if performance stays consistent as you add more users or throw more hardware at the problem.
When you start looking into common app performance challenges, especially with older devices, you see why this matters. JMeter gives you the tools to diagnose and fix these exact kinds of problems before they frustrate your users.
In any modern DevOps workflow, running a performance test with JMeter isn’t just a nice-to-have; it’s essential. Plugging it into your CI pipeline creates a feedback loop that catches performance issues early, long before a customer ever sees them.
Configuring Your JMeter Environment for Success
Before you can unleash thousands of virtual users on your application, you need to get your own house in order. A solid JMeter setup is the foundation of any reliable performance test, and skipping these steps is a classic recipe for frustrating errors down the road. The whole process is pretty straightforward, but you’ve got to get it right.
First things first: JMeter is a 100% Java application. That means you absolutely must have a compatible Java Development Kit (JDK) installed. I’ve seen countless tests fail because someone was running an old, unsupported version of Java. It leads to bizarre crashes and plugin issues that are a nightmare to debug. Do yourself a favor and check the official JMeter website for the required JDK version before you even think about downloading anything else.

Once Java is ready, go grab the latest stable binary release of JMeter. It’ll come as a zip file. Unpack it somewhere simple, and—this is a pro-tip—make sure the file path has no spaces. Something like C:\jmeter\ on Windows or /Users/your-name/jmeter on macOS works perfectly. This tiny detail can save you from a world of hurt with certain scripts and plugins later.
Finding Your Way Around the JMeter Interface
Alright, time to fire it up. Head into the bin folder and run jmeter.bat (for Windows) or jmeter.sh (for Mac/Linux). You’ll be greeted by the main graphical user interface (GUI). It can look a little busy at first, but you’ll get the hang of its core components pretty quickly.
This GUI is your command center. Everything you build will live in the tree view on the left, where you’ll organize all your test elements.
Let’s walk through a basic test to see how it all connects. At its heart, a JMeter test plan needs just a few key pieces to simulate user actions and see what happens.
- Test Plan: This is the root of everything, the main container for your entire test scenario.
- Thread Group: This is where you define your virtual users. You’ll set how many users (threads) to simulate, how quickly to ramp them up, and how many times they should repeat the test.
- Sampler: Think of a sampler as a single user action. The most common one is an HTTP Request, which simulates a browser hitting a URL.
- Listener: This is how you see the results. Listeners grab the data from your samplers and display it in tables, graphs, or simple logs.
Here’s a piece of advice I give everyone: always give descriptive names to your elements. Don’t leave it as “HTTP Request.” Change it to “POST /api/login” or “GET /products/search”. This simple habit will make your tests infinitely easier to read, debug, and maintain, especially when they start getting complex.
Putting together this simple structure—Test Plan > Thread Group > HTTP Request Sampler > View Results Tree Listener—is basically the “Hello, World!” of JMeter. It sets up the fundamental workflow you’ll use for just about every performance test you build from here on out.
If you’re ready to move beyond the basics and get into more advanced scripting, check out our guide on how to automate JMeter API testing. Building these good habits now will genuinely save you hours of headaches later.
Crafting Test Scenarios That Mimic Real Users
Sending a single, repetitive HTTP request is a start, but let’s be honest—it’s not a real performance test. The real power of JMeter comes from simulating the messy, unpredictable, and dynamic behavior of actual human beings. This is where we go beyond basic pings and start writing scripts that uncover genuine bottlenecks.
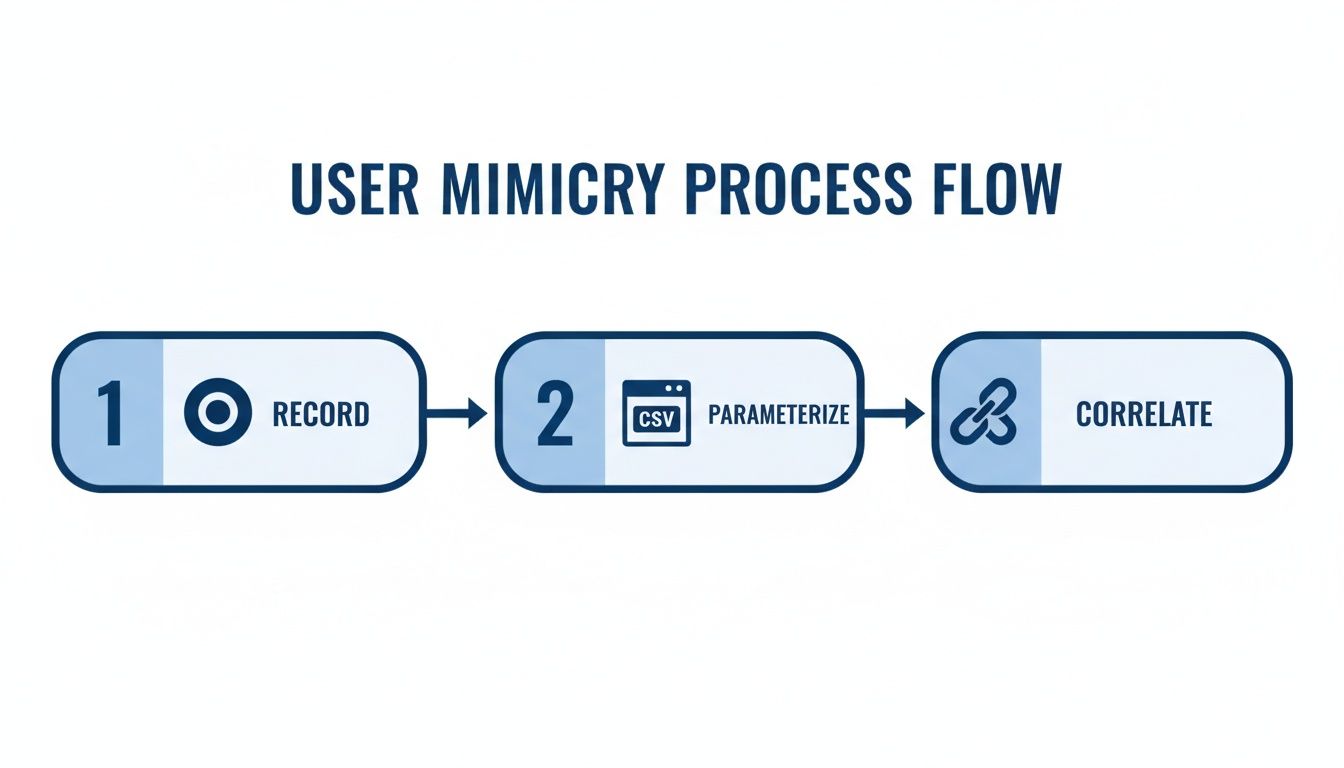
A great way to get started is to let JMeter do some of the heavy lifting for you. The HTTP(S) Test Script Recorder acts like a proxy, capturing all the network traffic you generate just by clicking through your application in a browser. It translates your actions—logging in, searching for a product, adding it to a cart—into a neat sequence of HTTP Request Samplers.
This recording gives you a fantastic baseline, but it’s rarely ready to run out of the box. Modern applications are dynamic; they spit out unique session IDs, security tokens, and other values on the fly. This is where the real craft of scripting comes into play.
Making Your Virtual Users Unique
To avoid having every single virtual user hammer your server with the exact same request, you need parameterization. This is just a fancy way of saying you’re replacing hard-coded values in your script (like a username or a search term) with variables pulled from an external file, usually a simple CSV.
Imagine testing a login flow. Instead of having 1,000 virtual users all try to log in as “user1,” you can create a CSV file packed with unique usernames and passwords. Just add a CSV Data Set Config element to your JMeter test plan, and each thread (your virtual user) will grab a new line from the file on each run. It’s a simple change that makes the test far more realistic.
The whole point here is to avoid skewed results from server-side caching. When every request is identical, you might get deceptively fast response times. Parameterization forces the server to do real work for each user, giving you a much truer picture of its performance.
Handling Dynamic Server Responses
The next critical skill is correlation. This is how you handle values that the server generates and sends back to you, which you then need to use in a future request. The classic example is a session ID returned after a successful login. Your script has to be smart enough to capture that ID and include it in all subsequent requests to keep the session alive.
You’ll use a Post-Processor, like the Regular Expression Extractor or the JSON Extractor, to do this. You just tell it what to look for in the response, and it will “extract” that dynamic data and store it in a variable. Then, you can pop that variable (e.g., ${sessionID}) into the next request, perfectly mimicking how a real browser behaves.
Let’s walk through a quick e-commerce example:
- User Logs In: The server sends back an
authToken. A Post-Processor on this request grabs that token and saves it. - User Searches: The user looks for “running shoes.” Your script automatically includes the
authTokenin the request headers to stay logged in. - User Adds to Cart: The user clicks a product. The request to add the item to their cart includes both the
authTokenand the uniqueproductIDthat you extracted from the search results page.
This kind of multi-step, dynamic process is what separates a basic health check from a meaningful performance test.
To help you get a handle on this, here’s a quick rundown of the most common JMeter elements you’ll be using to build these kinds of realistic user flows.
Key JMeter Elements for Realistic Scenarios
| Element Type | What It Does | A Practical Example |
|---|---|---|
| HTTP(S) Test Script Recorder | Captures browser traffic and converts it into JMeter test steps. | Clicking through a checkout process in your browser to automatically generate the entire sequence of HTTP requests. |
| CSV Data Set Config | Reads data from a file (like a CSV) to use as variables in your requests. | Providing a list of 10,000 unique usernames and passwords for a login test. |
| Regular Expression Extractor | Pulls out dynamic data from a response using regular expressions. | Capturing a csrf_token from an HTML form response to submit in the next request. |
| JSON Extractor | Extracts data from a JSON response using JSONPath expressions. | Grabbing a product_id from a JSON API response after searching for an item. |
| Logic Controllers (e.g., If, Loop) | Controls the flow of your test, allowing for conditional or repetitive actions. | Using a Loop Controller to simulate a user adding five different items to their shopping cart. |
These components are the building blocks for almost any scenario you can dream up.
Mastering parameterization and correlation is absolutely fundamental to getting real value out of JMeter. It’s what allows you to build tests that genuinely reflect how your users interact with your system. This level of realism is a key reason for its continued popularity in modern DevOps, as you can see in some great online comparisons of different testing tools.
Running and Scaling Your Performance Tests
You’ve got a well-crafted script, and now it’s time for the fun part: generating some real traffic. This is where your performance test moves from theory to practice, from the quiet of your local machine to the chaos of a full-scale load test. The goal is simple—simulate realistic user loads and see what breaks.
To get there, we need to transform that raw recording of user actions into something dynamic enough to mimic real people.
This workflow is the secret sauce. It’s how you turn a simple, static recording into a powerful test that genuinely reflects how users interact with your system. Without this, you’re just replaying one person’s journey, not simulating a crowd.
Now, a critical mistake I see newcomers make all the time is running their load tests directly from the JMeter GUI. Don’t do it. While the interface is fantastic for building and debugging your scripts, it eats up a ton of memory and CPU. Running a big test in GUI mode will give you skewed, unreliable results because your machine is fighting to manage the UI instead of focusing on its real job: generating load.
Executing Tests from the Command Line
For any serious performance test, you have to run JMeter in non-GUI mode from the command line. This is the professional standard, and it’s non-negotiable for getting accurate, resource-efficient results.
The command itself is pretty straightforward.
jmeter -n -t /path/to/your/TestPlan.jmx -l /path/to/your/results.jtl
Let’s quickly break that down:
- -n: This flag is what tells JMeter to run in non-GUI mode.
- -t: This points to your JMeter test plan file (the .jmx you saved).
- -l: This defines where JMeter should save the raw test results in a JTL file.
Running your test this way frees up a massive amount of system resources. This means more accurate metrics and the ability to generate a much higher load from a single machine.
My advice is to get comfortable with the command line early. It may seem like an extra step, but it’s the only way to ensure your performance test with JMeter is producing data you can actually trust. The difference in results can be dramatic.
Simulating Massive User Loads with Distributed Testing
So, what happens when one machine just isn’t enough to generate the load you need? That’s where distributed testing comes in. JMeter has a built-in master-slave architecture that lets you control multiple load-generating machines (slaves or agents) from a single controller (the master).
This setup is how you scale your performance test horizontally to simulate hundreds of thousands, or even millions, of concurrent users. The master machine orchestrates the whole thing—it sends the script to all the slave machines and then gathers all the results back into a single, consolidated report. It’s an incredibly powerful way to simulate traffic coming from different machines or even different parts of the world.
To take it a step further, you can integrate JMeter into your CI/CD pipeline with tools like Jenkins. By automating your performance tests, they stop being a one-off event you scramble to do before a big release. Instead, performance validation becomes a routine part of every build, helping you catch regressions early and embedding a culture of performance right into your engineering team.
Turning Test Results into Actionable Insights
Running a performance test is just the first step. The real value comes from digging into that mountain of raw data and turning it into a clear-cut plan of attack for your engineering team. A test without solid analysis is just noise. This is where JMeter’s Listeners come in, helping you get a real diagnosis of your application’s health under load.
For debugging and making sure your script is actually doing what you think it’s doing, the View Results Tree is a lifesaver. It gives you a forensic breakdown of every single request and response, letting you see the exact data going back and forth.
But a word of warning: for a real load test, this Listener is a memory hog. You should only ever use it for small-scale script validation, never during a full-blown performance run.
Decoding Key Performance Metrics
Once you’ve run your test in non-GUI mode (which you always should for actual load tests), the real analysis begins. The Aggregate Report and Summary Report are your go-to tools for getting that high-level overview. They crunch all the numbers and serve up the most critical metrics you need.
Here’s what I always look at first:
- Average Response Time: This is the average time, in milliseconds, your server took to respond. It’s the most direct indicator of what your users are actually experiencing.
- Throughput: Think of this as your application’s capacity—how many requests it can handle per second. A higher number is almost always better.
- Error %: The percentage of requests that flat-out failed. Anything above 0% is a red flag that needs immediate investigation. You have to figure out why things are breaking under pressure.
- 90th/95th Percentile: I often find these more useful than the average. This number tells you that 90% (or 95%) of your users got a response time at or below this value. It smooths out the crazy outliers and gives you a much more realistic picture of the typical user experience.
Generating the HTML Dashboard Report
For a comprehensive and, frankly, beautiful view of your test results, nothing beats JMeter’s built-in HTML Dashboard Report. After your non-GUI test is done, you can generate this with a simple command, using your JTL results file as the input.
What you get is a slick, interactive dashboard loaded with charts and tables. It visualizes everything from response time trends to error breakdowns over the duration of the test.
This report is the bridge between raw test data and actionable engineering tasks. It helps you pinpoint exactly when performance started to degrade and correlate high response times with specific requests or error types.
This is exactly why having solid VM Performance Monitoring is non-negotiable. It’s not enough to know a request was slow; you need to see if the CPU spiked or memory maxed out on the server at that exact moment. The magic happens when you connect JMeter’s results with server-side metrics—that’s how you find the true root cause.
The fact that the global performance testing market is projected to hit $1.304 billion by 2031 shows just how seriously businesses are taking this. Companies get it: performance is directly tied to success. Tools like JMeter remain essential because they support the entire lifecycle, from scripting all the way to this kind of detailed, actionable analysis.
Take Your Testing to the Next Level with Real Production Traffic
Simulating user journeys in JMeter is a solid start, but let’s be honest—it’s still just an educated guess. Nothing can truly prepare your application for the chaotic, unpredictable reality of how people actually use it.
To get the ultimate confidence check before a big deployment, you need to test with the real deal: your live production traffic.
This is where a tool like GoReplay completely changes the game. It’s an open-source tool that “listens” to your live traffic, captures it, and then lets you “replay” it against your staging environment. The guesswork is gone. You’re not just simulating a user journey; you are replicating it exactly as it happened.
How to Pipe Real Traffic into JMeter
The strategy here is pretty slick. You use GoReplay as a live traffic source that feeds requests directly into a JMeter proxy. This setup gives you the raw authenticity of real-world traffic combined with all the powerful monitoring and analysis features you love in JMeter.
Here’s how the workflow looks from a high level:
- Capture: First, you set up GoReplay to listen in on your production server and record live HTTP traffic.
- Forward: Next, you configure GoReplay to forward all that captured traffic over to JMeter’s HTTP(S) Test Script Recorder.
- Analyze: JMeter then receives these requests just as if a real user were firing them off. From there, you can use all your favorite Listeners to measure crucial performance metrics like throughput and response times.
This method gives you a performance test with JMeter that is as close to reality as you can possibly get. You’ll see precisely how your system handles the exact API calls, request headers, and traffic patterns from your busiest sales day or a massive marketing campaign.
It’s a powerful technique for finding those gnarly edge-case bugs that scripted tests almost always miss. For a deeper dive, check out this guide on how to replay production traffic for realistic load testing and integrate this approach into your own workflow.
Got Questions About JMeter?
When you’re getting your hands dirty with your first few JMeter performance tests, a few common questions always seem to pop up. Let’s get you some quick answers to the hurdles most engineers hit early on.
How Many Threads Can One JMeter Machine Really Handle?
This is the classic “it depends” question. As a general rule of thumb, a single, modern machine can probably spin up somewhere between 500 to 2,000 virtual users (or threads). But that number is totally dependent on what your script is actually doing, how big the server responses are, and the hardware specs of the machine running the test.
If you’re running heavy-duty scripts with a ton of post-processing or complex data assertions, that number is going to drop, and fast. Keep a close eye on the CPU and memory of your load generators. If they’re maxed out, your test results are garbage.
Can I Use JMeter to Test WebSocket Apps?
You bet. While JMeter’s bread and butter is HTTP/HTTPS, it handles WebSockets just fine with the help of third-party plugins. The one you want is the JMeter WebSocket Sampler by Peter Doornbosch—it’s pretty much the community standard.
This plugin lets you open a persistent connection, fire off messages, and listen for what the server sends back. It gives you everything you need to properly performance test real-time applications.
Just a heads-up: WebSocket testing is stateful. This isn’t like firing off stateless HTTP requests. You have to actively manage the connection’s entire lifecycle in your script—opening it, sending and receiving data, and then closing it properly to get numbers you can trust.
What’s the Real Difference Between Latency and Response Time?
People throw these terms around like they’re the same thing, but they measure two distinct moments in a request’s journey.
- Latency is the time it takes for the very first byte of the response to hit your client after you’ve sent the request. It’s the initial “hello” from the server.
- Response Time is the total time from the moment you send the request to the moment you receive the very last byte of the response. It’s the whole conversation.
Ready to test with real user traffic instead of just faking it? GoReplay lets you capture and replay live production traffic into your test environments, giving you the most realistic performance test possible. Learn more at https://goreplay.org.