Level Up Your Performance Testing
Application performance is critical. A slow or unresponsive application can result in lost revenue, damage your reputation, and frustrate users. Robust performance testing is essential to ensure your systems can handle traffic spikes, especially during peak seasons or marketing campaigns. Choosing the right load testing software is crucial for identifying bottlenecks, optimizing performance, and delivering a seamless user experience.
These tools empower you to simulate realistic user behavior, from single-user tests to complex scenarios mimicking thousands of concurrent users. They address critical challenges like identifying infrastructure limitations, pinpointing performance bottlenecks in your application code, and verifying system resilience under stress. The ideal load testing solution provides actionable insights into response times, error rates, and resource utilization, enabling you to proactively optimize your application.
Choosing the Right Tool
Selecting the right tool depends on several factors, including your budget, technical expertise, application complexity, and the specific performance metrics you need to track. Some tools excel at protocol-level testing for maximum efficiency, while others focus on browser-based testing for a more realistic user experience.
Pricing models also vary, from open-source options to enterprise-grade platforms with subscriptions. Technical considerations, such as support for various scripting languages, integrations with CI/CD pipelines, and cloud-based testing capabilities, also play a vital role in your decision.
Top 10 Load Testing Software Solutions of 2025
In this list, we’ll explore the top 10 load testing software solutions available in 2025, covering both open-source and enterprise-grade platforms. We’ll examine their features, weigh their pros and cons, and highlight their ideal use cases. This will equip you with the knowledge to choose the perfect tool to level up your performance testing and ensure your application is ready for anything.
1. GoReplay
GoReplay is a robust load testing tool that stands out for its use of real production traffic. This allows for incredibly realistic test scenarios. Instead of relying on simulated traffic, GoReplay captures actual user interactions. This gives you valuable data on how your application performs under real-world conditions. It’s a particularly good fit for complex applications with intricate user flows and high-performance needs.
GoReplay captures live HTTP traffic and then replays it against your testing environment. This “record and replay” feature simplifies load testing. It removes the need for complex scripting and lets you quickly generate tests based on actual user behavior. This helps identify bottlenecks and performance issues that might be missed with synthetic testing tools.
Key Features and Benefits
- Realistic Load Testing: Capture and replay live HTTP traffic, creating tests that mirror real user behavior.
- Session-Aware Replay: Maintain user sessions during replay, ensuring accurate testing of session-dependent features.
- Smart Connection Pooling: Optimize connection usage and simulate real-world network conditions.
- TLS Optimization: Efficient handling of encrypted traffic for realistic testing of secure applications.
- Comprehensive Monitoring and Analytics: Get real-time performance insights during testing, along with a detailed dashboard and alerts.
- Flexible Deployment: Choose between the free, open-source tool or the enterprise version with added support.
Pros and Cons
Pros:
- Realistic testing using live HTTP traffic.
- Advanced features like session replay, connection pooling, and TLS optimization.
- Comprehensive monitoring and analytics dashboard.
- Flexibility with open-source and enterprise options.
- Proven track record and a strong GitHub community.
Cons:
- Can have a steep learning curve for new users.
- Setup might be complex for smaller teams unfamiliar with production traffic simulation.
Pricing and Technical Requirements
GoReplay has a free, open-source community edition, ideal for individuals and small teams. A commercial enterprise edition is available for larger organizations needing features like traffic storage, data masking, and dedicated support. Contact GoReplay for enterprise pricing details.
GoReplay is written in Go and works on various operating systems, including Linux, macOS, and Windows. Familiarity with command-line interfaces and basic networking is helpful for installation and configuration.
Implementation Tips
- Begin with the community edition to learn the tool.
- Capture traffic during peak times for realistic tests.
- Use the analytics dashboard to identify and address performance bottlenecks.
- Consider the enterprise edition for advanced features and dedicated support.
Comparison With Other Tools
While tools like JMeter and Gatling offer powerful scripting for load simulation, GoReplay uses real production traffic. This provides greater accuracy and insights, eliminating the need for complex test scripting. It ensures your tests accurately reflect real-world usage.
Website: https://goreplay.org
GoReplay is a valuable tool for teams focused on realistic load testing and performance optimization. Its ability to capture and replay real user traffic offers a high level of testing accuracy and insight, which is essential for ensuring application stability and scalability in demanding production environments.
2. JMeter
Apache JMeter is a powerful, open-source load testing tool. Favored by developers, QA engineers, and DevOps professionals, it’s known for its flexibility and extensive features. Primarily designed for web applications, JMeter can also test a wide range of services and protocols. This allows for simulating diverse load scenarios and identifying performance bottlenecks.
Its prominence in load testing comes from its ability to analyze performance under stress. This provides valuable insights for optimizing applications and ensuring scalability.
Versatility and Reporting
JMeter’s versatility is evident in its multi-protocol support. It encompasses HTTP, HTTPS, SOAP, JDBC, LDAP, JMS, and more. This means you can test web services, databases, messaging queues, and directory servers, among other things.
Its dynamic HTML reporting offers powerful data visualization. This allows you to easily identify trends and anomalies. A robust plugin architecture further allows for customization and extension of core functionalities.
Distributed Testing and Scripting
Need to simulate massive user loads? JMeter’s distributed testing capabilities let you coordinate multiple machines to generate the required traffic. For more advanced users, JMeter supports scriptable test creation with Groovy and other languages. This offers greater control over test scenarios.
One of JMeter’s most significant advantages is its open-source nature, making it free to use. Combined with its highly customizable configuration options, it’s a cost-effective solution for any size organization. The ability to conduct distributed load testing is crucial for enterprise-scale applications, simulating realistic user traffic patterns. A strong and active community provides ample support and regular updates, keeping JMeter relevant and addressing emerging testing needs. You might be interested in: A Complete Guide to Load Testing REST APIs with JMeter.
Drawbacks to Consider
While JMeter offers significant advantages, it’s important to be aware of its potential drawbacks. Compared to some commercial alternatives with user-friendly graphical interfaces, JMeter has a steeper learning curve. The interface can be daunting for beginners, requiring time and effort to master.
Real-time reporting is somewhat limited without plugins, which can add complexity. For extremely large-scale tests, JMeter can consume substantial system resources.
Pros:
- Completely free and open-source
- Highly customizable with extensive configuration options
- Supports distributed load testing for enterprise-scale applications
- Strong community support and regular updates
Cons:
- Steeper learning curve compared to commercial alternatives
- Interface can be unintuitive for beginners
- Limited real-time reporting without plugins
- Can be resource-intensive for very large tests
Website: https://jmeter.apache.org/
JMeter earns its place on this list because it offers a powerful, flexible, and cost-effective solution for comprehensive load testing. While it requires some technical expertise, the extensive features and customization options make it invaluable for ensuring application performance and scalability.
3. LoadRunner
Micro Focus LoadRunner is a leading enterprise-grade performance testing platform. If your application ecosystem is complex, business-critical, and requires thorough testing under pressure, LoadRunner is a solution worth considering. It simulates thousands of concurrent users, revealing bottlenecks and vulnerabilities that surface under stress. This helps your team proactively fix performance problems before they affect your users.
LoadRunner is known for supporting a wide range of technologies and protocols (over 50), including web, mobile, and legacy systems. Its advanced correlation and parameterization features create realistic user behavior simulations.
LoadRunner also integrates with DevOps and CI/CD pipelines, promoting continuous performance optimization. Features like network virtualization mimic real-world network conditions. This ensures your application performs well across various locations and network speeds. LoadRunner even includes AI-powered testing and analysis, automating test creation and delivering insightful performance predictions.
Practical Applications and Benefits
LoadRunner has many practical uses, from testing e-commerce platforms during peak seasons to verifying the stability of online banking systems under heavy transaction loads. It’s particularly useful for large enterprises with complex architectures and high-performance needs.
Features:
- Supports over 50 technologies and protocols
- Advanced correlation and parameterization
- Integrates with DevOps and CI/CD tools
- Network virtualization for realistic simulations
- AI-powered testing and analysis
Pros:
- Enterprise-grade capabilities for complex systems
- Comprehensive analytics and reporting
- Excellent technical support
- Integrated performance monitoring and diagnostics
Cons:
- High cost compared to open-source options
- Complex licensing model
- Resource-intensive, requiring significant hardware
- Steep learning curve for advanced features
Pricing and Technical Requirements
Pricing: Contact Micro Focus for a custom quote based on virtual user days (VUDs) and required protocols.
Technical Requirements: LoadRunner Controller and Load Generators need Windows or Linux servers with specific hardware configurations based on the test load. For further information on load testing, you may find this guide helpful: Our comprehensive guide on load testing software.
Conclusion
While LoadRunner’s cost and complexity may be a barrier for smaller businesses, its robust features and enterprise-grade support make it valuable for organizations needing to ensure the performance and stability of their critical applications. The investment can lead to significant cost savings by preventing performance-related downtime and creating a positive user experience. Visit the LoadRunner website for further information.
4. k6
k6 is a modern, open-source load testing tool. It’s designed for developers and performance testers. Its developer-centric approach, along with robust features and a streamlined command-line interface (CLI), makes it a powerful option. Consider k6 for integrating performance testing into your development process.
k6 stands out because it’s easy for developers to use. It also offers strong CI/CD integration and efficient performance. You can write performance tests using JavaScript ES6, a language familiar to most web developers. This makes creating and maintaining complex load tests simpler.
The CLI-first design makes k6 ideal for automation. It seamlessly integrates into CI/CD pipelines. This allows you to run performance tests as part of your build process, catching performance issues early.
Key Features & Benefits
-
JavaScript ES6 Scripting: Write realistic and maintainable load tests using your existing JavaScript skills. This enables complex scenarios and easy integration with existing JavaScript libraries.
-
CLI-Driven: k6 is designed for automation from the ground up. It easily integrates with CI/CD tools like Jenkins, GitLab CI, and CircleCI.
-
Checks & Thresholds: Define pass/fail criteria for your tests. Base these criteria on metrics like response times, error rates, and request throughput. This helps automate performance validation.
-
Built-in HAR Converter & Browser Recording: Convert HAR files or record browser sessions. This lets you create realistic load tests based on actual user behavior.
-
Cloud Execution (k6 Cloud): k6 itself is open-source. However, k6 Cloud offers distributed cloud execution. It also provides advanced analytics and reporting for larger-scale load testing.
-
Native Cloud Support: k6 is designed for modern cloud environments. This ensures optimal performance and scalability.
Pros
-
Developer-Friendly: JavaScript makes k6 accessible to a wide range of developers.
-
Excellent CI/CD Integration: Automate load tests as part of your development pipeline.
-
Low Resource Footprint: k6 is efficient, letting you run larger tests with fewer resources than some older tools.
-
Modern Architecture: Built with a modern, cloud-native approach for better scalability and performance.
Cons
-
Limited Protocol Support: k6 supports fewer protocols than tools like JMeter. However, it excels with HTTP/1.1, HTTP/2, and WebSockets.
-
Smaller Community (Compared to JMeter): The k6 community is growing, but it’s still smaller than that of more established tools.
-
Advanced Features Require Paid Subscription: The core k6 tool is open-source. Features like cloud execution and advanced analytics require a k6 Cloud subscription.
Pricing
k6 is open-source and free. k6 Cloud has different pricing tiers based on usage and features. These range from a free tier to enterprise-level plans. Check the k6 website for current pricing.
Technical Requirements
k6 runs on most operating systems (macOS, Linux, Windows). It requires a relatively recent version of Go to build from source. Pre-built binaries are available for download.
Comparison with Similar Tools
Compared to JMeter, k6 is more modern and developer-friendly. JMeter supports more protocols, but k6 is easier to use and integrates better with CI/CD. Locust, another load testing tool, uses Python. This might be preferable for teams using Python extensively.
Implementation/Setup Tips
-
Start with the official k6 documentation. It offers detailed installation instructions and examples.
-
Use the k6 HAR converter to quickly create tests based on real user traffic.
-
Integrate k6 into your CI/CD pipeline early on in development.
-
Explore the k6 Cloud offering for distributed testing and advanced analytics as needed.
Website: https://k6.io/
k6 is a great option for development teams. Especially those wanting a modern, developer-centric load testing tool that fits into existing workflows. Its focus on JavaScript, CLI-first design, and cloud-native architecture makes it powerful and efficient for performance testing.
5. Gatling
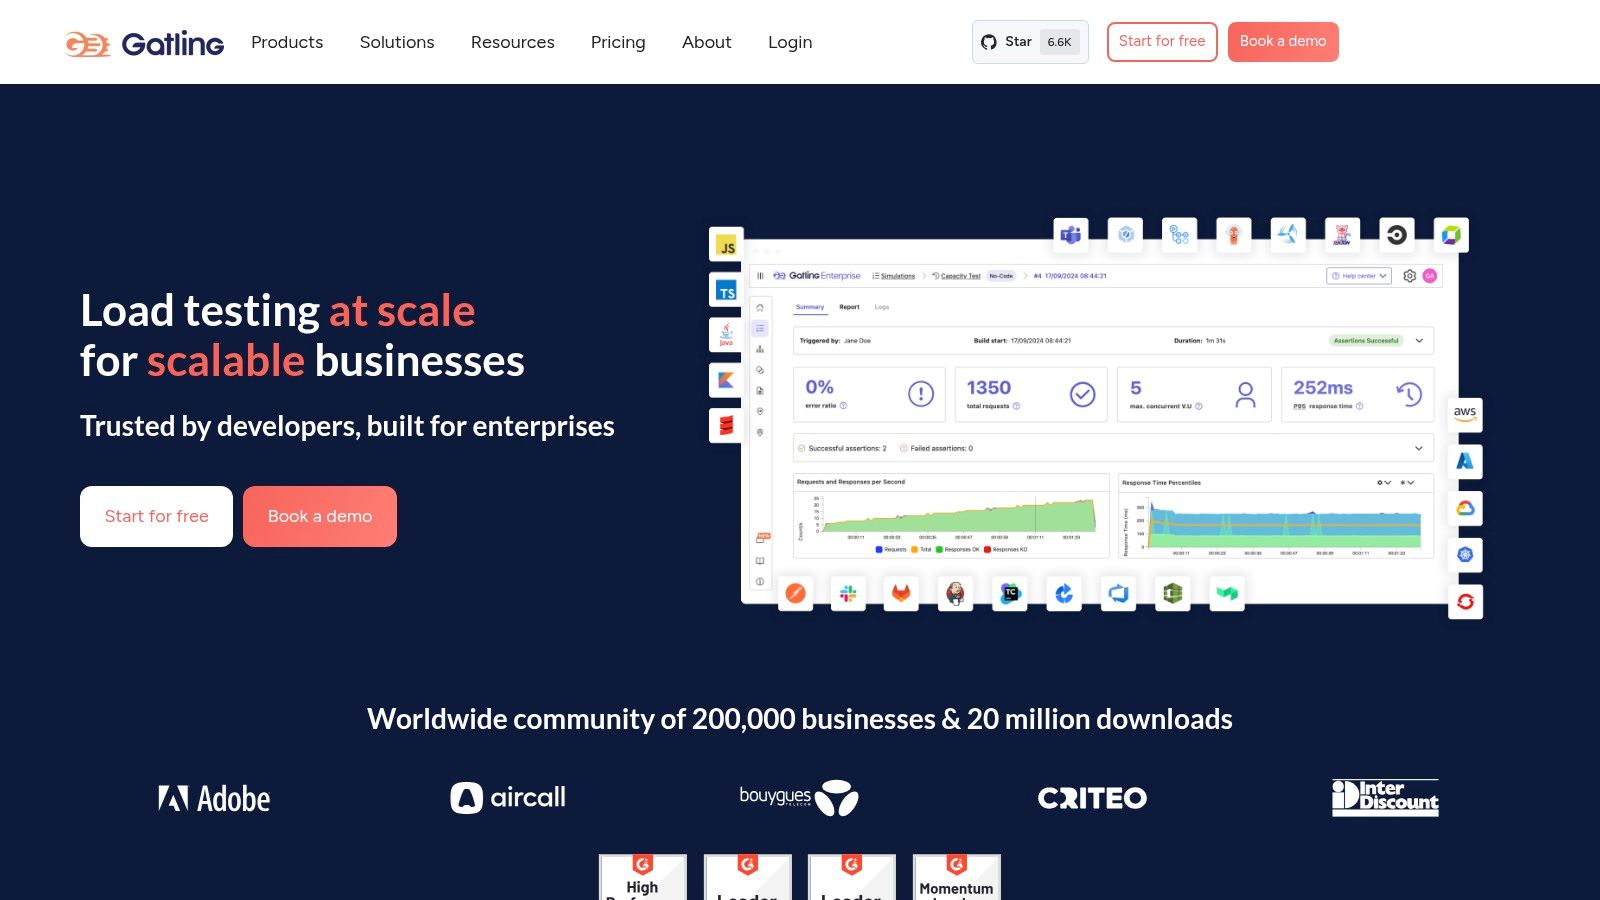
Gatling is a powerful open-source load testing tool built specifically for web applications. Its unique architecture, based on Scala, Akka, and Netty, allows it to simulate massive numbers of concurrent users with minimal hardware resources. This makes it a cost-effective solution for performance testing.
Gatling helps pinpoint bottlenecks and ensures your application can handle traffic spikes, whether during peak periods or large marketing campaigns. This robust tool provides vital insights into your application’s performance under pressure.
Using a domain-specific language (DSL), Gatling defines test scenarios. While this requires some coding knowledge, the code-based approach offers significant advantages. Version control, modularity, and reusability of test scripts become much easier, simplifying test maintenance as your application grows. This aligns perfectly with modern DevOps practices and CI/CD pipelines.
Key Features and Benefits
-
Asynchronous Concurrency Model: Unlike thread-based tools, Gatling’s asynchronous model efficiently handles thousands of concurrent users without consuming excessive resources. This leads to more accurate load testing and reduced hardware overhead.
-
Detailed HTML Reports: Gatling generates comprehensive and easy-to-read HTML reports. These reports provide key performance metrics such as response times, requests per second, and error rates. Sharing these reports with stakeholders is simple, which helps accelerate performance analysis and problem-solving.
-
Protocol Support: Gatling supports crucial web protocols, including HTTP(S) and WebSocket. It also supports JMS and JDBC for testing backend systems and databases.
-
Seamless CI/CD Integration: Easily integrate Gatling into your CI/CD pipeline to automate performance testing within your development workflow. This allows for continuous performance monitoring and early detection of performance regressions.
-
Growing Community and Enterprise Support: A vibrant and expanding community backs Gatling, offering abundant resources and support. Gatling Enterprise provides additional features like advanced reporting, real-time monitoring, and distributed load testing for large-scale performance testing needs.
Pros and Cons
Pros:
- Efficient performance with minimal resource usage
- Detailed, easy-to-understand HTML reports
- Code-based approach for better version control and reusability
- Strong enterprise adoption and community support
Cons:
- The Scala-based DSL can be challenging for non-programmers
- Protocol support is more limited than tools like JMeter or LoadRunner, although generally sufficient for most web applications
- Advanced features and integrations often require the paid Gatling Enterprise version
Pricing and Technical Requirements
Gatling is open-source and free to use. Gatling Enterprise offers paid plans with advanced features and support; pricing details are available on their website. Gatling runs on the Java Virtual Machine (JVM), requiring Java to be installed.
Implementation/Setup Tips
- Begin with the Gatling documentation and example scripts to learn the DSL.
- Structure test scenarios using modular components for easier maintenance and reusability.
- Integrate Gatling with your CI/CD system for automated performance testing.
- Consider Gatling Enterprise for advanced features like distributed load testing or real-time monitoring.
Comparison with Similar Tools
Compared to JMeter, Gatling offers superior performance thanks to its asynchronous architecture. While JMeter boasts a wider range of built-in protocols and a GUI-based approach, Gatling’s DSL allows for greater flexibility and maintainability for complex test scenarios. LoadRunner, a commercial tool, offers a more comprehensive feature set, but at a significantly higher price.
Website
Gatling excels in high-performance load testing for web applications, particularly when maintainability and CI/CD integration are critical. While the Scala-based DSL might present an initial learning curve, the benefits of its code-driven approach and efficient performance make it an invaluable tool for teams serious about performance testing.
6. Locust
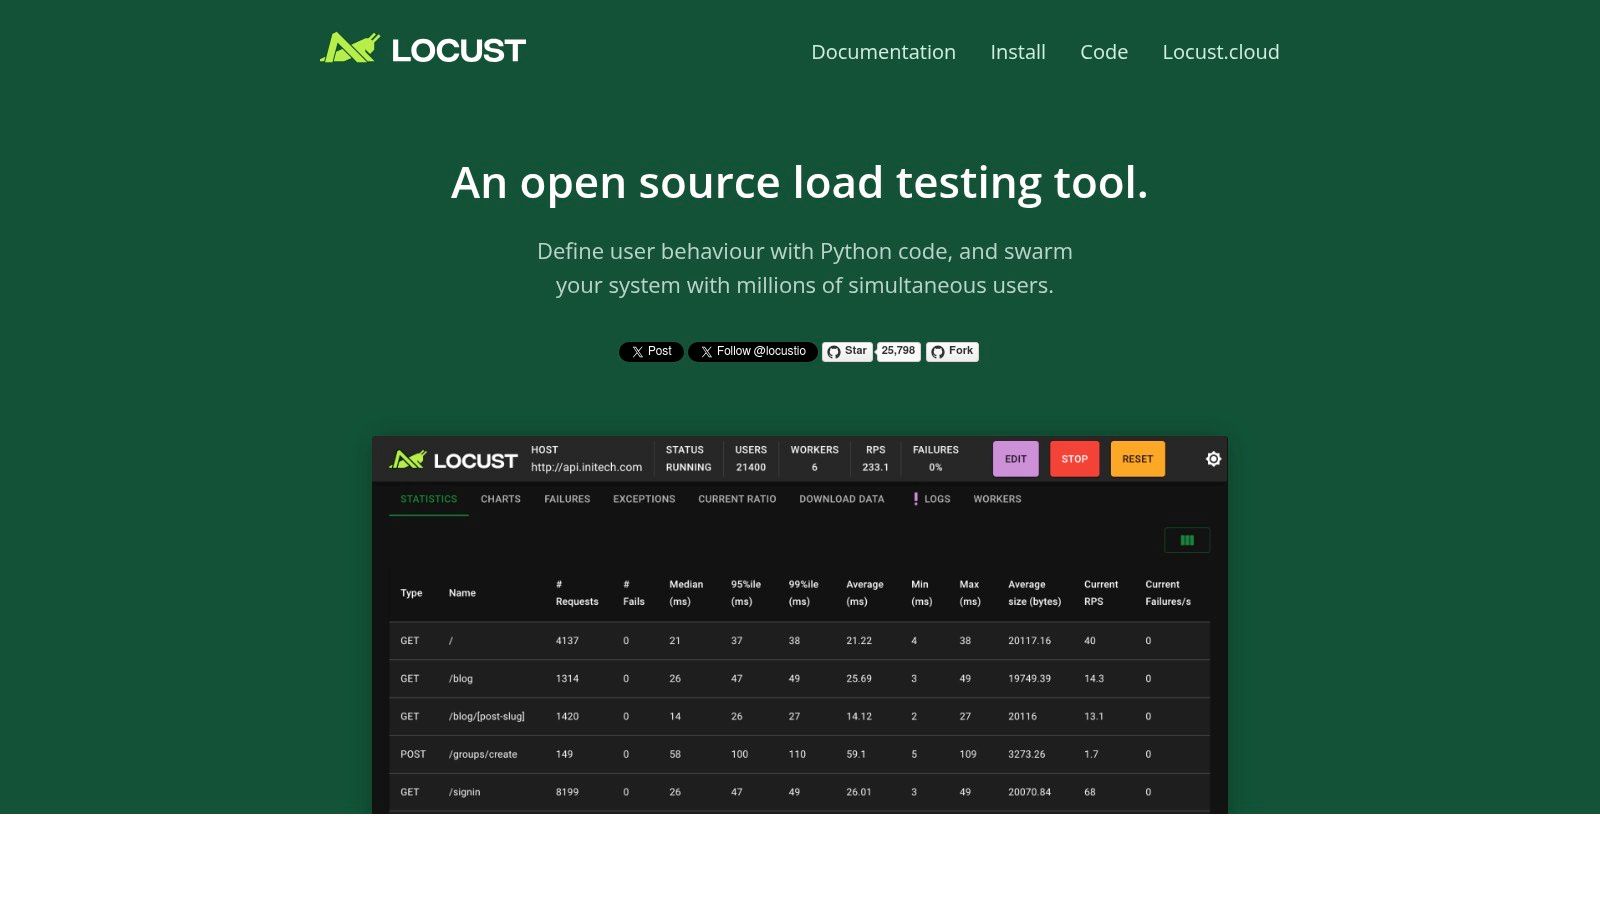
Locust is a powerful open-source load testing tool. Its Python-based scripting and scalability make it a top contender for teams proficient in Python. While it may present a steeper learning curve than some GUI-based tools, the control and flexibility it offers for load test scenarios are substantial.
Locust allows you to define user behavior using Python code. This enables intricate scenarios that go beyond the capabilities of many click-and-configure load testing tools. This is particularly useful for testing APIs, asynchronous workflows, and applications with complex user interactions. Think simulating users navigating a multi-step checkout, interacting with dynamic website content, or even engaging in real-time communication.
Key Features and Benefits
-
Python-Based Test Scripting: This unlocks incredible flexibility. Developers can use Python libraries, build custom functions, and implement complex test logic. Need to integrate with your existing authentication system? No problem. Need dynamic data for your requests? Python makes it straightforward.
-
Distributed Architecture for Large-Scale Testing: Simulate millions of concurrent users by distributing the load across numerous machines. This allows you to truly mimic real-world traffic and comprehensively stress-test your infrastructure’s limits.
-
Real-Time Web UI for Monitoring Tests: Locust offers a user-friendly web interface for real-time test monitoring. Observe metrics like requests per second, response times, and error rates, enabling quick identification of performance bottlenecks.
-
Broad Protocol Support: Locust supports more than just HTTP/S. Its compatibility with WebSockets and its extensibility for custom protocols make it a versatile tool for diverse applications.
Pros
- Highly Flexible Python Scripting: Design intricate and realistic test scenarios tailored to the specifics of your application.
- Developer-Friendly for Python Users: Leverage existing Python skills and a rich ecosystem of libraries.
- Scalable for Massive User Loads: Distribute tests across multiple machines with relative ease.
- Real-Time Monitoring with a Simple Web UI: Gain immediate performance insights throughout test execution.
Cons
- Less Comprehensive Than Enterprise Tools: Locust may not offer the full suite of advanced features found in some commercial load testing solutions.
- Distributed Testing Setup Can Be Complex: Configuring a distributed testing environment requires some technical know-how.
- Limited Built-In Integrations: Integrating with CI/CD pipelines may require manual configuration.
- Requires Python Knowledge: Not the best choice for teams without Python expertise.
Technical Details and Implementation Tips
Pricing: Free and open-source.
Technical Requirements: Python 3.7 or higher.
Implementation/Setup Tips:
- Begin with a simple test script to grasp Locust’s API fundamentals.
- Monitor and adjust test parameters in real-time using the web UI.
- Explore distributed testing for simulating significant user loads.
- Leverage Python libraries to enhance test scripts and data generation.
Comparison With Similar Tools
Compared to tools like JMeter, Locust provides more flexibility for Python-savvy developers. While JMeter boasts a more visual interface, Locust’s code-driven approach allows for more intricate and customizable scenarios. Tools like k6 also offer code-driven testing, but using JavaScript. Locust remains a strong choice for Python-centric teams.
Website: https://locust.io/
7. BlazeMeter
BlazeMeter, now a part of Perforce, is a powerful cloud-based load testing platform built for massive scalability. It’s a great choice for organizations that need to simulate substantial user traffic and identify performance bottlenecks in their applications, APIs, and websites. Unlike tools requiring complex setup and infrastructure management, BlazeMeter simplifies the process with its cloud-based nature and intuitive interface.
One of BlazeMeter’s key strengths is its support for popular open-source load testing tools like JMeter, Gatling, and Selenium. This allows teams to use existing scripts and expertise, avoiding the need to learn a brand-new platform. BlazeMeter also offers a scriptless test creation option using a Chrome extension, making it accessible to a wider range of users, even those new to scripting.
Key Features and Benefits
-
Cloud-Based Testing with Global Load Generation: Simulate real-world user traffic from various geographic locations, ensuring your application performs well under diverse network conditions. This is especially important for businesses with a global user base.
-
Scriptless Test Creation: Using the Chrome extension, quickly create load tests without needing deep coding knowledge. This speeds up the testing process and allows non-technical team members to contribute.
-
Open-Source Tool Integration: Utilize existing JMeter, Gatling, and Selenium scripts, minimizing the learning curve and enabling teams to reuse their current testing assets.
-
Advanced Analytics and Reporting: Get detailed insights into performance metrics with thorough reports and dashboards. Identify bottlenecks and understand how load impacts application response times, error rates, and resource utilization.
-
API Testing and Monitoring: BlazeMeter goes beyond UI testing to include API performance, ensuring your backend services can handle the expected load.
Practical Applications and Use Cases
-
Testing Web Applications: Ensure your web application can handle traffic spikes without performance issues before major releases or marketing campaigns.
-
Evaluating Mobile App Backend Scalability: Test the resilience of your APIs under various load conditions.
-
Validating IoT Platform Performance: Simulate numerous connected devices interacting with your platform.
-
Continuous Performance Testing: Integrate BlazeMeter with your CI/CD pipelines to automate performance testing.
Pros
- Easy scaling from small tests to large distributed loads.
- Seamless integration with popular open-source tools.
- User-friendly interface with minimal setup.
- Strong enterprise support and SLAs.
Cons
- Subscription-based pricing can be a concern for large tests. Contact BlazeMeter for specific pricing information.
- Configuring some advanced features can be complex.
- Reliance on cloud infrastructure for large-scale tests.
- Advanced scripting may require JMeter knowledge.
Implementation/Setup Tips
- Begin with a small test to become familiar with the platform.
- Utilize the Chrome extension for quick scriptless tests.
- Explore pre-built CI/CD tool integrations.
- Consult BlazeMeter’s documentation and support resources.
Comparison with Similar Tools
While tools like LoadView and k6 offer comparable features, BlazeMeter stands out due to its comprehensive open-source tool integration and robust reporting capabilities. This makes it an attractive option for organizations invested in the JMeter ecosystem or needing detailed performance analysis.
Website: https://www.blazemeter.com/
8. LoadNinja
LoadNinja, by SmartBear, simplifies load testing for web applications, providing a valuable tool for development teams and QA professionals. Unlike traditional protocol-based tools, LoadNinja uses real browsers at scale. This provides more accurate performance data and streamlines the testing workflow. This cloud-based platform lets you quickly create and run load tests without the complexities of scripting and correlation, focusing on results that reflect the actual end-user experience.
Practical Applications & Use Cases
LoadNinja excels in situations where understanding real user experience under load is critical:
- Testing web applications with complex JavaScript and AJAX calls: Because LoadNinja uses real browsers, it accurately measures the performance impact of client-side processing, an aspect often missed by protocol-based tools.
- Validating the performance of dynamic web applications: Dynamic values are correlated automatically, removing the tedious manual work often necessary with other load testing tools.
- Quickly assessing the impact of code changes on performance: The intuitive interface and rapid test creation process make LoadNinja ideal for continuous integration and continuous delivery (CI/CD) pipelines.
- Pinpointing performance bottlenecks: The virtual user debugger allows inspection of individual virtual user sessions to identify the root cause of performance issues.
- Load testing from different geographic locations: As a cloud-based platform, LoadNinja allows testing from various locations, simulating realistic user distribution and network conditions.
Features & Benefits
- Real Browser-Based Load Testing: This eliminates scripting and correlation, significantly reducing test creation time. It also delivers more precise performance data, capturing the full user experience, including browser rendering and client-side script execution.
- Codeless Test Recording & Playback: Record user interactions in the browser, and LoadNinja automatically creates the load test script.
- Virtual User Debugger: This feature lets you step through the test execution of individual virtual users, identifying performance bottlenecks in real-time.
- Advanced Analytics with User Experience Metrics: LoadNinja provides detailed performance metrics, including page load times, request response times, and resource utilization.
- Integration with SmartBear Products: Seamless integration with other SmartBear tools, such as Zephyr and SoapUI Pro, supports a unified testing strategy.
Pros
- No scripting is required, drastically reducing test creation time.
- Real browser testing delivers accurate user experience metrics.
- Faster test creation compared to traditional script-based tools.
- Integrates with other SmartBear products for a comprehensive testing ecosystem.
Cons
- Higher cost compared to open-source or protocol-level tools.
- Limited customization options compared to code-based solutions.
- The maximum concurrent user count might be lower than some enterprise-grade alternatives.
- Primarily focuses on browser-based testing, with limited protocol-level coverage.
Pricing and Technical Requirements
LoadNinja offers subscription-based pricing. Contact SmartBear directly for detailed pricing information. As a cloud-based solution, LoadNinja’s technical requirements are minimal, needing only a stable internet connection and a modern web browser.
Comparison with Similar Tools
Tools like JMeter and Gatling offer protocol-level testing with extensive customization options but require significant scripting. LoadNinja prioritizes ease of use and real browser testing, making it suitable for teams seeking faster test creation and precise user experience insights.
Implementation/Setup Tips
- Start with a small-scale load test to familiarize yourself with the platform.
- Use the virtual user debugger to find and fix performance bottlenecks early.
- Take advantage of integrations with other SmartBear products for a streamlined workflow.
Why LoadNinja Deserves Its Place in the List
LoadNinja tackles the difficulties of traditional load testing with a user-friendly, cloud-based platform that utilizes real browsers. This approach reduces the time and effort needed to create and run meaningful load tests. Teams can then focus on delivering high-performing web applications. Its focus on real browser testing provides an accuracy level that surpasses protocol-based tools, making it a vital asset for understanding and optimizing user experience under load.
Website: https://smartbear.com/product/loadninja/
9. NeoLoad
NeoLoad, by Tricentis, is a robust performance testing platform designed for enterprise applications. Its strength lies in balancing user-friendliness with advanced features, making it suitable for both simple and complex performance testing needs. This makes NeoLoad a strong option for organizations aiming to optimize the performance of their key applications, from traditional web apps to modern microservices and APIs.
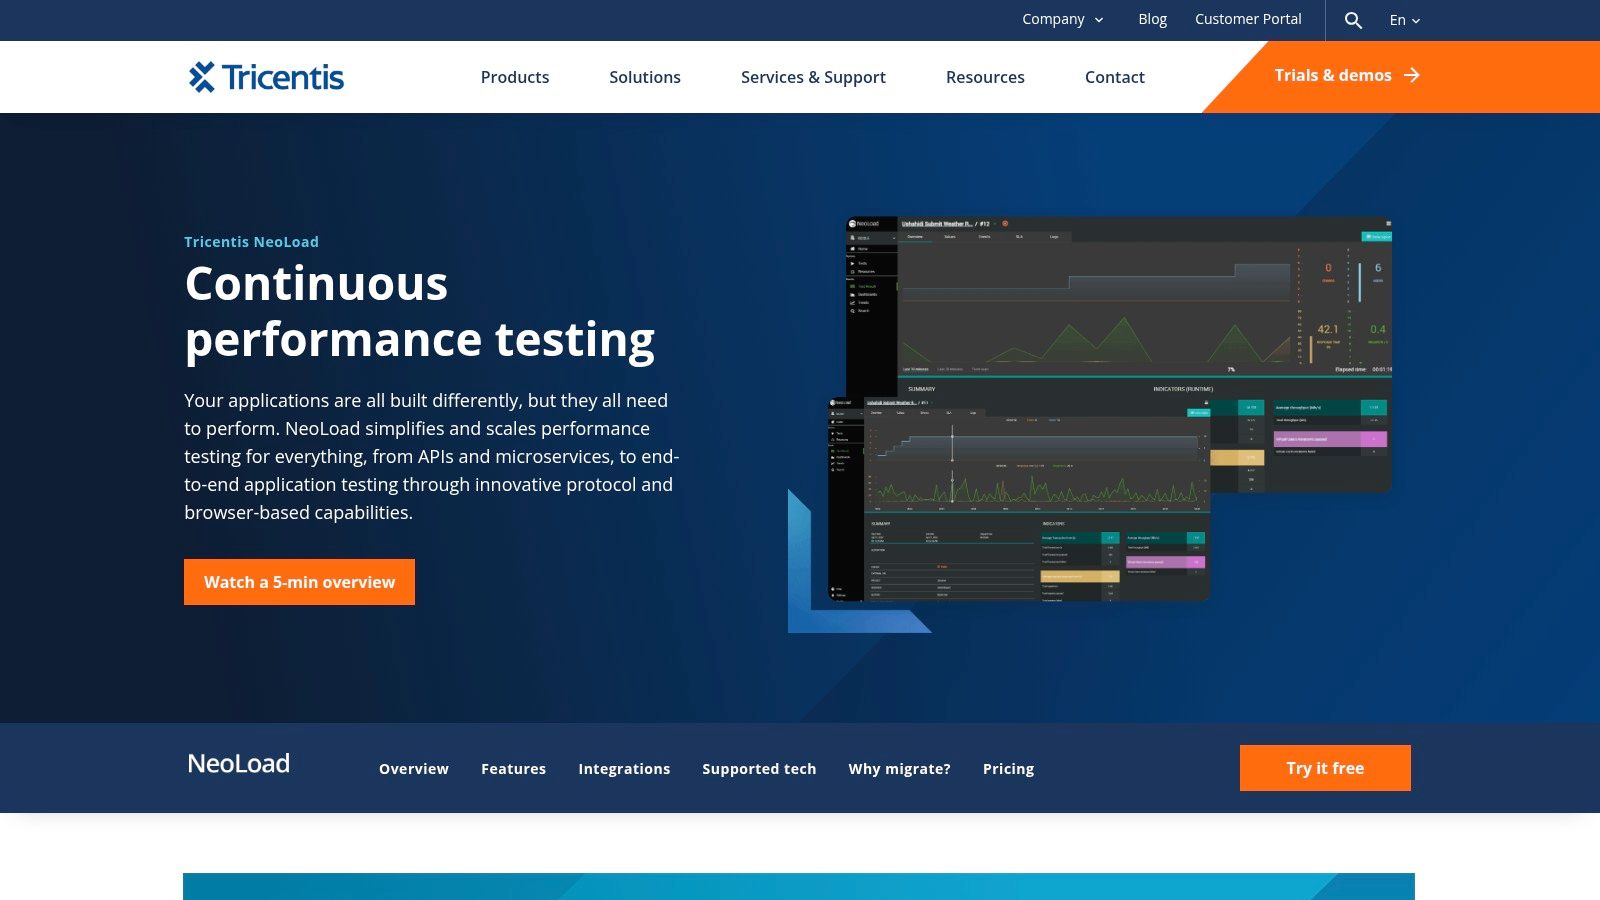
NeoLoad excels in its support for current technologies and architectures. If your organization works with microservices, APIs, IoT devices, or even complex web and mobile applications, NeoLoad offers the tools and integrations necessary for comprehensive performance testing. It also continues to support legacy systems, making it a flexible solution during application modernization. For example, you can use NeoLoad to simulate thousands of users interacting with your API endpoints, revealing potential bottlenecks and performance issues under pressure.
Key Features and Benefits
-
Code-less Test Design: The drag-and-drop interface empowers testers to create and adjust complex test scenarios without needing extensive coding skills. This speeds up test creation and simplifies the learning process.
-
Automated Correlation and Test Maintenance: NeoLoad automates time-consuming tasks like correlation and script updates. This reduces maintenance work and allows teams to concentrate on analyzing performance data.
-
Broad Technology Support: Supports various technologies, including web, mobile, API (REST, SOAP, GraphQL), microservices, IoT, and more.
-
DevOps Integration: Integrates with CI/CD pipelines and APM tools like Jenkins, Bamboo, and Dynatrace, allowing for continuous performance testing throughout the development lifecycle. Automated performance tests can become a regular part of your build process.
-
Distributed Load Generation and Cloud Scaling: Use cloud resources to generate large-scale loads and simulate realistic user traffic from various locations. This is essential for testing application performance under peak conditions.
Pros
- Intuitive Interface: Easy to learn and use, even for those without a programming background.
- Strong Enterprise Support: Offers robust features and support tailored for complex applications.
- Efficient Resource Usage: Optimized for performance testing, ensuring effective use of hardware.
- Excellent DevOps Toolchain Integration: Supports continuous performance testing within agile development workflows.
Cons
- Pricing: Enterprise licensing can be costly for smaller teams or projects. For detailed pricing, contact Tricentis directly.
- Advanced Feature Setup: Setting up some advanced features might require initial time and effort.
- Flexibility: While powerful, it may not be as adaptable as code-based solutions for highly specific and complex scenarios.
- Community Size: Has a smaller community compared to open-source options.
Implementation/Setup Tips
- Start with the official Tricentis documentation.
- Use the tutorials and training materials to get familiar with the platform.
- Begin with basic test scenarios and gradually add complexity.
- Consider the integration possibilities with your current DevOps tools.
Comparison with Similar Tools
NeoLoad competes with tools like LoadRunner, JMeter, and Gatling. While JMeter and Gatling are open-source and offer cost advantages, NeoLoad stands out with its user-friendly design and strong support for enterprise applications and integrations. LoadRunner is another enterprise-level option, but NeoLoad often excels with its modern handling of newer technologies and efficient resource use.
Why NeoLoad Deserves Its Place on This List
NeoLoad is valuable because it handles a wide array of performance testing requirements. Its combination of usability, advanced features, and support for modern technologies makes it a powerful choice for organizations seeking to enhance application performance and ensure a positive user experience. The focus on automation and DevOps integration strengthens its place as a leading performance testing platform.
Website: https://www.tricentis.com/products/performance-testing-neoload
10. Artillery
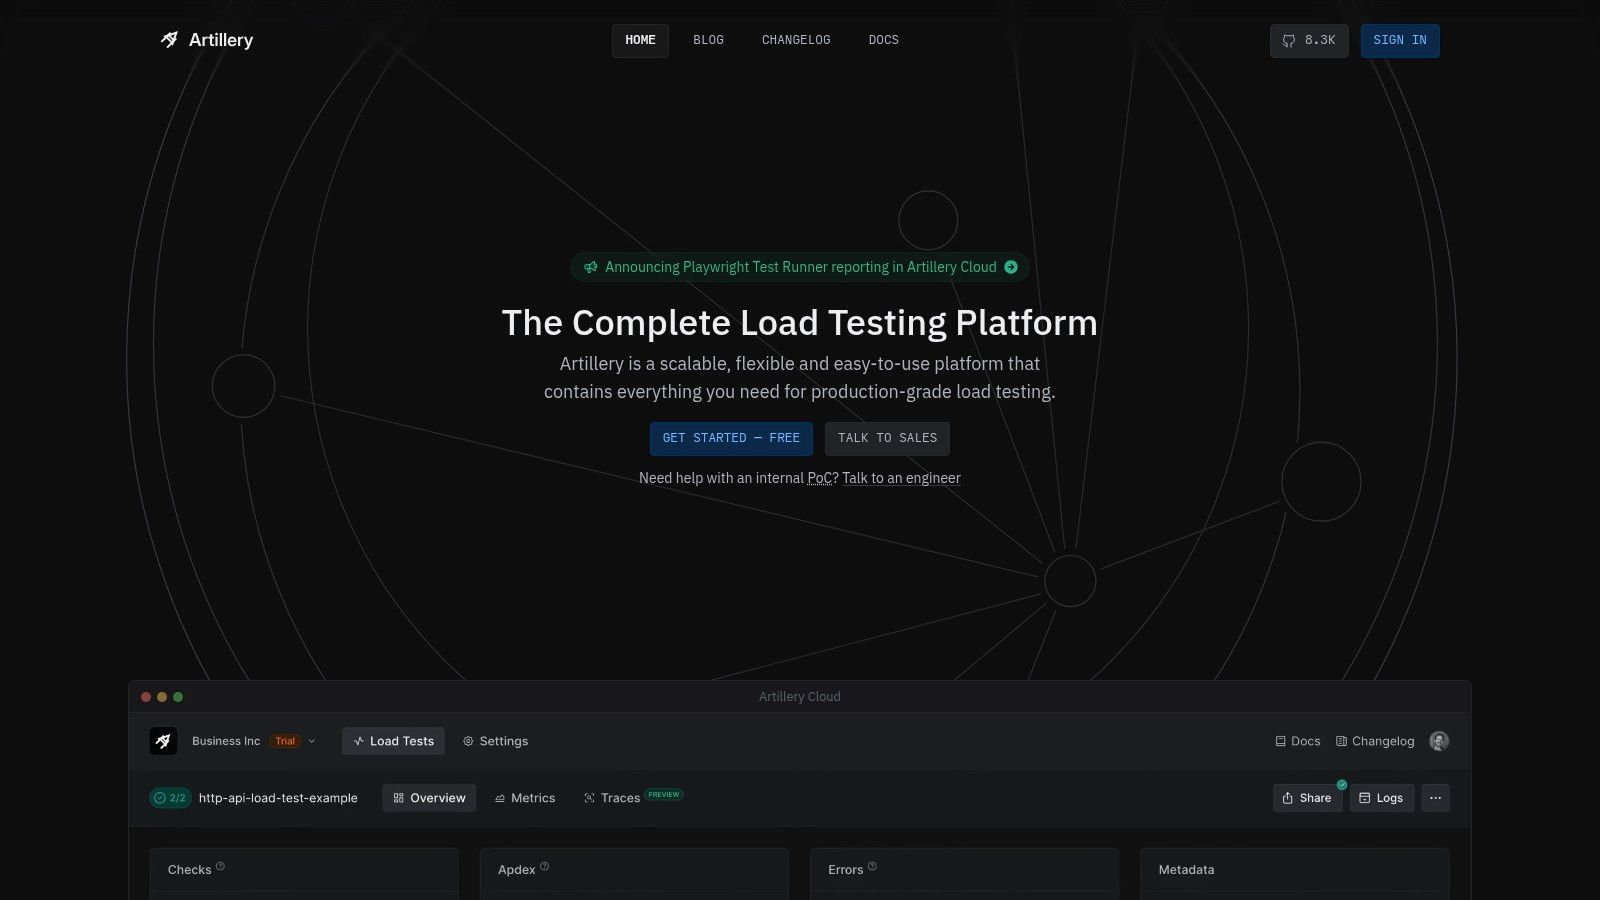
Artillery is a modern load testing solution designed for cloud-native architectures. It’s a great choice if you’re focused on testing APIs, microservices, and websockets in a streamlined and developer-friendly manner. Its simplicity and easy integration into modern development workflows make it perfect for agile and DevOps-focused teams.
Artillery is a powerful yet lightweight load testing toolkit built with Node.js. It simulates virtual users interacting with your cloud-native applications, microservices, and APIs, helping you identify performance bottlenecks and ensure scalability. Its YAML-based scenario configuration makes it particularly appealing to developers already comfortable with JavaScript and YAML.
Key Features and Benefits
-
YAML-Based Scenario Configuration: Defining even complex load tests is easy with Artillery’s human-readable YAML syntax. This simplifies test creation and maintenance, allowing for quicker iterations and better collaboration.
-
Support for Diverse Protocols: Artillery supports HTTP, WebSocket, Socket.io, and Kinesis, covering a good range of modern application protocols. Pluggable engines allow you to extend support for custom protocols if needed.
-
Integration with CI/CD Pipelines: Artillery integrates seamlessly into continuous integration and continuous delivery workflows. This enables automated performance testing as part of your deployment process, promoting proactive performance management.
-
Extensible with JavaScript: Customize and extend Artillery’s functionality using JavaScript. This allows for complex scenarios, custom metrics, and integration with other development tools.
Pros
-
Developer-Friendly: The simple YAML configuration and JavaScript integrations make Artillery easy for developers to set up and customize.
-
Ideal for API and Microservices Testing: Its architecture is specifically designed for testing modern applications built on APIs and microservices.
-
Lightweight and Efficient: Artillery’s minimal resource usage makes it suitable for running load tests from various environments, including CI/CD pipelines and local machines.
-
Easy Integration with JavaScript Ecosystems: It works well with other tools and libraries in the JavaScript ecosystem.
Cons
-
Limited Protocol Support: Compared to some enterprise tools, Artillery supports fewer protocols.
-
Smaller Community and Plugin Ecosystem: While the community is growing, it’s smaller than those of more established tools, meaning fewer readily available plugins.
-
Less Suited for Complex UI Testing: Artillery is primarily for backend performance testing and is not ideal for complex UI testing.
-
Limited Advanced Reporting (Without Extensions): Basic reporting is included, but advanced reporting may require custom extensions or integrations.
Pricing and Technical Requirements
Artillery offers both open-source and commercial versions (Artillery Pro), which offers additional features like advanced reporting and distributed load generation. Check the Artillery website for current pricing. Artillery requires Node.js and npm (Node Package Manager).
Implementation/Setup Tips
- Install Artillery globally using npm:
npm install -g artillery - Define your load testing scenarios in YAML files.
- Run your tests with the
artillery runcommand.
Comparison with Similar Tools
Tools like k6 and Locust offer similar developer-friendly experiences. However, Artillery’s focus on cloud-native architectures and its YAML-based configuration makes it arguably easier to learn and use for teams already familiar with YAML.
Artillery provides a strong, developer-focused approach to load testing. Its ease of use, integration with modern development practices, and focus on API and microservices make it a valuable tool for ensuring your applications perform and scale effectively.
Top 10 Load Testing Tools: Feature Comparison
| Tool | Core Features ✨ | User Experience ★ | Value Proposition 💰 | Target Audience 👥 |
|---|---|---|---|---|
| GoReplay 🏆 | Session-aware replay, TLS optimization, analytics | Proven & realistic; trusted by Fortune 500 | Free & Enterprise options; robust performance | Developers, QA, DevOps, Enterprises |
| JMeter | Multi-protocol support; extensive plugin ecosystem | Highly customizable; active community ★ | Completely free & open-source | Testers, Enterprises, Open-source Users |
| LoadRunner | Supports 50+ protocols; AI-driven analytics | Enterprise-grade; detailed diagnostics ★ | Premium pricing; comprehensive support | Large Enterprises, DevOps Teams |
| k6 | JavaScript scripting; CLI-first, cloud native | Developer-friendly; streamlined ★ | Cost effective; modern architecture | Developers, CI/CD Engineers |
| Gatling | Scala-based DSL; high efficiency; asynchronous model | Efficient & detailed HTML reports ★ | Free & Enterprise versions | Developers, Performance Testers |
| Locust | Python scripting; distributed test architecture | Flexible with real-time UI ★ | Free & scalable; simple setup | Python Developers, Testers |
| BlazeMeter | Cloud-based; supports multiple open-source tools | User-friendly; scalable ★ | Subscription-based; enterprise-ready | Enterprises, Load Testing Teams |
| LoadNinja | Real browser testing; codeless recording | Intuitive; accurate user experience ★ | Faster test creation, though higher cost | Web Testers, UX Teams |
| NeoLoad | Drag-and-drop design; automated correlations | Intuitive; enterprise-centric ★ | Enterprise pricing; strong CI/CD integration | Enterprises, DevOps Professionals |
| Artillery | YAML configuration; Node.js based; lightweight | Developer-focused; minimal resource use ★ | Affordable; designed for cloud-native apps | Developers, Microservices Teams |
Ready to Load Test?
Choosing the right load testing software depends on a variety of factors specific to your needs. Consider your technical expertise, your budget, the scale of your testing, and the protocols your application uses. Open-source tools like JMeter, Locust, and GoReplay offer flexibility and cost-effectiveness. Enterprise solutions like LoadRunner, NeoLoad, and BlazeMeter provide advanced features, robust support, and more comprehensive reporting. Developer-friendly tools such as k6 and Artillery prioritize scripting efficiency and integration with CI/CD pipelines.
Factors like ease of use, community support, and available documentation should also influence your decision. Integrating with your current monitoring and performance analysis tools is essential to create a smooth performance testing workflow. This will give you a centralized view of your application’s performance.
Getting started with load testing involves defining your performance goals. You’ll need to identify key user flows and create realistic test scenarios. Selecting the correct tool is paramount. Once chosen, familiarize yourself with the tool’s documentation and examples.
Start with smaller tests to validate your setup, gradually increasing the load. This helps you identify bottlenecks and performance limitations early on. Remember to monitor your application’s server resources, such as CPU, memory, and I/O, during testing to pinpoint the root cause of any performance issues.
Budget Considerations
Budget is a key factor in your decision-making process. While open-source tools are free to use, they often require more time and resources for setup and maintenance. You may also find yourself developing custom plugins. Enterprise solutions often have licensing fees, but provide dedicated support and advanced features that can save you time in the long run. Assess the long-term costs and benefits based on your team’s size, project scope, and testing frequency.
Compatibility
Compatibility is critical. Ensure your chosen tool supports your application’s protocols and technologies (e.g., HTTP, HTTPS, WebSockets, gRPC). Verify compatibility with your development, CI/CD, and monitoring infrastructure. A seamless integration will improve your overall workflow.
Key Takeaways
- Define clear performance goals: What are your target response times, throughput, and acceptable error rates?
- Choose the right tool: Consider your budget, technical expertise, and specific application requirements.
- Start small and scale gradually: Begin with smaller tests and progressively increase the load to avoid overwhelming your system.
- Monitor server resources: Track resource utilization to identify bottlenecks and performance issues effectively.
- Integrate with existing tools: Create a streamlined performance testing workflow with seamless integrations.
Ready to take control of your application’s performance and ensure a seamless user experience? GoReplay offers a robust and versatile solution for load testing, capturing and replaying real HTTP traffic to uncover performance bottlenecks before they impact users. From its free and open-source edition, ideal for individual developers, to the enterprise version packed with advanced features, GoReplay empowers you to test with confidence. Start optimizing your application performance today!