
Load Testing Report: Sections, Metrics and How to Read Them

Elite software-delivery teams in 2024 had a 5% change-failure rate. Low-performing teams had 40%, according to the DORA performance clusters summarised by Octopus Deploy. Every release decision sits somewhere between those two numbers, and a load testing report is the evidence a team brings to it.
Most reports don’t behave like evidence. They arrive as a tool’s HTML export: charts, a green banner, and no statement of what load was applied, which thresholds were agreed beforehand, or which environment produced them. A reader can’t tell whether the system passed a test or the test passed the system.
What follows is how a performance engineer reads that document with a QA lead sitting alongside. Definitions first, because a percentile means nothing until you know what was counted. Then the sections, the metrics, the thresholds, the comparison, the diagnosis, the business link and the decision. Each number gets the same treatment: what it proves, and what it leaves out.
Sections Every Load Testing Report Should Include
A report gets read in a fixed order, and the order matters more than the page count. A reviewer scans for a verdict, checks the conditions it applies to, then reads the numbers. Seven parts carry that job.
-
The summary. One page. The verdict, the load it covers, and a pass or fail against each threshold agreed before the run, such as p95 latency under 500 ms and an error rate under 0.5 percent. If a reader stops here, they should still know whether to ship.
-
The scope. Named transactions, endpoints, and the traffic mix with its weights. A report that says “the API” without saying which routes were exercised leaves the reader guessing whether the busiest one was included.
-
The environment. Topology, software versions, instance counts and sizes, dataset volume, cache state, and where the load generator ran. This is the section weak reports skip, and it’s the one that decides whether a number can be reproduced at all.
-
The results. Throughput, latency percentiles and error counts at every load step, reported per transaction rather than as one global figure.
-
The saturation picture. CPU, memory, database wait time and connection-pool use placed on the same timeline as the results, because a symptom without a cause is a complaint.
-
The comparison. Change against the previous release, with the confidence limits attached to each delta.
-
The recommendation. The next capacity action, with an owner and a retest condition. A report that ends at “PASS” answers nothing when an incident six months later asks what load the system was ever tested at.
Read these two first: the environment section and the threshold definitions. Everything else depends on them, and neither can be reconstructed after the run.
The threshold definitions matter as much as the environment. A pass measured against a limit chosen after the results arrived isn’t a verdict, it’s a rationalisation. When both sections are present and specific, the rest of the document deserves careful reading. When either is missing, treat the headline numbers as a description of one afternoon on one machine rather than as capacity evidence.
Core Metrics and What Each One Tells You
Every number in a report measures something narrower than the word used for it. “Latency” is a distribution, not a value. “Capacity” is a claim about requirements, not about hardware. Define the metric before quoting a figure, or the reader will supply their own definition and reach a conclusion you didn’t intend.
The table below is the reference shape a results section should take once the run is over.
| Metric | What it measures | How to report it |
|---|---|---|
| Median latency | Typical response time | Milliseconds per transaction, per load step |
| p95 latency | Response time of the slowest five percent | Milliseconds, with the threshold beside it |
| p99 latency | Response time of the slowest one percent | Milliseconds, with the tail behavior described |
| Throughput | Achieved requests per second | Achieved versus requested rate |
| Error rate | Failed requests as a share of total | Percentage, with error classes listed |
| Timeouts | Requests exceeding the client limit | Count and share per load step |
| Concurrency | Active users or in-flight requests | Peak and steady-state values |
| Test duration | Length of ramp, steady state and peak | Minutes per window, warm-up excluded |
| Resource utilization | CPU, memory, disk and network use on the server | Percent per component over time |
| Database wait and pool saturation | Lock waits and connection-pool use | Milliseconds of wait and percent of pool in use |
Two rows get misread more often than the rest.
Throughput is an outcome, not a setting
You don’t set throughput. You set an arrival rate, a concurrency level or an injection profile, and throughput is what the system managed in response. If the generator asked for 5,000 requests per second and the system served 4,200, that gap is the finding. Reports that print only the achieved number hide the shortfall, and reports that print only the requested number describe an intention rather than a measurement.
Publish both, alongside generator health. A saturated load generator under-delivers load and inflates client-side latency, and the report then blames the application for a problem in the test rig.
The mean is a sanity check and nothing more
Response times are skewed, multi-modal and heavy-tailed. Two very different user experiences can produce an identical average, which is why the median belongs in the table but shouldn’t headline it. The p95 and p99 decide, because they describe the users who waited longest.
Sample size bites here too. A p99 computed from 400 requests rests on four data points, and a report that prints the figure without the count is inviting a conclusion the data can’t carry.
The ISO/IEC 25010 quality-attribute mapping gives the cleanest filing system for all of this. Map each result to one of three performance-efficiency dimensions, time behaviour, resource utilization and capacity, and for every business-critical transaction report request volume, achieved throughput, the latency distribution at minimum at median, p95 and p99, timeout and error counts, concurrency and test duration. It also insists on pairing client-observed latency with server-side CPU, memory, disk and network utilization, database wait or lock time, connection-pool saturation, queue depth and garbage-collection indicators. Without those, a latency jump is a mystery. With them, it’s a diagnosis.
Deciding what to instrument happens before the run, and it’s a different exercise from reading the output afterwards. Our guide to essential performance testing metrics covers the capture side.
Privacy-Safe Test Data and Replay Evidence
A sentence stating that the workload data was anonymized is a claim. It isn’t evidence, and a reviewer can’t check it. The question that matters is narrower and harder: does the test data still behave like production after the masking was applied, and can you show it?
Answering that means documenting five things and measuring one.
-
Provenance. Which production window the requests came from, the sampling rule applied, and the volume retained.
-
The masking method. Which fields were replaced, in what way (substitution, tokenisation, synthesis), and how dependent identifiers were mapped so joins survive the swap.
-
Distribution drift. Request size, endpoint share and regional pattern before and after masking, with the difference stated rather than implied.
-
Referential integrity. A masked customer identifier still resolves to that customer’s orders. If it doesn’t, the checkout journey in your test is not the checkout journey in production.
-
Residual re-identification risk. An estimate, plus the fields that drive it. “Low” with no reasoning isn’t an estimate.
The trade-off deserves its own paragraph in the report. Production-representative traffic can carry personally identifiable information and payment data, which places GDPR and PCI DSS obligations on the dataset the moment it leaves production. Strip enough to be safe and the workload stops resembling the system you’re testing.
The test a reviewer applies: if you can’t tell from the report whether the masked dataset has the same shape as production, the claim of realism hasn’t been made yet.
That tension is why industry guidance on enterprise performance testing treats production-scale, privacy-safe datasets as a chronic bottleneck and recommends versioning and refreshing them as production data changes. A report should name the version it used and the date it was refreshed, so a reviewer knows which production shape the numbers describe. The mechanics of replacing sensitive fields while keeping joins intact are covered in our guide to data masking and anonymization.
One rule belongs to sharing rather than testing. When you send a report or a sample to a vendor for review, leave credentials and production request data out. Our inquiry form asks for exactly that, and a screenshot pasted into a support ticket deserves the same care.
Setting Up a Repeatable Test Workload
A report that publishes one performance number without the conditions that produced it isn’t reproducible, and a number nobody can reproduce is a number nobody can defend in a release review. The guidance on reporting performance attributes is blunt about this: documenting reproducibility and the validity of the workload model belongs on the same footing as the result itself.
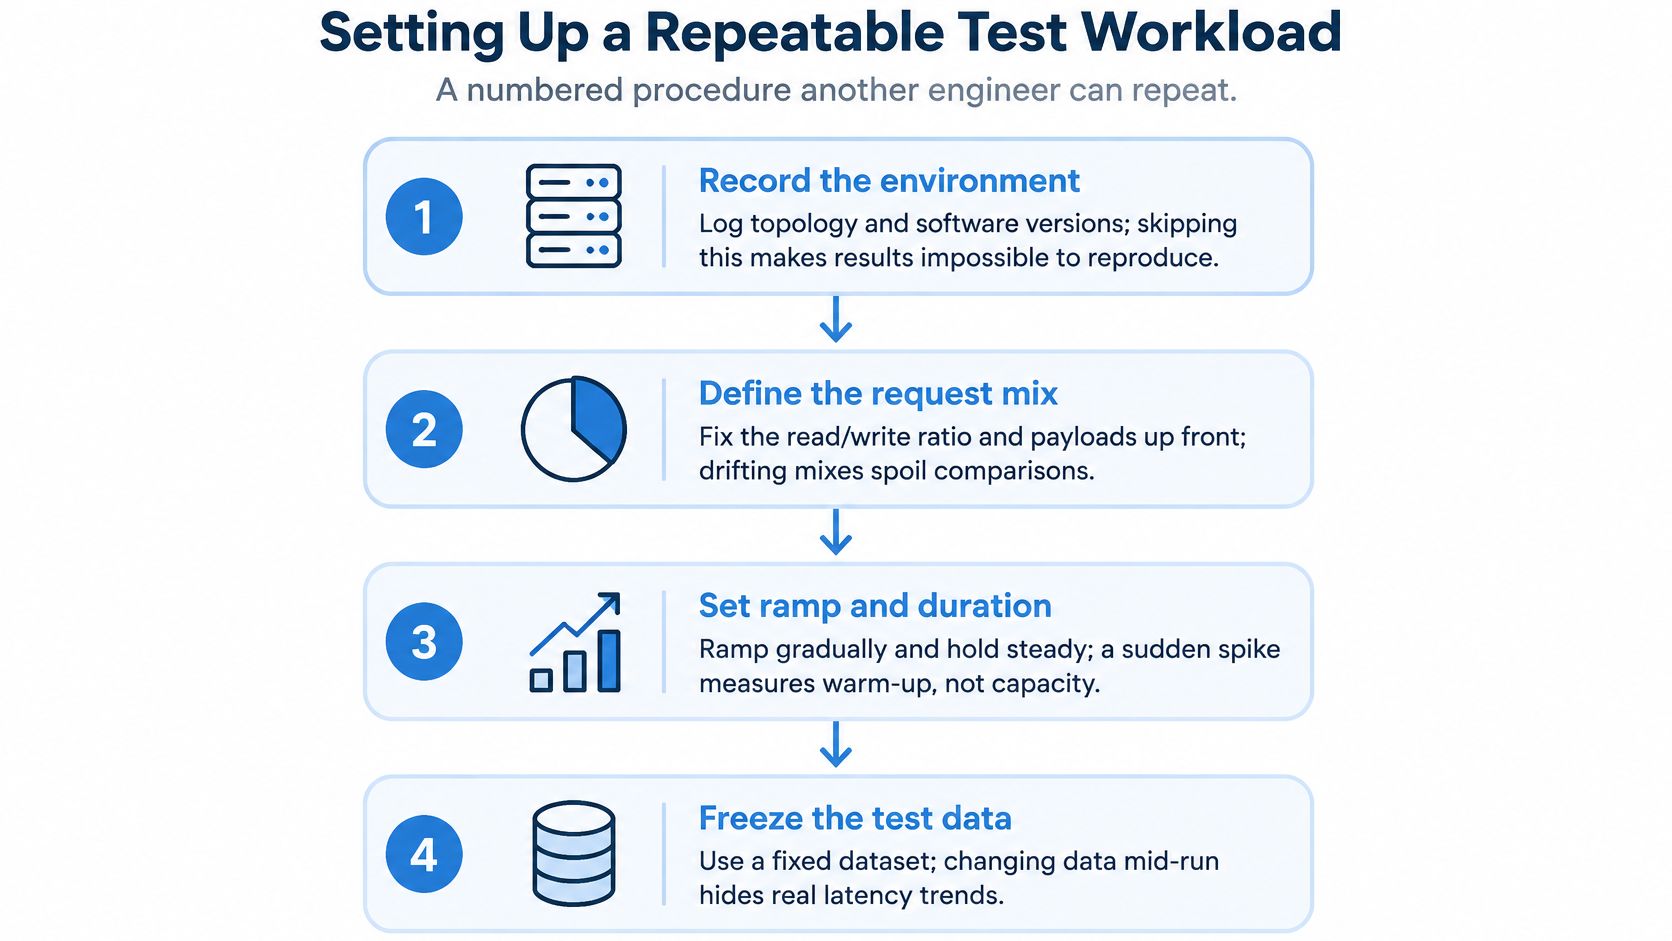
The procedure below compresses that setup into the decisions that make or break a run.
-
Record the environment before anything runs. Topology, software versions, instance counts and sizes, network path, cache state, dataset volume. A gap here can’t be reconstructed later, and the first question in the review will be whether the environment matched production.
-
Choose the workload model and say why. An arrival-rate model keeps sending requests whether the system is fast or slow. A virtual-user model slows its own arrivals as the target degrades, and can hide the exact overload you’re testing for. State which one you used, then fix the endpoint mix and request proportions from production, drawing on the masked, versioned dataset rather than the raw one.
-
Preserve session dependencies and reset the target state. Cookies, tokens and multi-step journeys have to survive the replay, and the database has to start each run from the same state. A shared database that drifts between runs skews every comparison that follows, usually in the direction of looking worse.
-
Baseline at minimal concurrency. A short run with a handful of users confirms the script authenticates, the data resolves and the generator reaches the target. Skip it and you’ll spend the peak run debugging your own setup.
-
Run the expected-peak test with a defined ramp, warm-up and steady-state window. Caches, connection pools and JIT compilation make the first minutes unrepresentative, so warm-up comes out of the verdict. The ramp schedule belongs in the report because a pass at steady state says nothing about the transition into it.
-
Run a stress test beyond the target. The purpose is to find where requirements stop holding, not to confirm they hold at the load you expect. Without this step the report has headroom but no breaking point.
-
Add a soak test where leaks or gradual drift matter. Sustained normal load for hours exposes the memory growth and connection accumulation a thirty-minute peak run never will.
-
Repeat each run and publish the spread. Cloud scheduling, garbage collection and cache warmth add noise between identical runs. Two runs are the minimum before calling anything a regression, and the spread belongs in the document.
Attach the raw artefacts at the end: time series, percentile histograms, notable outliers and the comparison with the previous release. Little’s Law gives a consistency check between concurrency, throughput and response time, and rising latency near resource saturation usually indicates queueing rather than an application-code regression. A release recommendation should state the tested load, the confidence limits, the bottleneck evidence and the next capacity action, not merely pass or fail.
Judging Results Against Pass-Fail Thresholds
Amazon engineers reported that adding 100 milliseconds of artificial delay to the shopping experience was associated with approximately a 1% reduction in sales. Google later reported that delays of 100, 200 and 400 milliseconds to search results reduced average daily searches per user by 0.20%, 0.29% and 0.59% respectively, according to the latency and revenue evidence compiled by WebOsmotic.
Two lessons follow for anyone holding a report. Degradation changes user behaviour before the system produces a single visible error, so a run with a 0% error rate can still describe a product people abandoned. And the size of the effect isn’t linear across products or workloads, which is why the report should preserve the exact delay level, traffic pattern, journey and measurement window instead of summarising them.
Set the thresholds before the run
Criteria written after the results are in bend toward the release date. Agree them first: a p95 limit per critical journey, a maximum error rate, a minimum throughput, and resource ceilings for CPU and memory. Then evaluate each one separately across the ramp, the steady state and the peak. A system can hold its target through a plateau and fail the moment traffic climbs, and only a per-window verdict shows that.
Here is a worked example with illustrative numbers, checked against a p95 limit of 500 ms and an error ceiling of 0.5 percent.
| Offered load (req/s) | Error rate | Verdict |
|---|---|---|
| 500 | 0.1% | Pass |
| 700 | 0.4% | Fail (p95 limit exceeded) |
At 500 requests per second, p95 sits at 320 ms with 0.1 percent errors, so that step passes. At 700, p95 reaches 1.4 seconds. The error column stays inside its limit, which is the trap: a reader scanning failures alone would call that step healthy. Sustainable capacity sits somewhere between those two loads, and the report should state it as an interval rather than as the highest load that was generated.
A pass is per window. A system that passes in steady state and fails during the ramp hasn’t passed. It has answered a narrower question than the one the release asks.
Capacity means the maximum load at which requirements still hold. The point where they break is a breaking point, and labelling it capacity tells the next planning cycle that the system is fine at a load it has already failed. Report both, with the headroom between them.
Which thresholds need business sign-off before the run starts? The ones a customer would notice: checkout p95, search response time, sign-in success. An engineer can propose those numbers. The product owner owns them, and the report is stronger when it names who agreed to what.
Comparing Runs Against the Previous Release
A single report describes one moment. What a release review needs is the difference between this moment and the last accepted one, measured on the same system, under the same workload, with the same data.
What makes a delta trustworthy
-
Hold the workload constant. Same endpoint mix, same arrival model, same ramp schedule, same dataset version. Change any of them and you’re measuring the difference between two tests rather than between two releases.
-
Compare like percentiles at like load steps. p95 and p99 at 500 requests per second against p95 and p99 at 500 requests per second, reported in milliseconds, plus throughput at the sustainable point. A movement in the global average tells a reviewer almost nothing.
-
Repeat before you call a regression. Cache warmth, scheduling and garbage collection produce spread between identical runs. A p95 change smaller than that spread is noise, and calling it a regression costs a team a week of investigation.
-
Put a range beside every delta. State the interval observed across repeated runs rather than a single percentage, so the reviewer can see how much of the change is signal.
-
Flag every environment change. A new instance size, a database version bump or a relocated load generator can explain a difference the code didn’t cause.
-
Record both identities. Baseline version, current build identifier and script commit, so each number traces back to a run someone can find again.
A comparison that survives those checks gives the release review a sentence it can act on: this build is slower by a stated amount on this journey, beyond the run-to-run noise, and here is the evidence. That is a very different claim from “performance looks fine”.
Diagnosing Common Symptoms and Their Causes
Most reports have a shape before they have a cause. Latency that holds flat for three load steps and then climbs steeply means something ran out. Errors that appear at exactly one step mean a limit was crossed. A p99 that spikes while the median stays calm means a subset of requests is waiting on something periodic.
| Symptom | Likely cause | Next check |
|---|---|---|
| Latency flat, then climbs sharply past one step | Saturated CPU, connection pool or database | Saturation metric at the same timestamp |
| Mean looks healthy, p99 spikes | Slow tail from GC pauses, lock waits or retries | p99 broken down by endpoint |
| Throughput plateaus as concurrency rises | Queueing at a shared resource | Little’s Law check of concurrency, throughput and response time |
| Error rate jumps at one step | Connection limits, timeouts or exhausted threads | Error classes and timeout settings |
| Identical runs disagree | Uncontrolled cache state or noisy neighbours | Repeat runs and warm-up length |
| Latency drifts upward across a soak test | Memory or handle leak | Memory and handle counts over time |
Reading the table in the wrong order is the usual mistake. Teams see a symptom, reach for the most familiar cause and start optimising code. The check column exists because the first plausible cause is often the wrong one. Rising latency near saturation is queueing far more often than it is a slow function, and a throughput plateau under climbing concurrency is a resource-contention story rather than an algorithmic one.
Confirm before you fix
For each row, find one metric that moved at the same timestamp as the symptom, on the same timeline. CPU at 98 percent while p95 climbs is confirmation. CPU that was “probably high” is not. If the confirming check comes back clean, the cause is somewhere else, and the report should say the cause is unknown rather than name a plausible one and send a developer chasing it.
Correlation versus evidence: CPU rising alongside latency is a correlation. A trace showing thirty milliseconds spent waiting for a database connection is evidence. Only the second belongs in a recommendation.
Two rows deserve extra suspicion. Identical runs that disagree, and latency that climbs through a soak test, both point at things a peak test can’t see: uncontrolled cache state, noisy neighbours on shared hardware, and slow accumulation of memory or file handles. Plot soak results over time rather than summarising them, or the drift vanishes into an average that never breaches a threshold.
Linking Load Results to Real User Impact
A latency figure persuades engineers. It doesn’t move a release committee until someone translates it into a user outcome, and the translation is more concrete than it sounds.

A Google–Deloitte study analysed more than 30 million sessions across 37 brand websites and examined a natural 100-millisecond improvement in mobile site speed. Retail conversion rates rose 8.4%, retail average order value rose 9.2%, travel websites recorded a 10.1% increase in conversions, and lead-generation websites saw form submissions increase by as much as 21.6% in some analyses, according to the milliseconds-to-millions research. A tenth of a second is the kind of change teams dismiss as noise. Multiplied across millions of sessions, it isn’t.
Attach an outcome to every critical journey
Pick the journeys the business already measures: checkout completion, searches per user, form submissions, sign-in success. Report percentile latency by journey, by region and by device class, because an aggregate can look acceptable while one region or one older device class fails severely. A single global p95 is the most efficient way to hide the users who are suffering.
Then estimate the affected population rather than describing it. Multiply the share of requests breaching that journey’s threshold by the daily sessions on the path, and the report produces a number of people instead of a percentage. Add the error-budget impact beside it, so the reader sees how much reliability margin this result has consumed.
What a replay can and cannot prove
Production-derived traffic is the most realistic input available: real request sizes, real endpoint mix, real session dependencies. That realism has a boundary. A replay that completes successfully proves the target returned responses, not that the responses were correct, which is why our third workflow step measures performance and compares responses and application state alongside it.
Observability guidance on pairing synthetic monitoring with front-end observability makes the same point from the opposite direction. Scripted tests cover only the journeys someone anticipated, and real-user telemetry is what surfaces the unanticipated paths, the device and network differences, and the regional edge cases. A load testing report predicts impact. It doesn’t observe it, and the document should say which parts of the estate sit outside the test.
Confirm the Go or No-Go Decision Before Release
Write the decision as one sentence with its limits attached: go for up to 500 requests per second at p95 under 500 ms. Everything else in the report either supports that sentence or contradicts it. A decision without a load attached isn’t a decision, it’s a mood.
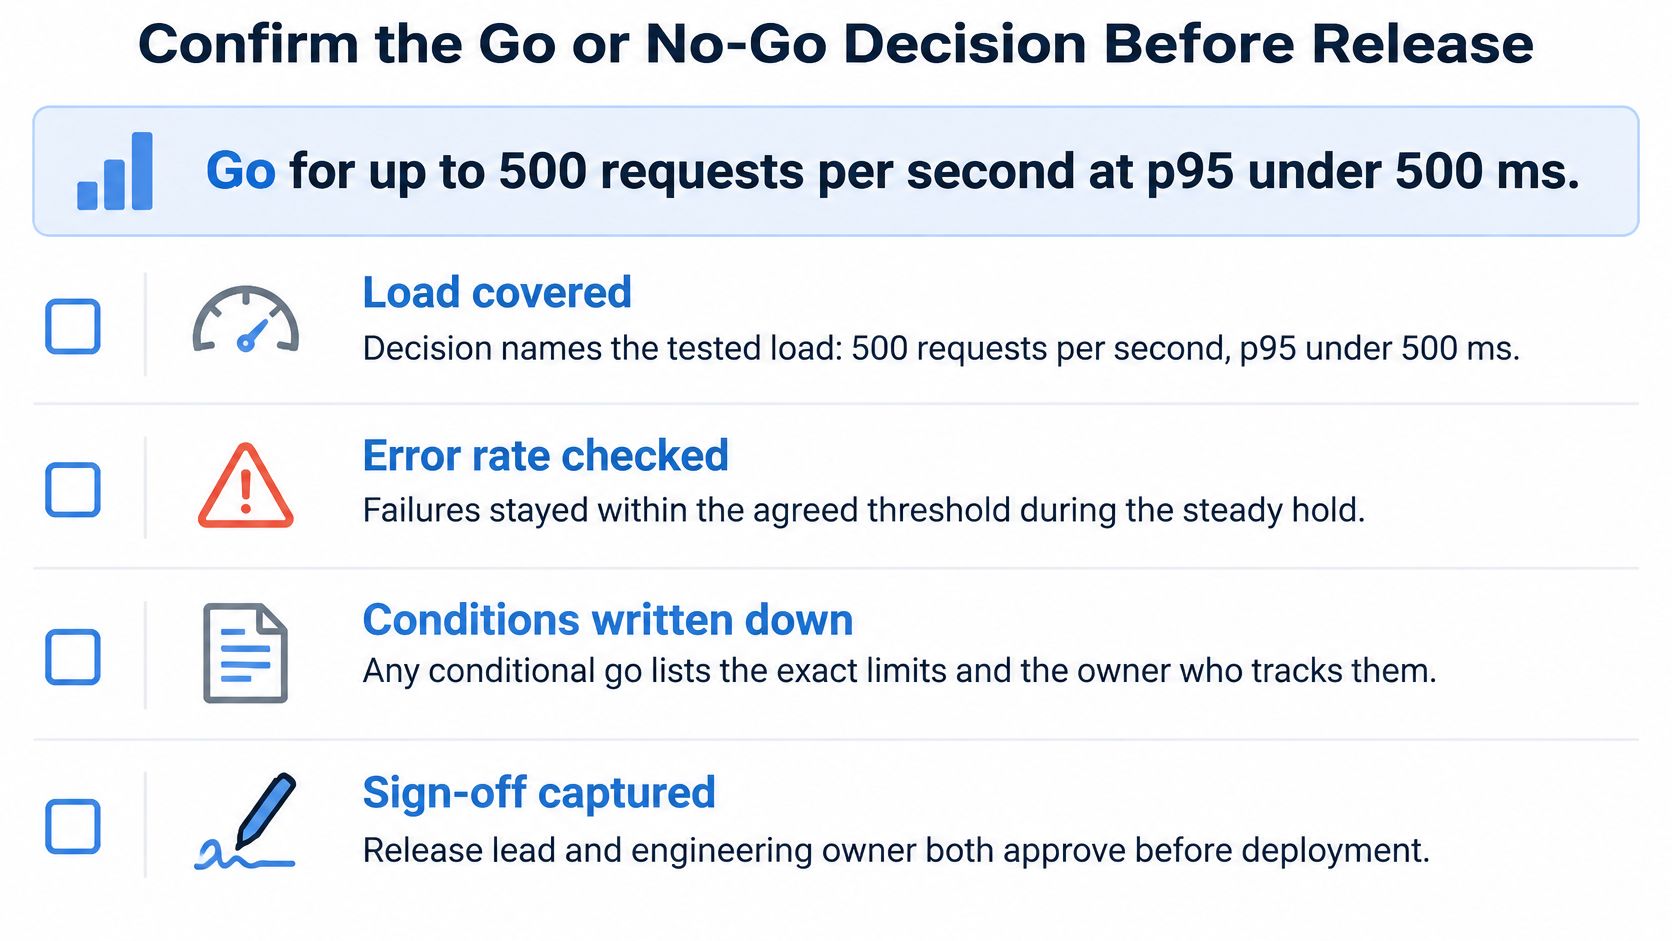
Run this checklist before the release review, and put it in the pack so the reviewer confirms each line in one pass.
-
Every threshold held in the steady-state window. Ramp numbers are context, not verdicts.
-
The environment matched production, or the gap is documented in the same paragraph as the result it affects.
-
The workload was masked and versioned, with the dataset version named and its refresh date stated.
-
The comparison carries confidence limits, so the reviewer can tell a regression from run-to-run noise.
-
The saturation point is in the report, not just the passing load, because headroom is what the next planning cycle buys against.
Then write the follow-up actions with owners and dates. Retest after the fix, extend the tested load to the breaking point, add a soak run for the component that showed drift. An action without an owner is a hope with a deadline attached.
Replaying a captured HTTP workload at a chosen speed against a test environment measures latency, errors and resource limits, which is what our load testing feature does. Those three outputs are the raw material of this decision, not the decision itself. The go or no-go is an interpretation, and it belongs to a named person who read the sections in order.
Draft the report with those sections in that order, send the checklist alongside it, and state the decision in the first paragraph. A reviewer who can verify every line without opening a dashboard is a reviewer who can say go.
GoReplay records live HTTP traffic and replays it against an isolated test service at the speed you choose, so the workload behind your load testing report comes from production rather than from a script guessing at what users do. You can capture, filter, mask and replay, then measure latency, errors and resource limits on the target and compare the results against your previous build. Start with GoReplay and put your next capacity decision on evidence someone else can reproduce.