A Practical Guide to Load Testing on Website Performance

Let’s be honest: your synthetic user scripts act nothing like real people. That’s the dirty little secret of traditional load testing and why it so often fails to predict real-world performance meltdowns. Firing off a bunch of simple GET requests just can’t replicate the chaos of a genuine traffic spike, leaving your website exposed when it matters most.
Why Traditional Website Load Testing Misses The Mark

So many engineering teams still lean on synthetic load testing. The approach is simple: write scripts that simulate user actions, like repeatedly hitting a homepage or adding an item to a cart. It’s a decent first step and can catch the most glaring problems, but it’s built on a fundamental flaw: scripted users are predictable, but real users are anything but.
This disconnect becomes a critical point of failure during high-stakes events. Picture an e-commerce site launching a flash sale. Real people don’t follow a neat, linear script. They hammer the refresh button, abandon carts midway, try to stack invalid discount codes, and open a dozen tabs at once. This whirlwind of activity creates a complex and volatile mix of API calls and database queries. A simple script endlessly hitting GET /product/sale-item will never come close to replicating that behavior.
The True Cost of Unrealistic Testing
Historically, load testing was often an afterthought—something you only prioritized after a catastrophic failure. The initial launch of Healthcare.gov famously crashed after being built for 50,000 concurrent users but getting hit with 250,000 users all at once. In retail, Black Friday outages have cost major brands tens of millions in a single day.
The financial fallout is staggering. Studies show that slow-loading websites cost businesses an estimated $2.6 billion in lost sales every single year. You can dig deeper into the impact of performance on revenue for more insights.
The core problem is that synthetic tests check for expected load, not actual chaos. They can confirm your server handles 1,000 simultaneous logins, but they can’t tell you what happens when 500 of those users immediately try to apply a coupon that triggers a slow database lookup.
Bridging the Gap with Traffic Replay
This is exactly where traffic replay changes the game. Instead of guessing how users might behave, you capture the traffic they actually generate in production. Tools like GoReplay let you record this real-world request stream and then unleash it against a staging environment.
This method gives you a far more authentic approach to load testing on a website because it brings the real world into your test environment.
- Complex User Journeys: It captures every step of a real user’s session, including all the unexpected detours and frantic clicks.
- Unpredictable Traffic Patterns: It preserves the natural spikes and lulls of activity, truly testing your system’s ability to scale up and down.
- Real-World Data Payloads: It uses the actual data and headers sent by user browsers, which is brilliant for uncovering edge cases that synthetic data would never find.
By replaying what has already happened, you test your systems against the messy, unpredictable reality of human behavior. It’s a proactive strategy that helps you find and fix the bottlenecks before they cause a production outage, ensuring your website stays solid, even under the most intense pressure.
Preparing Your Environment for Realistic Traffic Replay
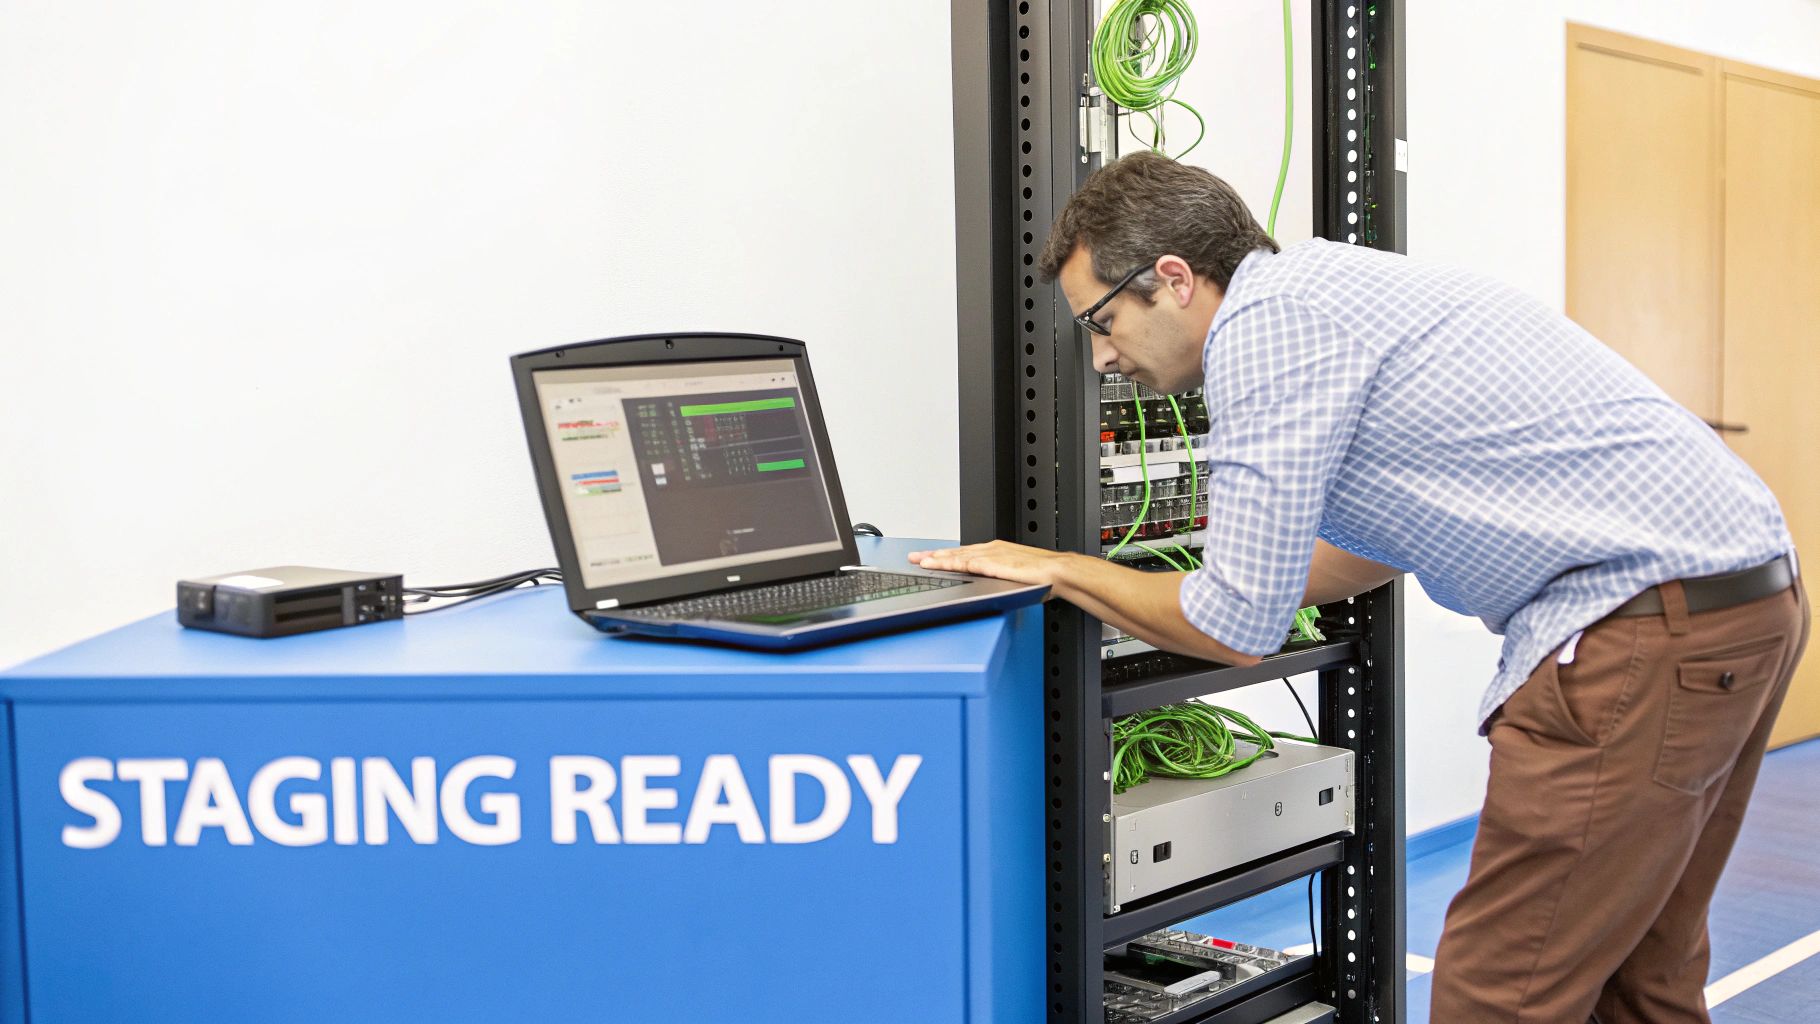
Before you can get any meaningful results from traffic replay, your test setup needs to be a solid replica of your production environment. A half-baked staging server running on a developer’s laptop just won’t cut it. The real goal here is to carve out a controlled, isolated space where you can safely unleash real user traffic without putting your live website at risk.
The first, and most critical, step is getting a staging environment that mirrors production as closely as possible. This means using the same hardware specs, network configurations, database schemas, and application versions. Any significant difference introduces a variable that can completely skew your test results, sending you down rabbit holes chasing phantom performance issues.
To get the most out of your load tests, it’s essential your website is built on a high-performing, scalable foundation. Investing in modern data center infrastructure solutions can make a huge difference in the realism of your testing environment, ensuring your results truly reflect application performance, not just hardware limitations.
Capturing Traffic Without Hurting Performance
With your staging environment ready to go, it’s time to capture live traffic. This is where GoReplay’s listener comes into play. The listener is a tiny, lightweight process you install on a production server or network tap to passively record incoming HTTP requests.
The key word here is passivity. It sniffs traffic without blocking or modifying anything, which guarantees zero performance impact on your live application.
The most common fear is that capturing traffic will slow down the production website. GoReplay is engineered to avoid this. It operates at the network layer, listening to a copy of the traffic rather than sitting in the request path. Think of it as a journalist taking notes from the sidelines, not a security guard checking IDs at the door.
You have a few ways to deploy the listener, each with its own trade-offs. Your choice will ultimately depend on your architecture and security policies. For instance, installing it directly on an application server is straightforward, but using a network tap offers complete isolation.
GoReplay Listener Configuration Options
Deciding how to capture traffic is a strategic choice. The method you select will influence the complexity of your setup and the resources required.
Here’s a quick rundown of the most common approaches to help you decide which one fits your needs best.
| Capture Method | Best For | Pros | Cons |
|---|---|---|---|
| Direct Server Installation | Simpler setups and single-server applications. | Easy and quick to deploy; requires minimal network configuration changes. | Shares server resources with the application; may not be suitable for extremely high-traffic servers. |
| Load Balancer Installation | Environments where all traffic passes through a central load balancer. | Captures traffic for an entire cluster from a single point. | Requires access to the load balancer; adds a dependency on that component. |
| Network Tap or Port Mirroring | High-traffic, mission-critical enterprise environments. | Zero performance impact on production servers as it runs on separate hardware. | More complex to set up; requires network hardware and configuration changes. |
Each method gets the job done, but tapping the network offers the purest, most isolated way to capture traffic in demanding environments.
Configuring the Daemon and Storage
Once you’ve installed the listener, you need to configure the GoReplay daemon. This is where you tell it which network interface to listen on and where to send the captured traffic. For quick, one-off tests, you can just save the traffic to a local file on the production server.
But for continuous load testing on a website, you’ll want a more scalable solution. You can configure GoReplay to forward traffic in real-time to a central storage location or even directly to your staging environment. This is typically done over a secure connection, like an SSH tunnel or VPN, to protect the data while it’s in transit.
Here are the key configuration steps:
- Select the Network Interface: Pinpoint the network interface that handles your website’s public traffic (e.g.,
eth0). - Define the Output: Specify where the captured traffic should go. This could be a local file (
--output-file requests.gor) or a TCP endpoint (--output-tcp staging-server:port). - Establish Secure Connectivity: If you’re sending traffic over the network, make sure the connection between production and staging is encrypted and secure to prevent any data exposure.
Getting this foundation right is non-negotiable. A well-prepared environment ensures that when you replay traffic, the performance bottlenecks you find are genuine issues in your application—not just artifacts from a poorly configured test setup. This upfront work pays off big time by giving you clear, actionable insights that directly improve your site’s stability and speed.
How to Safely Capture and Sanitize Production Traffic
Okay, with your environment ready to go, it’s time to handle the most critical part of this whole process: your production traffic. Capturing real user data is the key to realistic load testing, but it’s a huge responsibility. You absolutely cannot rush this step. Getting it wrong means compliance headaches or, worse, a data breach.
The game plan is simple: capture everything, but only replay what’s safe and relevant. Just blindly dumping raw production traffic into a staging environment is a security incident waiting to happen. You’re talking about real passwords, API keys, session tokens, and all sorts of Personally Identifiable Information (PII) like names and emails. This data has to be sanitized before it ever leaves your production network or hits a log file.
Real-Time Data Masking with Middleware
This is where GoReplay’s middleware really shines. Instead of the old, risky method of recording raw data and trying to clean it up later, you can sanitize traffic in real-time, as it’s being captured. Middleware scripts jump in and intercept requests on the fly, letting you modify headers, body parameters, or URLs before they’re ever saved.
Think about a login request. In its raw form, it might contain a user’s password right there in the request body. With a simple middleware script, you can intercept this request and swap the real password with a generic placeholder like "password": "test-password-123" or hash it on the spot. All of this happens before the request is even written to your capture file.
This real-time transformation is a game-changer for security. It means sensitive PII and credentials never even touch your testing environment. By neutralizing the data at the source, your test dataset is secure by design, keeping you in line with regulations like GDPR and CCPA.
And it’s incredibly flexible. You can write custom middleware to handle any kind of data transformation you can think of. For a deeper dive into more advanced strategies, check out our guide on masking production data for testing.
Filtering Out the Noise for Cleaner Tests
Let’s be honest, not all traffic is useful. Your production servers are constantly getting hit with requests that have zero value for load testing. I’m talking about health checks from your load balancer, monitoring pings from tools like Prometheus, or requests for static assets like CSS files and images. Replaying all of that just creates unnecessary load and skews your test results.
An effective load test needs a clean, focused dataset. You have to filter out all that background noise to make sure your test is actually simulating genuine user behavior. GoReplay gives you powerful filtering tools to do just that.
Here are a few common things you’ll definitely want to filter out:
- Monitoring Endpoints: Any requests hitting paths like
/healthor/statusshould be dropped. They’re just automated systems checking in. - Static Assets: Filter out requests for files ending in
.css,.js,.jpg, or.png. These are usually handled by a CDN and don’t tax your application logic anyway. - Specific IP Ranges: It’s a good idea to block traffic coming from your office IPs so you aren’t load testing with your own team’s activity.
- Third-Party Webhooks: If your app gets data from external services, you probably want to exclude those incoming requests to focus purely on user-driven traffic.
By combining real-time masking with smart filtering, you turn that raw, messy production firehose into a clean, secure, and highly relevant dataset. This sanitized file is the perfect fuel for a load test that’s not only realistic but also respects user privacy and meets your security standards. This careful prep work is what separates a reckless test from a professional and insightful one.
Running Your First Session-Aware Load Test
Alright, you’ve done the prep work. Your traffic files are sanitized and filtered, and now it’s time for the payoff: running a load test that actually mirrors how real people use your application. This is where we leave simplistic, repetitive scripts behind and start simulating genuine user behavior at scale.
The best way to start is with a direct one-to-one replay. Think of it as your baseline—a reality check to see how your staging environment handles a load identical to what production saw during the capture period. Before you crank up the volume, you need to know how it performs under normal conditions.
Adjusting Replay Speed to Simulate Growth
Of course, the real magic happens when you simulate scenarios that haven’t even occurred yet. What if that big marketing campaign really takes off? What happens during a sudden traffic spike? This is where amplifying the load comes in.
With a simple command-line flag, you can replay your captured traffic at 2x, 5x, or even 10x the original speed. This controlled amplification is perfect for stress testing. It helps you find the breaking point of your infrastructure and uncovers those nasty bottlenecks that only rear their heads under serious pressure. It’s how you prepare for success before it happens.
The process of getting your traffic ready for this kind of rigorous testing is pretty straightforward.
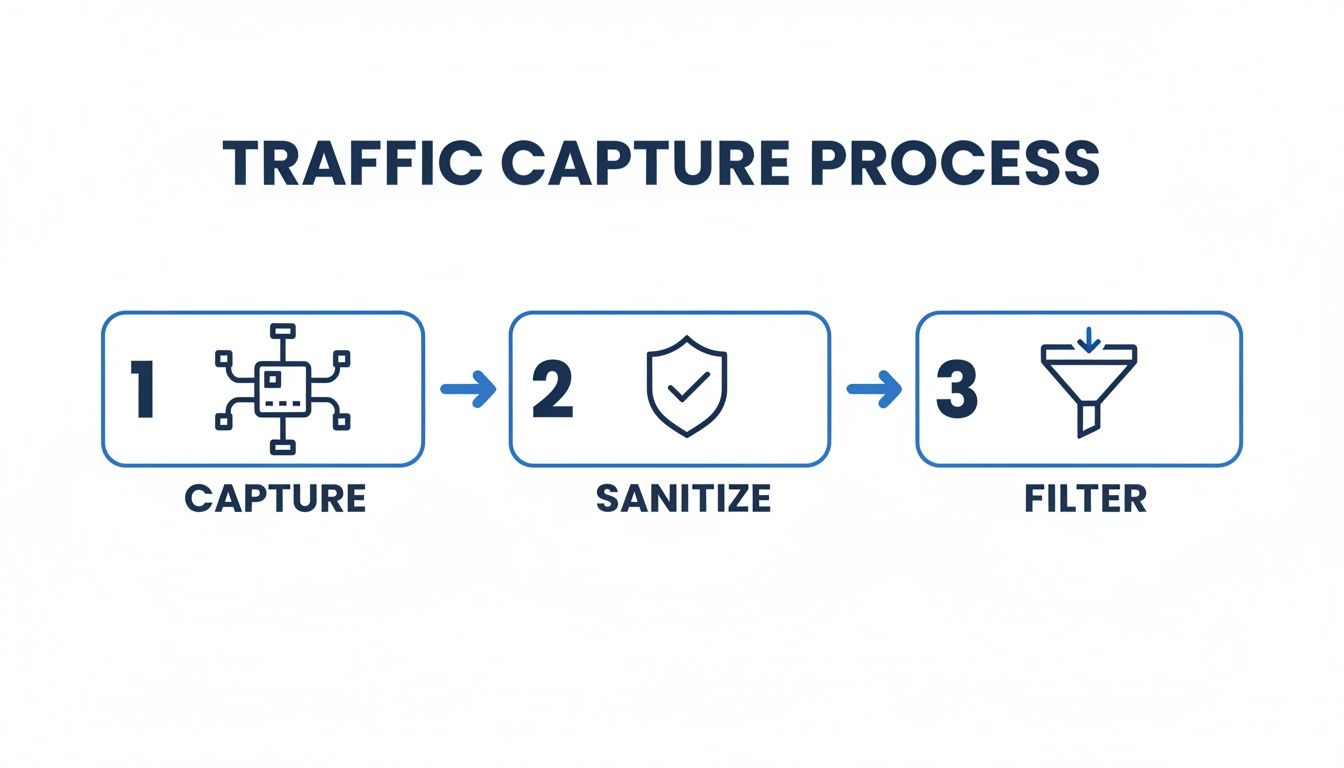
This three-step workflow ensures the traffic you’re replaying is clean, safe, and focused on real user activity.
Maintaining User Sessions for True Realism
Here’s the secret sauce that makes GoReplay’s approach so powerful: it’s session-aware. This is a huge deal. It’s not just blindly firing off a sequence of isolated HTTP requests. It understands and preserves the entire context of a user’s journey.
For instance, if a user logs in, browses a few products, adds one to their cart, and then heads to checkout, GoReplay replays that entire sequence as a single, coherent session. This is absolutely critical for accurately testing stateful features like shopping carts, user dashboards, or any multi-step form. Without session awareness, you’re just throwing random hits at your server, not simulating how people actually interact with your site. You can read more about why this is so important for accurate sessions in performance testing.
This ability to maintain session integrity is non-negotiable for modern web applications. It ensures your tests are validating complex user flows, not just the performance of individual endpoints. You get to see how backend services, databases, and caches interact under the strain of thousands of concurrent, stateful user journeys.
A Practical Command Line Example
So, let’s get our hands dirty. Running a replay against your staging server is surprisingly simple. Here’s a typical command you might use to replay a captured file named production.gor against a staging server, crank the traffic up by a factor of ten, and set a request timeout.
gor —input-file “production.gor” —output-http “https://staging.yourwebsite.com” —rate 1000% —http-timeout 5s
Let’s quickly break that down:
--input-file "production.gor": This points to the sanitized traffic file you already created.--output-http "https://staging.yourwebsite.com": This is your target. All the replayed traffic goes here.--rate 1000%: Here’s the multiplier. We’re telling it to replay at 10x the original speed.--http-timeout 5s: This sets a 5-second timeout, which is great for flagging slow responses.
This command is a fantastic starting point. As your testing gets more ambitious, you can easily scale the whole operation by running GoReplay instances on multiple machines, all pointing to the same target environment. This distributed approach lets you simulate massive traffic volumes that would choke a single replay machine, giving you a clear path to test for almost any level of scale.
Analyzing Results to Find Performance Bottlenecks
Running the test is really just the beginning. The real payoff from any load testing on website effort comes when you dig into the results, transforming a mountain of raw data into a handful of actionable insights. Without this step, you’re just making noise. The magic happens when you connect the dots between the test output and how your application actually behaves under pressure.
Your first stop should always be the high-level, user-facing metrics. These are the numbers that tell you what your customers are experiencing and whether you have a fire that needs putting out right now.
Starting with User-Facing Metrics
The two most critical data points to check first are response times and error rates. Response time, especially when measured in percentiles like p95 or p99, shows you how long your server takes to handle requests for the overwhelming majority of your users. A sudden jump in the p99 response time for a critical endpoint, like /api/checkout, is a massive red flag.
Likewise, a rising error rate is a clear sign your system is struggling. Are you seeing more HTTP 500 server errors or 503 service unavailable responses as the load climbs? Those errors mean your application isn’t just slowing down—it’s actively failing for a portion of your users.
These metrics aren’t just academic. Modern users have zero patience for slow sites. Research consistently shows that 53% of mobile visitors will ditch a website if it takes longer than three seconds to load. Even worse, as page load time goes from just one to three seconds, the probability of a user bouncing shoots up by 32%.
Correlating with Server-Side Metrics
Once you’ve spotted a problem on the user-facing side, it’s time to put on your detective hat and dive into server-side metrics. This is where tools like Prometheus for data collection and Grafana for visualization become your best friends. They let you overlay your application’s performance data with your infrastructure’s health metrics, which is how you uncover the why behind the slowdown.
A key takeaway here is to never analyze metrics in a vacuum. A spike in latency is just a symptom, not the diagnosis. You have to correlate it with what was happening on your servers at that exact moment to find the root cause.
Let’s walk through a classic scenario. Your load test is running, and you see in Grafana that the response time for your /api/products/search endpoint skyrockets from 200ms to over 2,000ms once the test hits 500 concurrent users. Okay, you have a problem. But what is the problem?
Now, you overlay the server-side metrics from that same time window.
- CPU Usage: You immediately notice the CPU on your database server is pinned at 100%.
- Memory Usage: Your application server’s memory, however, looks perfectly stable.
- I/O Wait: Disk I/O on that same database server is also through the roof.
Suddenly, the picture is crystal clear. The latency isn’t coming from your application code; it’s a database bottleneck. That search endpoint is almost certainly running an inefficient query that’s eating all the CPU resources under load, causing requests to pile up and time out.
From Diagnosis to Action
This process of correlation is the very heart of effective performance analysis. It takes you from a vague complaint like “the site is slow” to a specific, actionable finding: “The product search is slow because of an unindexed database query that maxes out the CPU.” That’s something your development team can actually fix.
Here’s another quick example:
- Symptom: A sharp increase in HTTP 500 errors during a load spike.
- Correlation: You check your application server logs and see a flood of “Out of Memory” exceptions.
- Diagnosis: This points directly to a memory leak in your application. Under normal load, the garbage collector might be keeping up, but the intense pressure of the test reveals the flaw, causing the application to run out of memory and crash.
Uncovering these issues is the whole point of load testing. Once you’ve pinpointed the bottlenecks, the next step is to optimize website performance by addressing the root cause. By methodically moving from user-facing symptoms to server-side causes, you can systematically hunt down and fix the performance gremlins that would otherwise take your site down during a real traffic event. This cycle of testing, analyzing, and fixing is what builds a truly resilient and scalable website.
Common Questions About Load Testing with Traffic Replay
Even with the best plan, you’re going to have questions. It’s just part of the process. Here are some of the most common ones we hear from teams who are just getting started with traffic replay.
Will GoReplay Slow Down My Production Site?
This is usually the first question everyone asks, and for good reason. The last thing you want is for your testing tool to take down the very site you’re trying to protect.
The short answer is no. GoReplay is engineered to be incredibly lightweight. It works by passively sniffing network packets, meaning it observes traffic without ever getting in the way or blocking the actual request-response flow. It consumes very little CPU and memory.
For sites with massive traffic, the best practice is to run GoReplay on a dedicated machine. By using a network tap or port mirroring, you can feed a copy of the traffic to the capture process. This setup completely isolates it from your production servers.
This approach guarantees zero performance overhead on your live system. It’s like watching a recording of the game from the sidelines instead of trying to play and commentate at the same time.
Can I Test for More Traffic Than I Have Now?
Absolutely. This is where traffic replay really shines. The traffic you capture is your baseline—a perfect, real-world snapshot of your current load. But it’s just the starting point.
GoReplay gives you simple flags to amplify that traffic. You can replay it at 2x, 10x, or even 100x the original speed.
This is a game-changer for a few reasons:
- Future-Proofing: See how your system will handle next year’s projected growth.
- Campaign Readiness: Simulate that huge traffic spike you’re hoping for from your next big marketing launch.
- Stress Testing: Find the actual breaking point of your application by pushing it to its absolute limit.
It lets you prepare your infrastructure for success before it arrives.
How Do I Handle Logins and User Sessions?
This is a critical piece of the puzzle for any modern app. You can’t just replay production authentication tokens into a staging environment—it’s a security nightmare, and they probably won’t work anyway.
The key is that GoReplay is session-aware; it understands a user’s entire journey. The right way to handle authentication is to use middleware to swap out tokens on the fly during the replay.
You can write a simple script that intercepts each request, finds the production Authorization header, and replaces its value with a valid token for your test environment. This way, you can test complex, stateful user flows (like a multi-step checkout) realistically without ever touching real user credentials. It keeps your testing secure and accurate.
What’s the Difference Between GoReplay Open-Source and Pro?
The open-source version of GoReplay is incredibly powerful. It gives you the core tools to capture and replay traffic, which is everything many teams and developers need to build a solid load testing on website strategy.
The Pro version is built for teams working at a larger scale, often in enterprise environments where collaboration, deeper analytics, and cloud integration are essential.
Here’s a quick breakdown:
| Feature | Open-Source Version | Pro Version |
|---|---|---|
| Core Replay Engine | ✓ | ✓ |
| Basic Traffic Filtering | ✓ | ✓ |
| Centralized Dashboard | - | ✓ |
| Cloud Storage (S3, GCS) | - | ✓ |
| Advanced Data Masking | - | ✓ |
| Priority Support | - | ✓ |
Think of it this way: Pro is for teams who need to seamlessly integrate performance testing into their CI/CD pipelines with better tooling for collaboration, data management, and security.
Ready to stop guessing what your users are doing? With GoReplay, you can use real production traffic to find and fix critical bottlenecks before they ever impact a customer.
Discover how traffic replay can bring a new level of realism and reliability to your testing. Learn more at https://goreplay.org.