A Complete Guide to Kubernetes Health Check Probes

A Kubernetes health check is basically an automated diagnostic that keeps an eye on your containerized application to see if it’s running correctly. Think of it as a vital pulse check, giving Kubernetes the power to automatically detect, restart, or even isolate unhealthy applications. It’s the key to building a reliable, high-availability system.
Why Kubernetes Health Checks Are Non-Negotiable
Ever had a silent application failure? Your users are getting swamped with error pages, support tickets are flooding in, but your Kubernetes dashboard is all green. It’s a developer’s worst nightmare, and it’s exactly what a proper Kubernetes health check is designed to stop.
Without health checks, your cluster is essentially flying blind. It has no way to tell a healthy, functioning application from one that’s secretly failing.
A good way to visualize it is to imagine Kubernetes as an automated monitoring system in a hospital. Health checks are the probes you attach to each patient (your application). They’re constantly asking two fundamental questions:
- “Are you alive and well?” This is the liveness check. It makes sure the application hasn’t crashed, frozen, or gotten stuck in a deadlocked state.
- “Are you ready for new patients?” This is the readiness check. It confirms the application is fully booted and prepared to start accepting incoming traffic.
This continuous monitoring is what fuels the powerful self-healing capabilities Kubernetes is famous for. If an app stops responding to its “pulse check,” Kubernetes can step in and automatically restart it, often fixing the problem before anyone even notices. And if it’s not ready for traffic, Kubernetes is smart enough to route requests to other healthy instances until it’s back on its feet.
The Alarming Reality of Health Check Adoption
You’d think something this critical would be universally adopted, but the reality is surprisingly different. A recent study uncovered a pretty concerning trend: a staggering 83% of organizations weren’t setting liveness or readiness probes for more than 10% of their workloads.
That’s a huge drop from the previous year’s 65%, which suggests that as deployments get bigger and more complex, these essential safety nets are getting left behind. You can dig into more of these Kubernetes reliability missteps in the full report.
Without proper health checks, Kubernetes loses its most powerful feature: the ability to automatically maintain application health. It’s the difference between a resilient, self-healing system and a fragile one that requires constant manual intervention during an outage.
This guide will walk you through everything you need to know, from the basic concepts to advanced strategies, to make sure your applications are truly robust and resilient.
Decoding the Three Types of Kubernetes Probes
To keep your applications running smoothly, Kubernetes uses three different kinds of health checks, or probes. Each one has a very specific job. Think of them as a team of specialists keeping an eye on your app, each asking a different question to make sure everything is okay. Getting these probes right is the first step toward building a truly self-healing system.
This flow shows how Kubernetes uses these health checks as the core of its automated, self-healing power, making sure your pods stay healthy and ready for action.
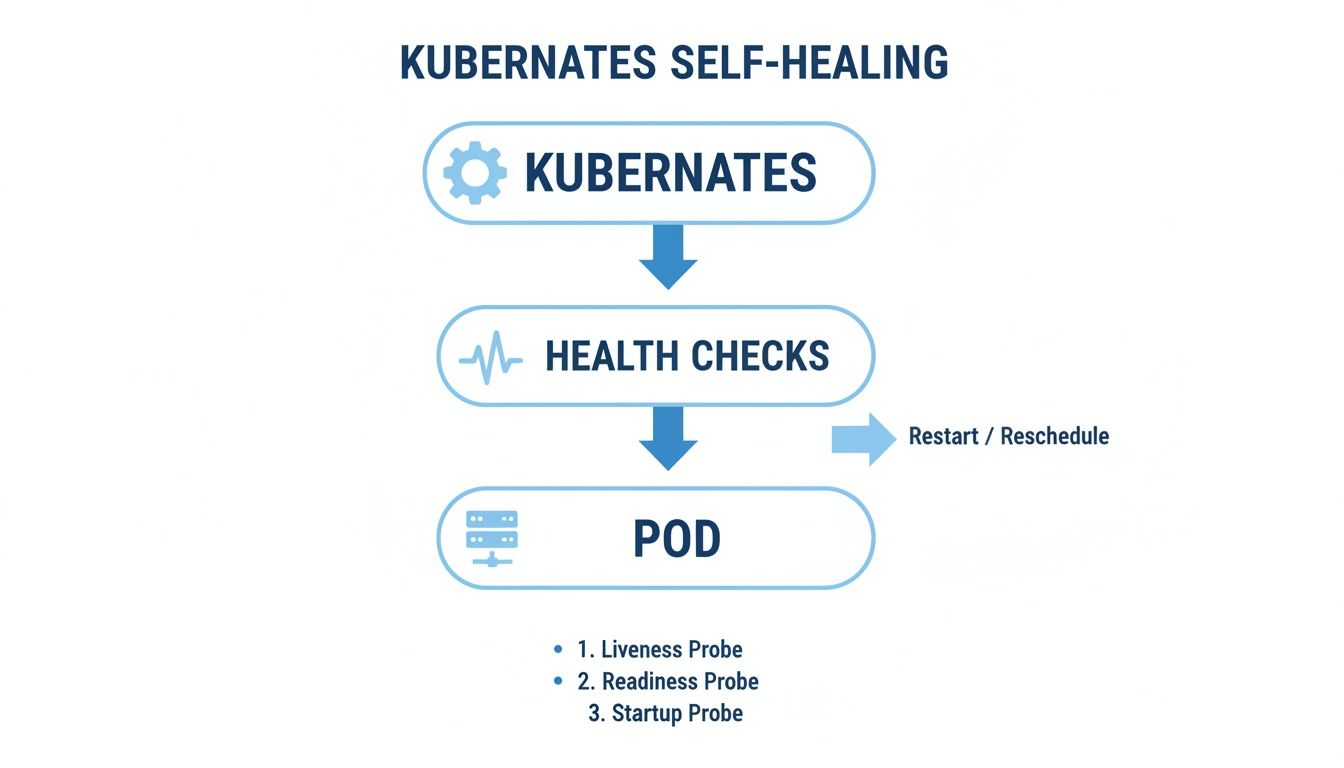
As you can see, the probes are the critical link between the Kubernetes control plane and your individual pods, triggering the recovery actions that keep your services online.
Liveness Probes: The Heartbeat Monitor
A liveness probe answers one simple question: “Is the application still running?” It’s basically a heartbeat monitor for your container. If your app gets stuck in a deadlock or just becomes completely unresponsive, the liveness probe will fail.
When that happens, the kubelet—the little agent running on each node—assumes the container is dead. Its reaction is swift and decisive: it kills the container and restarts it based on the pod’s restartPolicy. This is all about recovering from totally broken states without anyone having to lift a finger.
A liveness probe is your final line of defense against a frozen application. Its job is to restart a container that’s technically running but fundamentally broken, forcing it back to a healthy state.
Readiness Probes: The “Open for Business” Sign
While a liveness probe checks if an app is alive, a readiness probe asks a totally different question: “Are you actually ready to handle traffic?” Think of it as the “Open for Business” sign in a shop window. Just because the lights are on doesn’t mean they’re ready for customers.
An app might need a few moments to load its configuration, warm up a cache, or establish a database connection. During that time, it’s alive but not prepared to serve requests. If a readiness probe fails, Kubernetes knows not to send it any traffic. It temporarily removes the pod from the service endpoint until the probe starts passing again, making sure users only ever hit instances that are 100% ready.
Startup Probes: The Pre-Flight Check
Finally, we have the startup probe. This one was designed to solve a very specific problem: applications that take a long, unpredictable time to start up. For some complex apps, the initial liveness or readiness checks might fail just because the application hasn’t finished its boot-up sequence, triggering pointless restarts.
A startup probe acts like a pre-flight check, giving the container a generous window to get off the ground. It effectively disables the liveness and readiness probes until it succeeds for the first time. If the startup probe itself fails after its configured time, then Kubernetes knows something is wrong and restarts the container. This simple mechanism protects those slow-starting apps from being killed before they’ve even had a chance to get going.
To make it even clearer, here’s a quick breakdown of how each probe functions and when to use it.
Comparing Liveness, Readiness, and Startup Probes
| Probe Type | Purpose | Action on Failure | Common Use Case |
|---|---|---|---|
| Liveness | Is the application running and responsive? | Kubelet restarts the container. | Detecting deadlocks or frozen processes that require a hard restart to recover. |
| Readiness | Is the application ready to accept new traffic? | Kubelet removes the pod from service endpoints. | Preventing traffic from hitting a pod that is still initializing or temporarily overloaded. |
| Startup | Has the application finished its initial startup? | Kubelet restarts the container. | Protecting slow-starting applications from being killed by liveness probes during boot-up. |
This table provides a simple guide to choosing the right tool for the job. By combining these probes, you can build a robust health-checking strategy that gives Kubernetes the information it needs to manage your application’s lifecycle automatically.
Alright, let’s get into the how of Kubernetes health checks. Knowing the theory is great, but the real power comes from seeing how to put these probes into practice. Kubernetes gives you three distinct ways to check on your application’s health, and each one is a different tool for a different job.
Choosing the right probe type comes down to what your application actually does. A web server’s “healthy” signal looks very different from a database’s or a background processing job’s. Let’s dig into each method, complete with some practical, annotated YAML to see them in action.

HTTP Probes for Web Services
The most common and straightforward probe is the HTTP GET probe. It’s built for any application that speaks HTTP—think REST APIs, websites, or any kind of microservice. The concept is simple: the kubelet sends an HTTP GET request to a specific path and port inside your container.
If the response comes back with a status code in the 200-399 range, Kubernetes considers it a success. Anything else is a failure. This makes it perfect for a dedicated health endpoint like /healthz or /status that returns a 200 OK when everything is running smoothly.
Here’s what a liveness probe using an HTTP check looks like in YAML:
apiVersion: v1 kind: Pod metadata: name: http-probe-example spec: containers:
- name: my-web-app image: my-web-app:1.0 livenessProbe: httpGet: path: /healthz # The endpoint to check. port: 8080 # The port the application listens on. initialDelaySeconds: 15 # Wait 15s before the first probe. periodSeconds: 10 # Check every 10 seconds. failureThreshold: 3 # Restart after 3 consecutive failures.
With this setup, Kubernetes waits 15 seconds after the container spins up, then starts hitting the /healthz endpoint on port 8080 every 10 seconds. If three of those checks fail in a row, it’s curtains for that container—it gets restarted.
TCP Probes for Any Network Service
But what if your application doesn’t serve web traffic? For services like databases, message queues, or other custom network daemons, the TCP Socket probe is your go-to. It’s much simpler and more direct than an HTTP probe.
All the kubelet does is try to open a TCP connection (a socket) to a port you specify. If the connection is established, the probe succeeds. If it’s refused, the probe fails. It doesn’t send any data or care about the protocol; it just wants to know if something is listening on that port.
A TCP probe is the universal “are you there?” check for any service listening on a port. It simply confirms the application’s network socket is open for business, regardless of what protocol it’s speaking.
Take a look at this readiness probe for a database container:
apiVersion: v1 kind: Pod metadata: name: tcp-probe-example spec: containers:
- name: my-database image: my-database:latest readinessProbe: tcpSocket: port: 5432 # The standard port for this database. initialDelaySeconds: 20 # Give the database time to initialize. periodSeconds: 15 # Check every 15 seconds.
This probe is a gatekeeper. It prevents any traffic from being routed to the pod until the database has fully initialized and started listening on port 5432.
Exec Probes for Custom Logic
When HTTP and TCP probes just don’t cut it, you have the Exec probe. This is the most flexible option by far, letting you run any command you want directly inside the container. Success or failure hinges on the command’s exit code: 0 means healthy, and any non-zero code means something’s wrong.
This opens up a world of possibilities for custom, deep-level health checks. You could run a script that verifies filesystem integrity, queries a local process, or validates some internal application state—things you could never do with the other probes. It’s the ultimate escape hatch for complex validation logic.
Here’s a creative example where a liveness probe checks if a specific file exists:
apiVersion: v1 kind: Pod metadata: name: exec-probe-example spec: containers:
- name: my-worker
image: my-worker-app:2.1
args:
- /bin/sh
- -c
- “touch /tmp/healthy; sleep 30; rm -f /tmp/healthy; sleep 600”
livenessProbe:
exec:
command:
- cat # The command to execute.
- /tmp/healthy # Arguments for the command. initialDelaySeconds: 5 periodSeconds: 5
In this slightly unusual case, the container creates a /tmp/healthy file at startup and then deletes it after 30 seconds. The liveness probe uses cat to check for that file every 5 seconds. As soon as the file disappears, the cat command fails, its exit code flips to non-zero, and the container gets restarted.
Advanced Health Check Strategies and Best Practices
Just putting probes in place is the easy part. The real work begins when you start fine-tuning them to build a genuinely resilient application. The difference between a stable system and one stuck in an endless restart loop often comes down to getting these advanced settings right and sticking to a few proven best practices.
Getting the timing right is everything. You have to strike a delicate balance with parameters like periodSeconds and failureThreshold. If you get too aggressive—checking every couple of seconds with a low failure threshold—you risk a temporary network blip or a CPU spike triggering a totally unnecessary restart. Before you know it, you’re looking at a CrashLoopBackOff error, with your app unable to ever stabilize.
On the other hand, if your settings are too relaxed, you’re just delaying the inevitable. Your application could be dead in the water for minutes before Kubernetes finally steps in, leaving a trail of frustrated users. The sweet spot is a configuration that truly reflects how long your app needs to recover and how much downtime you can actually tolerate.
Differentiating Liveness from Readiness Probes
One of the most common and dangerous anti-patterns I see is people using the same health check endpoint for both liveness and readiness probes. These two probes have completely different jobs, and their checks need to reflect that.
-
Liveness Probe: Its one and only job is to answer the question, “Is my application completely frozen?” This check needs to be lightning-fast and self-contained. A simple HTTP endpoint that just returns a
200 OKwithout touching a database or any other external service is perfect. The moment you add external dependencies to a liveness probe, you’re setting yourself up for cascading failures. -
Readiness Probe: This probe answers a different question: “Is my application ready to handle traffic right now?” This is where you should check those dependencies. Your readiness endpoint is the right place to verify the database connection, ping a downstream microservice, or make sure a critical cache has been populated.
By keeping liveness checks simple and internal, you ensure that a flaky downstream service doesn’t cause your entire application fleet to needlessly restart. Instead, the readiness probe will correctly pull the pod out of the service load balancer until its dependencies are healthy again—the proper, non-destructive way to handle it.
Avoiding Common Health Check Pitfalls
Beyond that critical liveness/readiness separation, a few other traps can completely undermine your system’s stability. A big one is creating resource-hogging health checks. If your /healthz endpoint kicks off a complex database query, you could inadvertently pile on significant load with every single probe, potentially causing the very problem you’re trying to detect.
Another classic mistake is creating probes that have their own failure modes, like an exec probe that calls a shell script full of bugs. Always, always keep your health check logic as simple and bulletproof as possible.
Of course, none of this works if you’re flying blind. Strong observability is non-negotiable for monitoring how your probes are behaving in the wild. For a deeper dive on this, our guide on observability best practices covers what you need to know to effectively monitor your application’s health.
Testing Your Probes with Real-World Traffic Simulation
Getting your Kubernetes health check configured is one thing. Making sure it doesn’t fall apart under pressure is a whole different ballgame.
It’s a classic scenario: a probe works perfectly when the system is idle, but the moment real-world load hits, it becomes a liability. It starts triggering false positives, causing a cascade of unnecessary and disruptive pod restarts. This is why simulating production traffic isn’t just a “nice-to-have”—it’s an essential step for building systems that can actually survive in the wild.
You have to be sure your health checks can tell the difference between a genuine failure and a temporary slowdown from a traffic spike. If you can’t validate that, you’re not deploying a safety net; you’re deploying a potential point of failure.
Why Simple Tests Just Don’t Cut It
Most standard load tests rely on synthetic, predictable traffic. They just don’t capture the chaotic, spiky reality of how real users behave. Actual production traffic is messy—it’s full of unexpected request sequences, varied payloads, and weird concurrency patterns that will stress your application and its health endpoints in ways you’d never think to script.
When a probe fails under these real-world conditions, it can kick off the dreaded “restart loop.” Pods get terminated and recreated over and over again, completely tanking your availability. To sidestep this disaster, you need a much more realistic way to test.
This is exactly where a tool like GoReplay comes into the picture. It lets you capture traffic directly from your production environment and replay it against a staging or test environment.
By using the real deal, you get to see precisely how your application and its brand-new Kubernetes health checks will react to authentic user load before you push them live.
A Workflow for Realistic Probe Validation
Testing with real traffic simulation isn’t complicated, but it does require a clear, repeatable process to ensure your probes are truly ready for production. This approach takes you from theoretical configuration to practical, evidence-based confidence.
Here’s a simple workflow using GoReplay:
- Capture Production Traffic: First, you’ll use GoReplay to listen in and record a good sample of live traffic from your production environment.
- Set Up a Test Environment: Spin up your application in a staging environment, complete with the new liveness and readiness probes you want to test.
- Replay the Captured Traffic: Point GoReplay at your staging environment and let it unleash the captured traffic, simulating a realistic load.
- Monitor and Analyze: Now, you watch. Keep a close eye on Kubernetes events (a quick
kubectl describe podis your friend here) and your application logs. Are probes triggered correctly? Does the app stay responsive? And most importantly, do you see any false-positive restarts?
This kind of proactive testing ensures your health checks aren’t just syntactically correct, but functionally solid under the intense pressure of real-world operation. It turns an unknown variable into a known strength.
By adopting a simulation-driven approach, you can confidently deploy health checks that genuinely improve stability instead of accidentally compromising it. To dive deeper, you can find detailed guides on how to replay production traffic for realistic load testing and apply these techniques to your own probe validation process.
Troubleshooting Common Health Check Failures
Even the most carefully crafted health checks can go wrong, kicking your pods into a dreaded restart loop or yanking them out of service. When a probe starts failing, you need to figure out what’s happening—and fast. Luckily, your best friends for the job are a couple of straightforward but incredibly powerful kubectl commands.
Your first move should always be to get the big picture. Run kubectl describe pod <pod-name>. This command is your go-to for a quick diagnosis. Scroll down to the bottom of the output, and you’ll find a detailed event log that often tells you exactly why a probe is misbehaving.
Look for messages like
Liveness probe failedorReadiness probe failed. These events are the smoking gun, pointing you directly to the source of the instability and confirming that a health check is at the root of your problem.
Digging Deeper into Probe Failures
If the event log doesn’t give you enough to go on, it’s time to look inside the container itself. By running kubectl logs <pod-name>, you can peek at the application’s direct output. You’re hunting for error messages, stack traces, or any other clues that explain why it’s not responding to the health check as expected. This is where you’ll uncover application-specific problems that describe can’t see.
You’ll find that a handful of common issues are responsible for most probe failures. Each one needs a slightly different fix, but they’re all identifiable with these two simple commands.
Some of the usual suspects include:
- Slow Application Startup: Your app might just be taking its sweet time to initialize, longer than the
initialDelaySecondsyou configured. If the probe jumps in too early, it’s guaranteed to fail, potentially triggering a restart before your app ever gets a chance to become ready. - Incorrect Probe Configuration: It happens to everyone. A simple typo in an
execcommand’s path, the wrong port for a TCP or HTTP probe, or a mistyped endpoint will cause immediate and consistent failures. Double-check your YAML. - Network Policies: Is it a networking issue? A restrictive network policy could be blocking the kubelet from reaching your pod’s probe endpoint or port. If the connection can’t be made, the check will time out every single time.
- Resource Exhaustion: If your container is starved for CPU or memory, it can become sluggish and unable to respond to the probe within the
timeoutSecondswindow. It’s not that the app is broken—it’s just too busy (or throttled) to answer in time.
By systematically using describe to check the pod’s events and logs to see what the application is saying, you can quickly narrow down the cause. This turns a potential outage into a minor hiccup you can solve in minutes.
Common Questions About Kubernetes Health Checks
Even after you get the hang of probes, a few common questions always pop up when it’s time to actually implement them. Getting these right from the start will save you from some major headaches down the road.
What’s the Real Difference Between Liveness and Readiness Probes?
This is easily the most common point of confusion.
A liveness probe is your container’s heartbeat monitor. It answers one simple question: “Is this thing still running?” If the probe fails, Kubernetes assumes the application is completely stuck or deadlocked. Its only option is to kill the container and start a new one, hoping a fresh start will fix it.
A readiness probe is more nuanced. It asks, “Is this container actually ready to do work and accept new traffic?” If this probe fails, Kubernetes knows the container is alive but just not ready. It wisely stops sending it new requests by taking its IP address out of the Service’s endpoint list. Once the probe starts passing again, Kubernetes happily adds it back to the pool.
Think of it like this: a failed liveness probe means the container is broken and needs a hard restart. A failed readiness probe means it’s just temporarily busy—maybe it’s warming up or waiting on a database connection—and just needs a moment before taking on more work.
How Do I Pick the Right Thresholds?
Setting the failureThreshold and periodSeconds is a classic balancing act. There’s no single magic number.
If you get aggressive (like checking every 5 seconds with a failureThreshold of 2), you’ll detect failures almost instantly. But you also risk triggering unnecessary restarts every time there’s a minor network blip or a momentary spike in CPU usage.
On the other hand, if you’re too tolerant (like checking every 20 seconds with a failureThreshold of 5), you’ll avoid false alarms but take much longer to recover from a genuine crash. The best strategy is to start with conservative values, watch how your application behaves, and then fine-tune based on real-world performance data.
Can a Bad Health Check Actually Cause Harm?
Oh, absolutely. In fact, a poorly configured health check can be far more dangerous than having no health check at all.
Imagine a liveness probe that checks a connection to an external database. If that database goes down for maintenance, every single one of your application pods will fail their liveness check. Kubernetes will dutifully restart them all, see the database is still down, and restart them again. You’ve just created a massive, self-inflicted restart loop—a cascading failure.
This is why liveness probes must be simple and self-contained, checking only the internal state of the container itself. Readiness probes are the right place to check external dependencies. That way, your system can gracefully handle downstream issues without blowing itself up.
Are your health checks truly ready for production? The only way to know for sure is to test them with realistic traffic. GoReplay lets you capture and replay live user requests, validating how your probes behave under real-world load so you can prevent unexpected failures. Learn more at GoReplay.