Master Your JMeter Load Test A Practical Guide
At its core, a JMeter load test is a way to see how your application holds up under pressure. It uses the open-source Apache JMeter tool to throw a simulated crowd of users at your system—whether it’s a website, an API, or something else entirely. For developers and QA engineers, this is our go-to method for finding out where an application might break, measuring how fast it responds, and making sure it’s stable enough for the real world. It’s an absolutely crucial step before you even think about going live.
Getting Started With Your First JMeter Load Test
 Diving into your first JMeter load test can seem a bit daunting, but its power and flexibility make it a skill worth mastering. Before we start building test plans, it’s worth understanding why JMeter has been a dominant force in performance testing for over two decades. It’s open-source, platform-independent, and packed with features, making it a favorite for organizations of all sizes.
The tool’s wide adoption speaks for itself. It’s not just for small projects; massive enterprises in mission-critical sectors trust it every single day. This is reflected in its market share, where it holds an estimated 11.7% of the software testing tools market.
You’ll find JMeter being used heavily in industries like:
- Information Technology and Services (29%)
- Computer Software (17%)
- Financial Services (5%)
This diverse user base, with 49% of users in medium-sized businesses and 24% in large enterprises, proves its scalability. JMeter hits a sweet spot, offering a no-cost entry point for small teams while still having the muscle for complex corporate environments. You can dig into more data on JMeter’s adoption at Enlyft.
Core Components You Need to Know
To run a meaningful JMeter test, you first have to get comfortable with its fundamental building blocks. Think of them as the Lego pieces you’ll use to construct your testing scenarios. The entire structure is called a Test Plan—the top-level container that holds everything.
Key Insight: Understanding these core components is non-negotiable. Mastering their individual functions and how they interact is the foundation for creating any effective and realistic load test. Without this, you’re just clicking buttons without a strategy.
The table below breaks down the key pieces you’ll work with inside your Test Plan. Getting a handle on these is the first step toward building powerful tests.
| JMeter Core Components At a Glance |
|---|
| Component |
| Primary Function |
| Example Use Case |
| Test Plan |
| The root element that contains all other components for a single test. |
| A complete load test scenario for a checkout process, including user login, product search, and payment. |
| Thread Group |
| Defines the virtual user load: number of users (threads), ramp-up time, and test duration or loop count. |
| Simulating 100 users who all log in over a 60-second period and each run the test 5 times. |
| Samplers |
| The actual requests sent to the server (e.g., HTTP, FTP, JDBC). |
An HTTP Request sampler to hit the /api/v1/products endpoint on your server. |
| Listeners |
| Collects, aggregates, and visualizes the test results in various formats like tables, graphs, and summary logs. |
| Using the “View Results Tree” to debug individual requests or “Summary Report” to see overall performance stats. |
Inside the Test Plan, the most critical element you’ll configure is the Thread Group. This is where you define the user load. You’ll specify the number of virtual users (threads), how quickly they should start hitting your application (the ramp-up period), and how many times the test should repeat (the loop count). It’s essentially the control center for your simulated traffic.
From there, you’ll add Samplers, which are the actual requests sent to your server. The most common one you’ll use is the HTTP Request sampler, which acts just like a browser asking for a web page.
Finally, Listeners pull together and display the results from your samplers. They’re what turn raw data into useful information, showing you critical metrics like response times and error rates in different formats.
Building a Realistic JMeter Test Plan
Alright, let’s get our hands dirty. Moving from theory to practice is where the real work begins, and a successful JMeter load test hinges on a Test Plan that truly mirrors how people use your application. A generic test that just pings a single endpoint isn’t going to uncover the tricky bottlenecks that pop up with real-world traffic.
We’re going to build a plan that simulates a classic user journey on an e-commerce site. Our scenario will cover two key user actions: logging in and searching for a product. This isn’t just about sending static requests; it’s about using dynamic data to represent different users and search queries. This is the secret sauce for creating a realistic load profile instead of just hammering the same URL, which often gives you misleading results.
The basic flow for setting up a new test plan looks something like this:
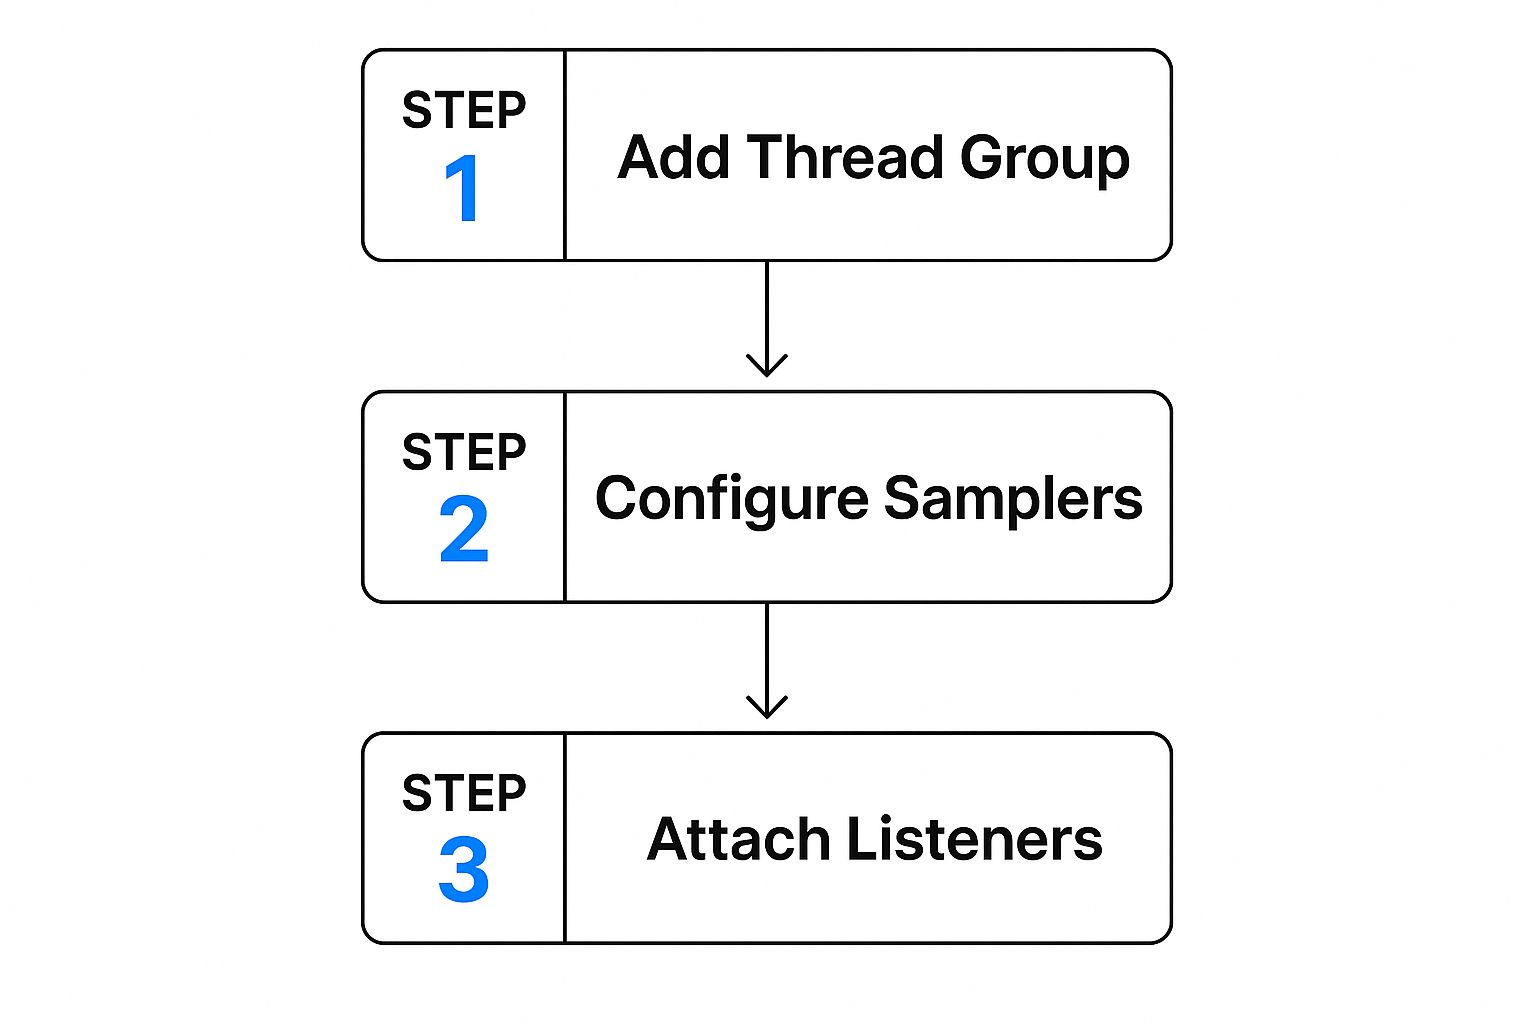
You define your user load with a Thread Group, build out the specific actions with Samplers, and then add Listeners to see what happened. Simple enough, right? Let’s break it down.
Configuring the User Load
First things first, you need a Thread Group. Think of this as the control panel for your virtual users. It’s where you configure the three most critical settings that define the very nature of your load test.
- Number of Threads (Users): This is simply the total number of virtual users you want to simulate. For our example, let’s start with 50 users.
- Ramp-Up Period (in seconds): This tells JMeter how long to take to get all your users active. A value of 25 means JMeter will introduce two new users every second, which prevents an unnatural, all-at-once traffic spike.
- Loop Count: This sets how many times each user will run through the entire test flow. We’ll set it to 10, so each of our 50 users will log in and search for a product ten times.
These settings are everything. A short ramp-up creates a “spike test,” perfect for modeling events like a Black Friday sale. A longer ramp-up, on the other hand, simulates more gradual, organic traffic growth.
Pro Tip: Don’t just pull these numbers out of thin air. Dig into your server logs or analytics data. Understanding your typical concurrent user counts and session lengths is what makes the difference between a good guess and a reliable test.
Making Requests Dynamic and Realistic
With our user load defined, it’s time to build the actual requests. Static requests are easy, but they aren’t real. Your users don’t all log in with user1/pass1 or search for “widget.” To mimic this variability, we’ll lean on the CSV Data Set Config element.
This nifty element lets JMeter read data from a simple text file, line by line. For our e-commerce test, we’d create a file named user_data.csv with columns for username, password, and searchTerm.
Now, when you add your HTTP Request Samplers for the login and search actions, you can swap out hardcoded values for variables from your CSV file, like ${username} and ${searchTerm}. Suddenly, each virtual user is pulling a unique line from the file for each test loop, creating a far more authentic scenario.
It’s also absolutely crucial to add an HTTP Header Manager to your Test Plan. Many web apps and APIs expect specific headers, like Content-Type: application/json or custom authentication tokens. If you forget these, your requests might fail for reasons that have nothing to do with performance, completely skewing your results.
While this guide focuses on web applications, these principles are just as vital for other protocols. For a much deeper dive, check out our complete guide on load testing a REST API with JMeter.
Running Your Test and Interpreting the Results
Once your realistic test plan is built, you’re ready to run it. This is where many people make a critical mistake: they just hit the “Start” button inside the JMeter GUI. While that’s fine for a quick debug, it’s a huge no-no for a real JMeter load test. The graphical interface is a resource hog, consuming significant memory and CPU that will absolutely skew your results.
For accurate, dependable data, you have to run your tests from the command line. This non-GUI mode ensures your machine’s resources are dedicated to generating load, not rendering charts in real-time. It’s a non-negotiable step for any professional performance testing.
Just open your terminal, navigate to JMeter’s bin directory, and fire off this command:
jmeter -n -t /path/to/your/TestPlan.jmx -l /path/to/your/results.csv
Let’s quickly break down those flags:
- -n tells JMeter to run in non-GUI mode.
- -t points to your saved JMX test plan file.
- -l specifies the path for the CSV file where JMeter will log the results.
This approach is the only way to get trustworthy metrics that reflect your application’s true performance, not your local machine’s limitations.
Decoding Your JMeter Load Test Results
After the test wraps up, you’ll have a CSV file packed with raw data. This is where the real analysis begins. JMeter has a lot of “Listeners” for this, but two are my go-to’s. For debugging, the View Results Tree is invaluable because it shows every single request and response. But for performance analysis, the Aggregate Report is your best friend.
To see what happened, you can open that CSV file using the Aggregate Report listener back in the JMeter GUI. It takes all that raw data and boils it down into a clean, tabular format, focusing on the key performance indicators (KPIs) that tell the story of how your app held up under stress.
These KPIs are the lifeblood of performance engineering. It’s no surprise the global load testing market, valued at USD 1.7 billion in 2023, is projected to hit USD 4.5 billion by 2033. This growth is driven by the need for exactly this kind of insight. You can dig more into these market trends and their drivers here.
Key Takeaway: Raw data is just noise. The real value of a JMeter load test comes from translating metrics like throughput and error rate into actionable insights about your application’s capacity and user experience.
Key Metrics to Analyze
In your Aggregate Report, zoom in on these three core metrics to start:
-
Average Response Time: This is the average time, in milliseconds, the server took to respond to all requests. A low average is great, but keep an eye on the deviation. High deviation means inconsistent performance, which is often worse than being consistently slow.
-
Throughput: This measures how many requests your application handled per second. Think of it as a direct indicator of your system’s capacity. Higher throughput is almost always better.
-
Error %: This is the percentage of requests that failed. Anything above 0% needs immediate investigation. Failures could be server errors (5xx codes) or client-side issues (4xx codes) that your test just uncovered.
By getting a handle on these figures, you can graduate from simply running a JMeter load test to making informed decisions that genuinely improve your application’s stability and scalability.
Ready to move beyond the basics? Once you have a handle on simple JMeter scripts, it’s time to make your load tests truly mimic your users. A basic test is a good starting point, but let’s be honest—real users are messy. They don’t follow a perfect script. They pause, they click around, they make unpredictable choices. This is where JMeter’s advanced components really shine.
To build these more lifelike simulations, we need to inject logic and realistic pacing into our test plans. When you move beyond a simple sequence of HTTP requests, you start finding the tricky performance issues that only show up under complex, real-world conditions. This is how you catch those nasty bugs, like a race condition that happens only when two users try to book the same hotel room at the exact same time.
https://www.youtube.com/embed/MP-wdpn6BtQ
Ensuring Correctness with Assertions
A fast response means nothing if it’s the wrong one. Think of Assertions as your safety net. They verify that the server is sending back the data you actually expect. Without them, you could be staring at a sea of green 200 OK responses that are really just beautifully styled error pages.
The Response Assertion is a great place to start. You can set it up to check for a specific piece of text in the response body. For instance, after a login request, you could add an assertion to make sure the response page includes “Welcome back, user!” This simple check transforms your test from a simple server check into a true functional validation.
Creating Dynamic User Journeys
Let’s face it, real users don’t follow a rigid path. They browse, they compare items, and they change their minds. This is where Logic Controllers come in, letting you build that decision-making process right into your JMeter test plan.
- If Controller: This one is incredibly useful. It lets you run a request only if a certain condition is true. For example, you could check a variable from a previous response to see if an item is “in stock” before your script tries to add it to the cart.
- Loop Controller: Perfect for repetitive actions. Imagine a user adding five different items to their shopping cart—a Loop Controller handles that beautifully within a single user session.
- Random Controller: Want to simulate a user who might click one of several promotional banners on your homepage? The Random Controller adds that touch of unpredictability by picking just one of its child requests to run at random.
Key Insight: The real power comes from combining these Logic Controllers. A test that can branch based on what the server sends back is far better at mirroring a real user’s journey. This is how you uncover a much wider range of potential performance bottlenecks.
Controlling Pace with Timers
Just hammering a server with requests as fast as possible isn’t a realistic test. It creates artificial bottlenecks and doesn’t reflect how people actually use an application. Timers are essential for introducing delays between requests, simulating a user’s “think time.”
While a Constant Timer adds a simple, fixed delay, the Constant Throughput Timer is where things get interesting. Instead of a fixed pause, this timer dynamically adjusts the delays to maintain a specific target throughput, like samples per minute. It’s incredibly powerful for modeling scenarios where you need to see if your system can handle a steady, consistent load—say, 120 transactions per minute—no matter how fast or slow the server responds.
Scaling Up with Distributed Testing
At some point, a single laptop just won’t be enough to generate the kind of load you need to really stress your application. That’s when you turn to JMeter’s distributed testing features. Using a master-slave architecture, you can orchestrate multiple load-generator machines (slaves) from your main controller (the master).
This setup is non-negotiable for simulating thousands of concurrent users, especially if you want to mimic traffic coming from different geographic locations. Since it first appeared back in 1998, JMeter has become a go-to tool for this kind of large-scale testing. You can get a sense of JMeter’s history and powerful features on Dev.to. By distributing the load, you get much more accurate results and can be confident that the bottleneck you find is in your app—not your testing hardware.
JMeter Best Practices and Common Mistakes

Crafting a JMeter load test that gives you real, actionable insights is both a science and an art. After years of running tests, you learn a few non-negotiable rules that separate a good test from a great one. Following these best practices saves time and, more importantly, ensures your results are actually trustworthy.
First things first: always use the latest stable JMeter version. I can’t stress this enough. Every single release brings critical bug fixes, performance boosts, and new features that can directly impact your test’s quality. If you’re running an old version, you’re likely fighting battles that have already been won.
Just as critical is to run all your formal load tests in non-GUI mode. The graphical interface is fantastic for building and debugging your test plans, but it’s a resource hog. It consumes a ton of memory and CPU. Running a real test from the GUI can introduce so much overhead that it skews your numbers, making your own machine the bottleneck instead of the server you’re trying to test.
Avoiding Common Testing Pitfalls
Beyond those two golden rules, there are several common traps I see people fall into that can completely undermine a well-structured test. One of the most frequent is relying too heavily on the HTTP(S) Test Script Recorder. It seems like a great shortcut, but it often generates messy, hard-to-maintain scripts that are a nightmare to parameterize. Take the time to build your scripts manually. The result is a cleaner, more robust, and more logical test flow.
Another classic mistake is using unrealistic “think time”—or worse, no think time at all. Real users don’t just hammer your server with non-stop requests; they pause, read, and think between actions. A test that bombards a server without these built-in delays doesn’t simulate real-world behavior. It just creates artificial stress patterns. Use timers to mimic how a real person would navigate your site.
Crucial Reminder: A 200 OK response doesn’t mean everything worked. This is a massive pitfall. That “OK” page could easily be an error message cleverly styled to look like a success page. You must use Assertions to validate the actual response content and confirm the application is returning what you expect.
Finally, don’t forget the environment itself. Your test setup should mirror your production environment as closely as possible. Testing on a vastly underpowered staging server will give you performance data that is completely useless for predicting how your live environment will behave. If you want to dive deeper into what makes a comprehensive testing strategy, check out this guide to what is load testing software.
Quick Sanity Checklist
Before you kick off a test, run through this quick sanity check. It can save you from invalidating hours of work due to a simple oversight.
- Script Logic: Is the flow logical? Do your assertions check for correct page content, not just a 200 status code?
- Data Parameterization: Are you feeding each virtual user unique data (e.g., from a CSV Data Set Config)? Reusing the same login for every user isn’t a real test.
- Test Execution: Are you running from the command line (non-GUI mode)? Seriously, double-check.
- Listeners: Have you disabled or minimized resource-heavy listeners like “View Results Tree” during the actual run? They are for debugging, not for the main event. Generate the results file and analyze it after the test is complete.
Paying attention to these details is what separates a professional, insightful load test from one that just produces misleading noise.
Frequently Asked JMeter Questions
When you’re in the thick of a JMeter load test, you’re bound to hit a few snags or have questions pop up. It happens to everyone, whether you’re just dipping your toes in or you’re a seasoned pro trying to untangle a tricky scenario. Having a quick answer ready is a lifesaver.
Here are a few of the most common questions that cross my desk.
How Much Load Can One Machine Handle?
This is probably the first question everyone asks, and the honest answer is always: it depends.
On a standard machine, you might squeeze out 500 to 1,000 virtual users if your test script is dead simple—we’re talking basic HTTP requests. But that number drops off a cliff as soon as you add any real complexity. Things like detailed logic, hefty data files, and post-processors are all resource hogs that chew up CPU and memory, leaving less power for generating actual load.
Key Takeaway: Your application under test should always be the bottleneck, not the machine running JMeter. If you need to simulate thousands of users, distributed testing isn’t just an option; it’s the only way to get reliable results.
Understanding Key Metrics and Scripting
It’s easy to get confused by some of the terminology, especially the difference between Throughput and Hits per Second. They sound alike, but they’re measuring two very different things.
- Hits per Second: This is a raw count of every single request fired at your server. Think of a webpage—this metric includes the main HTML file plus all the CSS, JavaScript, and images it pulls in. It’s a measure of server activity.
- Throughput: This is about business value. It measures how many complete user actions (or transactions) are finished over a period. A single “transaction,” like a full login flow or adding an item to a cart, could involve dozens of individual hits. Throughput is a much better gauge of what your application can actually accomplish.
So, should you build your test scripts by hand or lean on the HTTP(S) Test Script Recorder?
The recorder is a fantastic starting point. It’s great for quickly mapping out a simple user journey and seeing all the hidden requests your browser makes in the background. It’s an excellent learning tool.
But for creating tests that are robust, clean, and easy to maintain, nothing beats building the script manually. When you create a plan from scratch, you have total control over parameterization, correlation, and logic. This approach leads to a far more realistic and dependable test that you can easily debug and update as your application changes. Recording is for learning; manual scripting is for professionals.
Ready to stop simulating and start replaying? GoReplay is an open-source tool that lets you capture and replay your real production traffic. This means you can run a JMeter load test that perfectly mirrors what your actual users are doing. Find out how to build the most realistic performance tests you’ve ever run by visiting https://goreplay.org.