Running Your InfluxDB Docker Container Like a Pro
Running an InfluxDB Docker container is easily the fastest and most reliable way to get a time-series database off the ground. It gives you a clean, isolated environment for development, testing, and even production, all while guaranteeing consistency across different machines with a single command.
Why Run InfluxDB in a Docker Container

Choosing to run InfluxDB inside Docker isn’t just about following a trend; it’s a smart, strategic move that solves a ton of real-world development and operational headaches. The biggest win here is environmental consistency.
When you package the database and all its dependencies into a single image, you finally put an end to the classic “it works on my machine” problem. That consistency stretches from your local laptop all the way to staging and production, which drastically cuts down on configuration drift and makes debugging so much simpler.
There’s a reason container tech has taken over. The 2025 Docker State of Application Development Report shows container usage has shot up to 92% in the IT industry, a big jump from 80% the year before. For InfluxDB, this means you can pull official Docker images and deploy the entire TICK Stack with complete confidence.
Key Advantages of the Docker Approach
Using a Docker container for InfluxDB brings a lot of practical benefits to the table, making it the go-to method for developers and DevOps teams everywhere.
Here’s why this approach is so effective:
- Isolation and Portability: Your InfluxDB instance runs in its own little sandbox, which means no more conflicts with other services or system libraries on the host machine. You can literally pick up the container and move it to another host without reinstalling anything.
- Rapid Deployment and Scaling: Need a new InfluxDB instance? You can spin one up in seconds with a single
docker runcommand. This speed is a game-changer for testing, CI/CD pipelines, and scaling out your data layer. - Simplified Version Management: Want to try out a new version of InfluxDB? Just pull a different image tag. You can even run multiple versions side-by-side (on different ports, of course) without them stepping on each other’s toes.
- Clean and Reproducible Setups: By defining your whole stack—InfluxDB, Telegraf, Grafana, and all—in a
docker-compose.ymlfile, you create a complete, version-controlled monitoring platform that anyone on your team can launch with one command.
The real magic of the InfluxDB Docker container is its ephemerality combined with persistent storage. You can tear down and recreate the container whenever you need for updates or config changes, while your actual data stays safe and sound in a Docker volume.
Understanding InfluxDB 1.x vs 2.x in Docker
When you go to pull an influxdb image, you’ll see you have a choice: the legacy 1.x versions or the modern 2.x platform. In a Docker context, the differences between them are pretty significant.
InfluxDB 1.x was really just the database. To build a full monitoring solution, you had to pull in other components from the TICK Stack (Telegraf, Chronograf, Kapacitor), usually running them in separate containers. It worked, but it was a lot to manage.
InfluxDB 2.x, on the other hand, is an all-in-one platform. It has data collection APIs, a built-in UI for querying and visualization (which replaces Chronograf), and task processing (which replaces Kapacitor) baked right in. This consolidation makes the Docker setup for 2.x incredibly simple, often needing just a single container to get a complete solution up and running.
InfluxDB 1.x vs 2.x Docker Deployment at a Glance
For anyone new to InfluxDB or deciding which version to use in Docker, this table quickly breaks down the key differences in their deployment models.
| Feature | InfluxDB 1.x (TICK Stack) | InfluxDB 2.x (OSS) |
|---|---|---|
| Architecture | Component-based. Requires separate containers for Telegraf (data collection), Chronograf (UI), and Kapacitor (tasks). | All-in-one. Core database, UI, and task engine are integrated into a single binary and a single Docker image. |
| Setup Complexity | Higher. You need to manage multiple containers, link them via Docker networking, and handle individual configurations. | Lower. A single docker run command or a simple docker-compose.yml is often all you need to get started. |
| Authentication | Simple username/password for the database. Components may have their own auth methods. | Token-based. Uses API tokens with granular permissions for all interactions (read, write, admin), offering much tighter security. |
| Query Language | InfluxQL. A familiar, SQL-like language for querying time-series data. | Flux. A powerful, functional scripting language for complex queries, data transformation, and alerting logic. Also supports InfluxQL for backward compatibility. |
| User Interface | Chronograf. A separate application for dashboards, data exploration, and alert management. | Built-in UI. A comprehensive web interface is served directly from the influxdb container for setup, queries, dashboards, and tasks. |
Ultimately, InfluxDB 2.x is designed to be a more streamlined, cohesive platform, and that really shines through when you deploy it with Docker. The all-in-one approach simplifies setup, configuration, and management, making it the recommended choice for new projects.
Ensuring Your Data Survives Restarts
Spinning up an InfluxDB Docker container is incredibly fast, but that speed comes with a huge catch. By default, anything you write inside a container—including all your valuable time-series data—is ephemeral. It exists only for the life of that container. The moment you stop and remove it, poof. Everything is gone.
This temporary nature is actually a feature, not a bug, designed for stateless applications. But for a database? It’s a complete disaster waiting to happen. To run InfluxDB for anything serious, you absolutely have to set up a persistence strategy that separates your data’s lifecycle from the container’s.
Why Named Volumes Are the Professional Choice
When it comes to keeping data safe in Docker, you’ve got two main options: bind mounts and named volumes. Bind mounts might seem simple at first—you just map a folder from your computer directly into the container. The problem is, this creates a tight, brittle link between the container and your host machine’s filesystem, making your setup difficult to move or manage.
Named volumes are, without a doubt, the superior solution. They are fully managed by Docker itself, stored in a dedicated, optimized area on the host, and aren’t tied to a specific directory structure. This abstraction is what makes them so powerful.
Here’s why pros almost always choose named volumes for database containers:
- Portability: Your data isn’t stuck in a specific path like
/home/user/influxdata. You can back up, migrate, or move the volume between Docker hosts with ease. - Easier Management: Docker gives you simple commands to create, list, inspect, and nuke volumes, all completely independent of any running container.
- Better Performance: On many platforms, especially Docker Desktop for Mac and Windows, named volumes give you a significant performance boost over bind mounts for I/O-heavy work—exactly what a database does.
- Security: Volumes are isolated from your computer’s main filesystem, which helps prevent a container from accidentally messing with critical host files.
Implementing Persistence with Named Volumes
Putting this into practice is pretty straightforward. The whole trick is to map a Docker named volume to the specific directory inside the container where InfluxDB squirrels away its data. For InfluxDB 2.x, that location is /var/lib/influxdb2.
First, it’s a good practice to create the volume ahead of time with a descriptive name. It just keeps things clean.
docker volume create influxdb2-data
Now, when you run your InfluxDB container, you just attach this volume using the --mount flag. This tells Docker to connect your persistent influxdb2-data volume to the correct internal path.
docker run -d —name influxdb -p 8086:8086
—mount source=influxdb2-data,target=/var/lib/influxdb2
influxdb:latest
With that single line, any data written by InfluxDB is now stored safely in the influxdb2-data volume. You can stop, remove, and even update the influxdb container. As long as you reattach that same volume, your data will be right where you left it.
This approach neatly separates your application (the container) from your data (the volume). Think of it like swapping out the engine of a car without touching anything in the trunk. Your valuable cargo stays safe and sound.
Managing Configuration Persistently
Your time-series data isn’t the only thing you want to keep around; your configuration is just as important. InfluxDB stores its runtime config files in /etc/influxdb2. If you make changes through the UI or API, those changes are saved inside the container and will be wiped out on restart unless you persist them.
The solution? You guessed it: use another named volume.
docker volume create influxdb2-config
Then, just attach it when you launch your container. The full command combines both data and config persistence for a truly resilient setup.
docker run -d —name influxdb -p 8086:8086
—mount source=influxdb2-data,target=/var/lib/influxdb2
—mount source=influxdb2-config,target=/etc/influxdb2
influxdb:latest
Now, both your data and your instance configurations will survive container restarts and upgrades. This kind of robust setup is essential as you move from quick experiments to production-grade deployments, especially in orchestrated environments like Kubernetes.
The industry’s rapid shift towards different container runtimes only highlights the importance of portable, well-managed persistence. In fact, Datadog’s container report shows that containerd adoption has skyrocketed to 53%, a massive jump from just 23% a year ago, largely driven by Kubernetes’ move away from dockershim. Luckily, the official InfluxDB Docker container images are designed to be runtime-agnostic, so your volume-based persistence strategy will work seamlessly across these evolving platforms.
Connecting and Securing Your Database
An InfluxDB container running in total isolation is like a library with no doors—all that data is locked inside, but nobody can actually get to it. To make your database useful, you need to open it up to the outside world. This means connecting it to your applications, data collectors like Telegraf, or visualization tools like Grafana.
The first step is simply exposing the primary communication port. By default, InfluxDB listens for all API traffic on port 8086 inside the container. To connect to it from your host machine or other services, you have to map that internal port to a port on the host.
This is what the -p (or --publish) flag is for in your docker run command. It uses a HOST_PORT:CONTAINER_PORT format to bridge the gap. For most setups, you’ll just map it directly.
docker run ... -p 8086:8086 ... influxdb:latest
This command tells Docker, “Hey, any traffic hitting port 8086 on my computer should be sent straight to port 8086 inside the InfluxDB container.” Simple as that. Now your apps can talk to the database just by pointing to your machine’s address.
Using Custom Networks for Multi-Container Setups
Port mapping is great for a single container, but things get more interesting when you’re building a full stack. What happens when you have Telegraf in one container and InfluxDB in another? You need a reliable way for them to talk to each other.
The best practice here is to create a custom Docker bridge network. Think of it as a private virtual network just for your containers, giving them a shared space to communicate. The real magic is the automatic service discovery—containers on the same network can find each other using their container names as hostnames. No more IP address juggling.
First, create the network:
docker network create influx-network
Next, attach your InfluxDB container to it when you launch:
docker run --name influxdb --network influx-network ... influxdb:latest
Now, when you launch a Telegraf container and attach it to the same influx-network, its configuration can simply point to http://influxdb:8086. Docker’s internal DNS handles the rest, resolving the name influxdb to the correct container’s private IP. This is way more robust than hardcoding IPs, which can change every time a container restarts.
Using custom networks is a foundational practice for building resilient, multi-service applications with Docker. It decouples your services, letting you swap out or restart containers without breaking the communication links between them.
Initializing and Securing InfluxDB 2.x
Once your container is on the network, security becomes the top priority. InfluxDB 2.x comes with a solid security model built around organizations, buckets, and API tokens. While you can do the initial setup through the web UI, a much cleaner and more automated approach is to use environment variables on the first run.
These variables let you pre-configure the instance, creating the first user and essential resources so it’s locked down from the moment it starts.
Here are the key environment variables for a secure initial setup:
DOCKER_INFLUXDB_INIT_MODE=setup: Tells the entrypoint script to run the setup process.DOCKER_INFLUXDB_INIT_USERNAME: Sets the username for the initial admin.DOCKER_INFLUXDB_INIT_PASSWORD: The password for that admin account.DOCKER_INFLUXDB_INIT_ORG: The name of the primary organization to create.DOCKER_INFLUXDB_INIT_BUCKET: The name of the first data bucket.DOCKER_INFLUXDB_INIT_ADMIN_TOKEN: A powerful, all-access token for the admin. Treat this like a root password and store it securely!
Putting it all together, a secure setup command looks something like this:
docker run -d —name influxdb -p 8086:8086
—network influx-network
—mount source=influxdb2-data,target=/var/lib/influxdb2
-e DOCKER_INFLUXDB_INIT_MODE=setup
-e DOCKER_INFLUXDB_INIT_USERNAME=admin
-e DOCKER_INFLUXDB_INIT_PASSWORD=supersecretpassword
-e DOCKER_INFLUXDB_INIT_ORG=my-org
-e DOCKER_INFLUXDB_INIT_BUCKET=my-bucket
influxdb:latest
This command fires up a container that is immediately ready and secured. Your next step should be logging into the UI to create more granular API tokens with limited read/write permissions for your apps. Don’t use the main admin token for day-to-day operations.
Encrypting Traffic with TLS
For any real-world production system, encrypting data in transit is non-negotiable. Exposing your database over an unencrypted HTTP connection is a huge security risk. The good news is that you can easily configure your InfluxDB Docker container to serve traffic over HTTPS using TLS/SSL certificates.
All you need are two files: a certificate (.crt) and a private key (.key). You’ll mount these files from your host machine into a specific location inside the container, usually /etc/ssl/.
Let’s say you have influxdb.crt and influxdb.key in a local directory called ./certs. You can mount them as read-only volumes and then pass command-line arguments to tell InfluxDB to use them.
docker run -d —name influxdb -p 8086:8086
—mount type=bind,source=./certs/influxdb.crt,target=/etc/ssl/influxdb.crt,readonly
—mount type=bind,source=./certs/influxdb.key,target=/etc/ssl/influxdb.key,readonly
influxdb:latest
—tls-cert=/etc/ssl/influxdb.crt
—tls-key=/etc/ssl/influxdb.key
With these flags, the InfluxDB process inside the container starts with TLS enabled. All connections to port 8086 will now require https://, ensuring that every piece of data exchanged between your clients and the database is fully encrypted. This step is absolutely critical for protecting sensitive credentials and metrics from anyone snooping on your network.
Orchestrating Your Stack with Docker Compose
Juggling individual docker run commands for your monitoring stack gets messy, and fast. You quickly end up with a collection of long, error-prone shell scripts that are a nightmare to manage, version, or share with your team. This is precisely the problem Docker Compose was designed to solve. It lets you define a complex, multi-container setup in a single, declarative docker-compose.yml file.
Instead of just spinning up an InfluxDB Docker container in isolation, we’re going to build a complete, real-world observability stack. This is how professional teams do it. Our stack will have three essential services working in harmony:
- InfluxDB: The heart of our stack, a time-series database for storing all our metrics.
- Telegraf: A powerful and lightweight data collector that will gather system metrics and push them to InfluxDB.
- Grafana: The industry-standard visualization tool for creating beautiful, insightful dashboards from our time-series data.
With Docker Compose, you define this entire ecosystem just once. From then on, anyone on your team can launch the whole thing with a single, simple command: docker-compose up. This approach makes your infrastructure reproducible, version-controllable, and incredibly easy to manage.
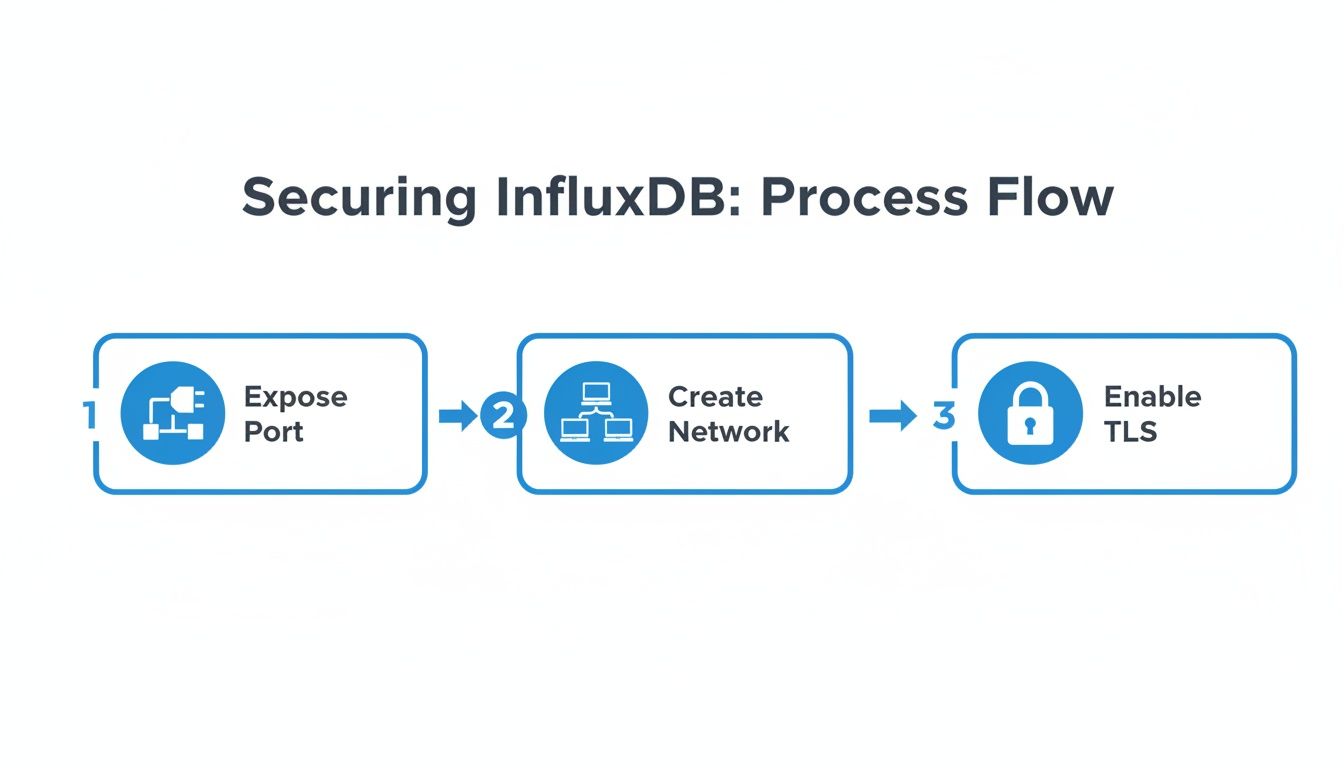
This diagram shows the basic flow: expose the right port, connect the containers on a shared network, and lock it down with TLS for a secure, accessible InfluxDB instance.
Building Your Docker Compose File
First things first, let’s create the docker-compose.yml file. Think of this YAML file as the blueprint for your entire stack. Inside, we’ll define each service, how they connect to each other, where their data lives, and any initial configuration they need.
We’ll start by defining the top-level version, services, networks, and volumes keys. Each service—influxdb, telegraf, and grafana—gets its own block where we lay out its specific configuration. You’ll immediately see how much cleaner this is than chaining together a bunch of docker run commands.
version: ‘3.8’
services: influxdb: image: influxdb:latest container_name: influxdb ports: - “8086:8086” volumes: - influxdb-data:/var/lib/influxdb2 - influxdb-config:/etc/influxdb2 networks: - monitoring-net environment: - DOCKER_INFLUXDB_INIT_MODE=setup - DOCKER_INFLUXDB_INIT_USERNAME=my-admin - DOCKER_INFLUXDB_INIT_PASSWORD=my-super-secret-password - DOCKER_INFLUXDB_INIT_ORG=my-org - DOCKER_INFLUXDB_INIT_BUCKET=system-metrics
telegraf: image: telegraf:latest container_name: telegraf volumes: - ./telegraf.conf:/etc/telegraf/telegraf.conf:ro depends_on: - influxdb networks: - monitoring-net
grafana: image: grafana/grafana:latest container_name: grafana ports: - “3000:3000” volumes: - grafana-data:/var/lib/grafana depends_on: - influxdb networks: - monitoring-net
networks: monitoring-net: driver: bridge
volumes: influxdb-data: influxdb-config: grafana-data:
This single file lays out everything we need for a robust and portable monitoring solution.
By defining services, networks, and volumes in one place, you create a self-contained, portable application. You can check this
docker-compose.ymlfile into source control, ensuring every developer gets an identical stack with zero manual setup.
Understanding the Key Components
So, what’s really going on in that YAML file? Let’s break it down.
We’ve defined a shared network called monitoring-net. This is a private bridge network that allows all three containers to find and communicate with each other using their service names as hostnames. For example, Grafana can connect to InfluxDB simply by using the address http://influxdb:8086. No need to hardcode IP addresses.
We’re also using named volumes like influxdb-data and grafana-data. This is crucial. It ensures all our critical data—our metrics and dashboards—persists even if we tear down and recreate the containers. For Telegraf, we’re using a bind mount to inject our custom telegraf.conf file directly from our project directory, a very common pattern for providing configuration.
The depends_on key is another important piece of the puzzle. It tells Docker Compose about the startup order, ensuring InfluxDB is up and running before Telegraf or Grafana try to connect to it. This one simple instruction prevents a whole class of race conditions and frustrating startup errors. Adhering to these patterns is just one of many observability best practices that help ensure your systems are reliable from the ground up.
Launching and Managing the Stack
With your docker-compose.yml file and a basic telegraf.conf sitting in the same directory, launching your entire observability stack boils down to a single command.
docker-compose up -d
The -d flag is your friend here; it runs the containers in detached mode, meaning they’ll run happily in the background. You can check on the status of your stack anytime with docker-compose ps or peek at the logs for a specific service with docker-compose logs influxdb.
When it’s time to shut everything down, another simple command handles it gracefully.
docker-compose down
This command stops and removes the containers and the network. But because we used named volumes, all your InfluxDB and Grafana data remains safe and sound, ready to be re-attached the next time you run docker-compose up. This powerful, repeatable workflow is exactly why Docker Compose has become the go-to tool for managing multi-container applications.
Backup, Restore, and Troubleshooting Your Container
Even the most carefully built systems hit a snag now and then. When that happens, a solid recovery plan is what separates a minor hiccup from a full-blown disaster. For your InfluxDB Docker container, this means knowing exactly how to back up your data and how to squash the common issues that will inevitably pop up.
A reliable backup strategy isn’t just a nice-to-have; it’s non-negotiable for any production database. The good news is that InfluxDB comes with built-in command-line tools that make this process pretty painless, even when it’s running inside a container.
Performing a Live Backup
You can grab a complete, point-in-time backup of your database without ever stopping your container. The trick is using docker exec to run the influx backup command inside the container while telling it to dump the files into a directory you’ve mounted from your host machine.
First, let’s make a directory on our host to store the backups. We’ll call it influx-backups.
mkdir -p ./influx-backups
Now, let’s run the backup. This command tells Docker to execute influx backup inside our container (which we’ve named influxdb) and save the output to the /backups directory inside the container—which we’ve cleverly mapped to our local ./influx-backups folder.
docker exec influxdb influx backup -t YOUR_ADMIN_TOKEN /backups
Once it’s finished, you’ll find a new, timestamped subfolder inside ./influx-backups. This folder has everything you need to restore your buckets and key-value data. A simple cron job that runs this command is a fantastic way to make sure you always have recent backups ready to go.
Restoring Data from a Backup
Of course, a backup is useless if you can’t restore it. The process is the mirror image of backing up, using influx restore with docker exec to target your running container. You just need to point the command at the specific timestamped backup directory you want to bring back.
For instance, to restore a backup from a folder named 20240915T123000Z, you’d run this:
docker exec influxdb influx restore -t YOUR_ADMIN_TOKEN /backups/20240915T123000Z
Heads up: the restore process will overwrite existing data for the time ranges covered in the backup file, so proceed with caution. It’s always a smart move to test your restore process in a staging environment first. That way, you know your backups are valid before you’re in an emergency.
Pro Tip: When restoring, you can get more granular. Use the
--fullflag for a complete restore, or specify individual buckets with the--bucketflag. This flexibility is a lifesaver when you only need to recover a specific dataset instead of the whole thing.
Diagnosing Common Container Issues
Beyond disaster recovery, you’ll run into everyday operational headaches. Knowing how to diagnose them quickly is a skill that pays dividends. When things go sideways, the very first place to look is always the container’s logs.
docker logs influxdb
This command spits out the standard output from the InfluxDB process, giving you immediate clues about startup errors, authentication failures, or busted queries. For a live view, you can follow the logs in real-time.
docker logs -f influxdb
Permission Errors on Mounted Volumes
One of the most common—and frustrating—issues is the dreaded “permission denied” error, especially when using bind mounts. This almost always means the user ID (UID) running InfluxDB inside the container doesn’t have the right permissions to write to the directory you’ve mounted from your host. The InfluxDB container typically runs as the influxdb user, which might have a UID of 1000.
The fix is to make sure the directory on your host machine is owned by the same UID.
sudo chown -R 1000:1000 ./your-influxdb-data-directory
Running this command changes the ownership of the host directory to match the user inside the container, instantly resolving the conflict.
Container Networking Problems
If your application can’t connect to InfluxDB, the culprit is almost always Docker networking. Here’s a quick troubleshooting checklist:
- Check Port Mapping: Did you remember to use the
-p 8086:8086flag? Rundocker psto double-check that the port is correctly mapped from the host to the container. - Verify Shared Network: If you’re using Docker Compose, are all your services on the same custom network? Containers on the default bridge network can’t find each other by name.
- Inspect Firewall Rules: Make sure your host machine’s firewall isn’t blocking traffic on the exposed port (e.g., port 8086).
Troubleshooting effectively is part of a bigger strategy of system observation. For a deeper dive into building a robust monitoring stack, check out our guide on comprehensive application and system monitoring.
Common Questions About InfluxDB and Docker
Once you get an InfluxDB Docker container running, you’ll inevitably bump into a few practical questions. These are the real-world problems that pop up when you move past a basic docker run command and start building something more serious.
Getting straight answers to these common hurdles can save you hours of digging through forums. Let’s tackle the questions I hear most often from developers.
How Do I Upgrade My InfluxDB Container to a Newer Version?
Upgrading an InfluxDB container needs to be a deliberate process, but it’s straightforward if you do it right. The most important thing to remember is that your data lives in a Docker volume, completely separate from the container.
Before you touch anything, run a backup with the influx backup command. Always. This is your safety net in case things go wrong.
With your backup secured, the first step is to pull the new image version you want to use from Docker Hub.
docker pull influxdb:2.7
Next, stop and remove your current InfluxDB container. This part feels scary, but it’s perfectly safe—this step does not delete the named volume where your precious data is stored.
Finally, launch a new container using the new image tag. The critical part here is to attach the exact same volume you were using before.
docker run --name influxdb-v2.7 ... --mount source=influxdb2-data,target=/var/lib/influxdb2 influxdb:2.7
When the new container boots up, InfluxDB is smart enough to detect the existing data files in that volume. It will automatically handle any internal migrations needed to get your database running on the new version.
Can I Run InfluxDB 1.x and 2.x Containers on the Same Host?
Absolutely. Running both versions on the same machine is a pretty common setup, especially for teams migrating from the old TICK stack to the modern InfluxDB 2.x platform.
The whole trick is just avoiding port conflicts on the host machine.
Inside their containers, both InfluxDB 1.x and 2.x are hardcoded to listen on port 8086. If you try to map both containers to port 8086 on your Docker host, the second one will fail to start. The solution is simple: map them to different external ports.
For example, you could set it up like this:
- InfluxDB 1.x: Map the container’s port
8086to the host’s8086.-p 8086:8086
- InfluxDB 2.x: Map the container’s port
8086to a different host port, like9086.-p 9086:8086
With this setup, you can talk to your 1.x instance at localhost:8086 and your 2.x instance at localhost:9086. They run side-by-side without interfering with each other at all.
This ability to isolate services through port mapping is a core benefit of Docker. It turns what would be a system-wide conflict into a simple line in your configuration, making complex development environments much easier to manage.
What Is the Best Way to Monitor the InfluxDB Container Itself?
Hands down, the best way to monitor your InfluxDB container is to use another container running Telegraf, InfluxData’s own collection agent. It’s a classic case of “dogfooding,” creating a powerful, self-monitoring feedback loop.
You can configure Telegraf’s Docker input plugin ([[inputs.docker]]) to automatically find and collect a ton of useful metrics about all running containers on the host. For your InfluxDB container, this includes things like:
- CPU and memory usage
- Network I/O (bytes sent and received)
- Block I/O (data read from and written to disk)
- Container health status and uptime
Then, you just configure Telegraf to send all that juicy data right back into your InfluxDB instance (or, even better, a separate instance dedicated to monitoring). From there, you can build dashboards in Grafana or the InfluxDB UI to visualize the container’s performance over time. This gives you incredible insight into its health and helps you spot bottlenecks before they become real problems.
At GoReplay, we believe in testing with real-world scenarios, not just simulations. Our open-source tool allows you to capture and replay live production traffic to your staging or development environments, ensuring your updates are robust and reliable before they go live. Discover a better way to test at https://goreplay.org.