How to Troubleshoot Network Issues with GoReplay
To troubleshoot network issues effectively, you need a system. I’m talking about a repeatable process: identify the problem, form a solid theory about the cause, test it, and then roll out the fix. This structured approach beats randomly trying different solutions every single time and gets you to the root cause much faster.
Why Modern Network Troubleshooting Is Broken
If you’ve ever felt like you’re chasing ghosts in your network, you’re not alone. The old playbook—pinging servers, tailing logs, and restarting services—just doesn’t cut it anymore. Today’s systems are a complex web of distributed microservices. A tiny hiccup in one service can set off a chain reaction of failures that’s almost impossible to trace with yesterday’s tools.
This complexity has a very real, very painful business impact. Downtime isn’t just an annoyance; it’s a direct hit to the bottom line. Recent data shows a worrying trend: network outages are on the rise globally, and the financial fallout is staggering.
A 2025 survey found that 84% of businesses saw an increase in outages, and over a third of them lost between $1 million and $5 million a year because of it. The top culprits? Simple things like device configuration changes (27%) and server hardware failures (26%). It’s a stark reminder of how small mistakes can snowball into massive problems. You can dig into the full findings on rising network outages and their financial impact to see just how big this challenge has become.
The Limits of Reactive Fixes
The heart of the problem is that most teams are trapped in a reactive loop. An alert goes off, engineers scramble under immense pressure, and the solution is usually a quick patch to stop the immediate bleeding. This approach is fundamentally flawed.
- It misses the root cause: A quick fix might patch a symptom, but it rarely addresses the underlying architectural or configuration flaw.
- It can’t reproduce intermittent issues: Those frustrating glitches that only show up under specific load conditions? They’re nearly impossible to replicate on demand.
- It creates a culture of firefighting: Teams burn out putting out fires instead of architecting more resilient, stable systems.
The goal of modern troubleshooting isn’t just to fix the problem in front of you. It’s to understand the failure so deeply that you can prevent an entire class of similar issues from ever happening again.
A Shift to Proactive Problem-Solving
To really get a handle on how to troubleshoot network issues in modern environments, we need a new mindset. We have to move from being reactive firefighters to proactive investigators. That means ditching the guesswork and embracing evidence-based analysis.
The key is to capture the exact conditions that trigger a failure. By recording real-world traffic with a tool like GoReplay, you create a perfect, high-fidelity snapshot of the problem as it happened. This captured traffic is pure gold.
It allows you to replay the entire incident in a safe testing environment, reliably reproducing the error on your own terms. Suddenly, troubleshooting isn’t a high-stress emergency anymore. It becomes a methodical, scientific process where you can test fixes against real traffic, validate their effectiveness, and be confident that your solution will actually hold up in production. This isn’t just an advanced technique; it’s a necessity for building the reliable, high-performance systems we all depend on.
When a service goes down and the alerts start screaming, diagnosing the real problem can feel like you’re chasing ghosts through your own infrastructure. You’re stuck staring at dashboards that only give you a piece of the story, not the root cause. The toughest part of troubleshooting modern network issues is getting past the surface-level symptoms to unravel the complex failure patterns that bring today’s systems down.
The old playbook of checking logs and rebooting servers just doesn’t cut it anymore. Our systems are so tightly interconnected that a small hiccup in one corner can create a massive ripple effect, causing seemingly unrelated failures somewhere else entirely. This is where an investigative mindset becomes your most important tool.
Moving Beyond Obvious Symptoms
When a user complains “the site is slow,” the actual issue is almost never a single, obvious bottleneck. It could be anything—a database query hanging under a specific type of load, a misconfigured cache, or a third-party API that’s decided to take an unscheduled nap. The key is to stop treating the symptom and start hunting for the source.
Let me give you a real-world example we ran into. An e-commerce platform was seeing intermittent checkout failures, but only for a tiny fraction of its users. Every single monitoring dashboard was green. The app servers all reported a clean bill of health. What we had was a hidden functional failure; the service was technically “up,” but a critical feature was silently breaking for a very specific user journey.
Without the ability to capture the exact traffic from those failing sessions, we would have been completely in the dark. It turned out that a subtle change in a payload from a payment gateway was the culprit, and it only affected users trying to pay with international credit cards.
The New Landscape of Network Failures
The very nature of outages has changed. A recent analysis of network incidents in 2025 shows just how elusive failures have become, highlighting three patterns that make troubleshooting a nightmare. These patterns prove that outages are rarely isolated events; they’re the result of complex, often unexpected, interactions between systems. You can explore the full outage pattern report to really dig into these trends.
Here’s what we’re up against now:
- Unintentional Failure Vectors: This is when tightly coupled systems become conduits for spreading a problem. Picture a feature flag service going down. It doesn’t just break one app; it triggers a cascade of failures in every single service that relies on it for configuration.
- Hidden Functional Failures: Just like in the e-commerce example, the system looks perfectly healthy according to all the standard metrics, but a crucial part of its functionality is broken. These are incredibly dangerous because your automated monitoring will almost certainly miss them.
- Configuration Cascade Effects: A single, well-intentioned config change—like tweaking a timeout value or updating a security rule—can set off a domino effect of failures across every interconnected service that depended on the old setting.
The challenge isn’t just about finding what broke anymore. It’s about deeply understanding the why. That means you have to analyze the entire sequence of events that led to the failure, not just the final error message.
Adopting an Investigative Mindset
To diagnose these complex issues effectively, you have to start thinking like a detective. Your number one job is to gather evidence, and the most reliable piece of evidence you can get is a perfect recording of the problematic traffic itself. This is the foundational skill you need before any tool, including GoReplay, can truly shine.
This investigative approach starts with asking the right questions:
- What was the exact sequence of requests that led to the failure?
- Did the request payload or headers look any different from a successful transaction?
- Which downstream service was the one that returned an error or showed unusual latency?
By focusing on these questions, you move from a reactive “put out the fire” mode to a methodical process of gathering and analyzing evidence. This not only helps you solve the problem at hand but gives you the insight needed to build more resilient systems and prevent the same outage from ever happening again.
Capturing Live Traffic Without Impacting Performance
The theory behind proactive troubleshooting is great, but real progress only starts when you have evidence. This is where we stop talking about problems and start capturing the data to solve them. Using a tool like GoReplay, you can create a perfect copy of your live production traffic, giving you a high-fidelity recording of the exact behavior causing network issues.
Of course, the first concern for any engineer is the impact on production. Nobody wants the tool meant to fix a problem to cause another one. That’s why GoReplay is built to be a passive listener.
Instead of sitting in the middle of your traffic like a proxy—which always adds latency—GoReplay listens to a copy of the network packets. It shadows your live environment without adding a single millisecond of delay to user requests or introducing a new point of failure. It’s like recording a conversation in a busy room without ever interrupting.
If you want to get into the technical weeds, our guide on how to capture network traffic breaks it all down.
Isolating the Problematic Traffic
Just capturing everything is rarely the right move. A high-traffic application can generate terabytes of data in no time, leaving you with a noisy dataset that’s a pain to analyze. The real power is in surgical precision—filtering traffic to isolate exactly what you need.
This is a critical step for effective troubleshooting. You can narrow the focus to only the requests that matter, which makes your diagnosis much faster and more accurate.
Common Filtering Strategies:
- By URL Path: Isolate all requests hitting a specific, struggling microservice by targeting its endpoint, like
/api/v2/payment. - By HTTP Method: If you suspect an issue with data submissions, you can capture only
POSTandPUTrequests. - By HTTP Status Code: Focus exclusively on failures by capturing traffic that results in
502 Bad Gatewayor504 Gateway Timeouterrors. - By Request Header: Maybe you need to capture traffic only from a specific user agent or sessions with a certain auth token.
Applying these filters transforms a firehose of raw data into a manageable, actionable recording. That file now contains the exact digital fingerprints of your problem, ready for analysis.
The goal isn’t just to capture traffic; it’s to capture the right traffic. A well-filtered recording is the difference between having a mountain of data and having a clear, actionable insight.
Practical Application Scenarios
Let’s ground this in a couple of real-world situations. Imagine your e-commerce platform’s search function has intermittent slowdowns. The issue is sporadic and impossible to replicate in staging.
Instead of guessing, you can deploy GoReplay to listen to your search microservice. You’d configure it to capture all requests sent to the /search endpoint that take longer than 500 milliseconds to respond. Within hours, you’ll have a collection of the exact queries causing the bottleneck.
Here’s another one. A critical API endpoint starts throwing 503 Service Unavailable errors, but only during peak load. Just set up GoReplay to capture all requests that receive a 503 response code. This recording becomes your most valuable asset. It contains the precise payloads and headers that trigger the failure, giving you everything you need to reproduce the issue in a safe environment.
This whole approach removes the guesswork. You’re no longer relying on incomplete logs or user reports. You have a perfect, byte-for-byte recording of the incident—all the raw material you need for an accurate diagnosis and a confident fix.
Replicating Network Issues in a Safe Environment
With a high-fidelity recording of your production traffic, the real investigation can finally begin. The best part? The pressure of a live incident is off. You can now bring the problem into your lab—a staging server or even a local development machine—where you can work methodically without breaking a sweat.
This is where GoReplay really shines. You can take that captured traffic file and replay it against your test environment, reliably reproducing the exact failure conditions on demand. Gone are the days of chasing intermittent bugs with little more than a hunch. Now, you can trigger the problem whenever you need to.
This completely changes the game. You’re no longer just reacting to problems with educated guesses. You’re dissecting them in a controlled setting, which is hands-down the fastest way to find a reliable fix.
Deconstructing the Failure with Controlled Replay
Just replaying traffic at full speed is a solid start, but the real magic happens when you start manipulating the replay to get deeper insights. The goal is to slow everything down, zoom in on the specific interactions causing the failure, and test your theories without affecting a single live user.
This gives you a level of control that’s just impossible to achieve in a live production environment. For a complete walkthrough on getting this set up, check out our guide on GoReplay setup for testing environments.
Here are a few techniques I’ve found incredibly effective:
- Slow Down the Traffic: Production load can be an overwhelming firehose of data. By replaying traffic at just a fraction of its original speed—say, 10% of the original rate—you can watch your system’s logs and metrics in slow motion. This makes it much easier to pinpoint the exact moment a service starts to struggle or a specific query hangs.
- Isolate Specific Sessions: Instead of replaying an entire capture file full of noise, you can use GoReplay to replay traffic from a single user session that experienced the error. This tight focus helps you trace one problematic journey from start to finish without any distractions.
The infographic below shows a simple workflow for using captured traffic to diagnose issues and validate fixes.
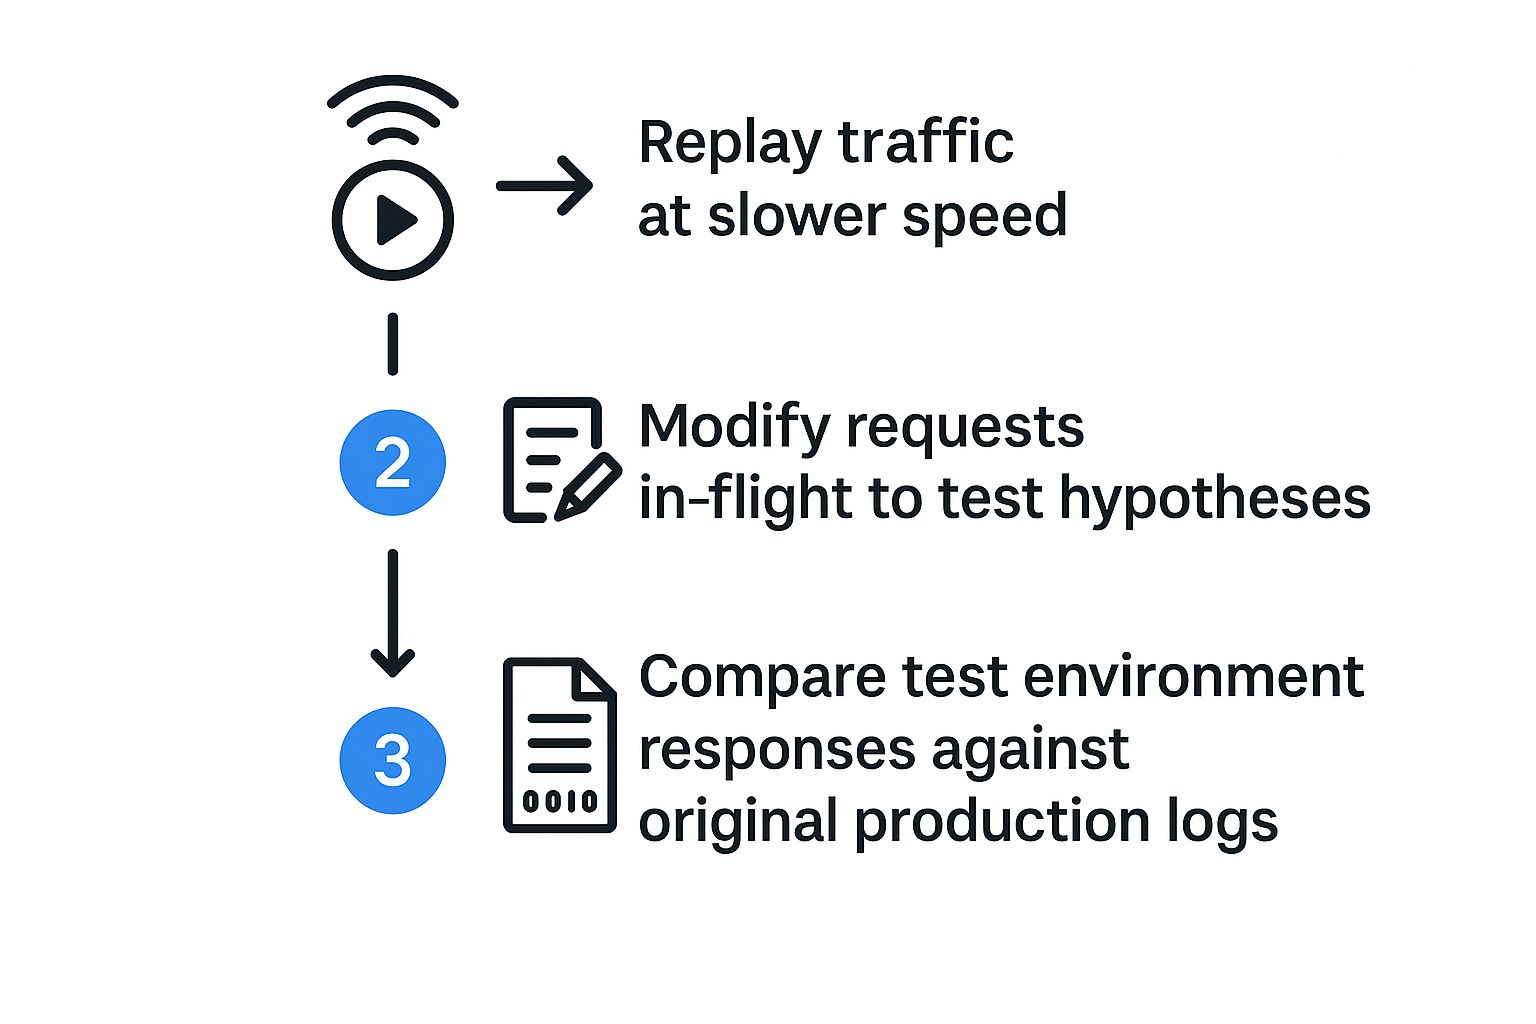
This process—slowing things down, modifying requests to test theories, and comparing results—is what turns troubleshooting from an art into a science.
GoReplay Troubleshooting Workflow Comparison
To see the difference in action, let’s compare the old way of troubleshooting with the proactive approach GoReplay enables.
| Troubleshooting Stage | Traditional Method | GoReplay Method |
|---|---|---|
| Problem Replication | ”Cannot reproduce.” Rely on logs and user reports. | Reproduce the exact issue on-demand with captured traffic. |
| Root Cause Analysis | Guesswork based on metrics and stack traces. | Isolate and slow down traffic to pinpoint the failure point. |
| Hypothesis Testing | Deploy speculative fixes to staging, hope for the best. | Surgically modify replayed requests to confirm the fix works. |
| Fix Validation | Push to production and monitor closely (finger-crossing). | Confirm the fix works against real traffic before deploying. |
The GoReplay method essentially creates a tight feedback loop, letting you iterate on a fix with real data until you’re absolutely certain it works.
Testing Your Hypothesis with Surgical Precision
Once you have a theory about the root cause, you need to prove it. Let’s imagine you suspect a specific, malformed request header is triggering a bug in your application code. With traditional methods, verifying this would be a nightmare of custom scripts or manual curl commands.
With GoReplay, it’s trivial. You can modify requests on the fly as they’re being replayed. This lets you surgically alter the traffic to see if your change fixes—or breaks—the system.
For instance, you could:
- Remove a problematic header: See if its absence prevents the error.
- Alter a payload value: Change a specific value in a JSON payload to see if it bypasses the bug.
- Redirect traffic: Forward a specific type of request to a newer version of a service to see if it handles it correctly.
The ability to manipulate replayed traffic is incredibly powerful. It lets you run dozens of “what if” scenarios in minutes, rapidly proving or disproving your theories without writing a single line of test code.
Validating the Fix with Confidence
The final step is the most satisfying one. When you first replay the problematic traffic against your staging server, you should see the exact same errors from production pop up. This is great news! It confirms you’ve successfully replicated the issue.
Now, deploy your potential fix to that same staging environment. Replay the exact same traffic again. If the errors are gone and the responses now match what you’d expect from a healthy system, you have extremely high confidence that your fix is solid.
This validation loop is what allows you to push fixes to production without just crossing your fingers and hoping for the best. You know it works because you’ve already tested it against the real-world conditions that caused the failure in the first place.
Using Captured Traffic to Bulletproof Your Fixes

Fixing a bug that’s currently on fire is a victory, but it’s a short-lived one. The real win is making sure that same class of problem never brings your system down again. This is where your troubleshooting efforts transform into a powerful strategy for building long-term network resilience.
The traffic you captured with GoReplay is much more than just a diagnostic tool—it’s a permanent asset. It’s a real-world stress test, a digital snapshot of the exact conditions that broke your system. By treating these recordings as part of your regression testing suite, you can turn every incident into a permanent improvement.
This proactive approach gets you out of the reactive firefighting cycle. Instead of just patching the latest hole, you’re actively reinforcing your entire infrastructure against future failures.
Validating Your Fix Against Real-World Scenarios
Once you’ve developed a fix in your staging environment, the most critical question is: will it hold up under actual production load? Replaying the incident-causing traffic against your patched system gives you a definitive answer. Think of it as your final exam before deployment.
When you replay the traffic, you’re looking for a clear before-and-after picture. The errors you saw before should be gone. The system should respond correctly and performantly. This step is non-negotiable for building genuine confidence.
It’s a far better approach than deploying a fix and just “hoping for the best.” You are proving, with empirical evidence, that your solution works under the exact conditions that previously caused it to fail.
Integrating Regression Tests into Your CI/CD Pipeline
The true power of this method is unlocked when you automate it. Your captured traffic files—the very ones that represent past outages—can be integrated directly into your Continuous Integration/Continuous Deployment (CI/CD) pipeline. This creates an automated safety net that catches problems before they ever see the light of day.
Imagine this workflow:
- A developer commits a code change to a critical microservice.
- The CI pipeline automatically builds and deploys the new version to a temporary test environment.
- GoReplay then runs, replaying a library of known “bad” traffic captures against the new code.
- If the replayed traffic causes old errors to reappear, the build automatically fails.
This process ensures that a regression—a bug you’ve already fixed—can never be accidentally reintroduced into production. Each incident strengthens your test suite, making your system progressively more robust.
The rising frequency of network outages makes this kind of automated validation more important than ever. From April to May 2025 alone, global network outages saw an increase, with 1,843 incidents reported. These disruptions, often hitting major cloud providers, stemmed from common culprits like configuration changes and software updates—exactly the kinds of issues this workflow helps prevent. For a deeper look, you can read more about recent cloud outages and their causes on CRN.com.
By turning incident traffic into automated regression tests, you transform every outage from a liability into a long-term asset. Your system doesn’t just recover; it learns and becomes stronger.
From Incident Response to Permanent Improvement
This shift in mindset is profound. Troubleshooting network issues is no longer just about recovery; it’s about continuous improvement. Each captured traffic file becomes a part of your system’s institutional memory, a permanent lesson learned from a past failure.
Over time, you build a comprehensive library of real-world failure scenarios. This library becomes your ultimate gatekeeper, a powerful suite of tests that any new code must pass before it’s allowed anywhere near production.
This is how you break the cycle of recurring outages. You stop solving the same problems over and over and start building a system that is fundamentally more stable and reliable. You’re not just troubleshooting; you’re bulletproofing.
Got Questions About GoReplay?
Jumping into a new tool, especially one that touches production traffic, always raises a few eyebrows. It’s smart to be cautious. When engineers start exploring GoReplay for troubleshooting, a handful of questions pop up almost every time. Let’s break them down and get you the real-world answers you need.
Will This Thing Slow Down My Production Environment?
This is the big one. And it should be. Protecting production is priority number one, always.
The short answer is no. GoReplay was built from the ground up to be as unobtrusive as possible. It works by passively listening to network traffic, like it’s getting a Bcc’d copy of every request. It never sits in the actual request path, so it adds zero latency. Think of it as a reporter on the sidelines, not a toll booth operator on the highway.
Of course, any running process uses some resources. GoReplay’s CPU and memory footprint is designed to be minimal, but you should always run it in a staging environment first to see for yourself.
For really high-traffic systems, you have even more control to dial it back:
- Traffic Sampling: Tell GoReplay to only capture a fraction of the requests, say 10% of the total volume.
- Endpoint Filtering: Zoom in on just the specific API endpoint or microservice you’re investigating.
This way, you get the evidence you need without putting any real strain on your production servers.
How Does It Handle Sensitive Data?
This is another critical point. You can’t just copy and paste production data riddled with personal info into a dev environment. That’s a security and compliance nightmare.
GoReplay gives you powerful middleware hooks to modify traffic on the fly, either as you’re capturing it or replaying it later. This is where the magic happens. You can write simple scripts to find and replace, hash, or totally remove sensitive data before it’s ever written to a file.
The ability to sanitize traffic in real-time is a game-changer. It means you can debug with realistic, production-grade data patterns without ever exposing user privacy or running afoul of regulations like GDPR.
Here are a few ways people use it:
- Removing Passwords: A quick rule finds any field named
"password"in a JSON payload and swaps its value with"[REDACTED]". - Hashing User IDs: Use a script to apply a one-way hash to a
userId, keeping it unique for analysis but impossible to reverse-engineer. - Anonymizing PII: Scrub names, addresses, and other Personally Identifiable Information (PII) and replace it with realistic-looking placeholder data.
These features give you total control, making your captured traffic both incredibly useful and completely safe.
Can It Work in a Microservices Architecture?
Absolutely. In fact, this is where GoReplay really shines. We all know how painful it is to troubleshoot an issue that snakes its way through three or four different services. The 500 error you see on the frontend could be coming from a database timeout buried deep in the stack.
You can deploy GoReplay listeners on the network interfaces of several microservices at once. This captures the entire conversation between them, preserving the exact timing and sequence of every request and response.
When you replay that traffic in your test environment, you’re not just replaying one service’s requests—you’re recreating the entire distributed transaction that caused the failure. You can finally see which service sent a malformed request, which one timed out, or which one returned that weird error code that started the whole cascade. It turns a frustrating multi-service mystery into a solvable puzzle.
Ready to stop guessing and start solving? With GoReplay, you can capture real-world traffic to reproduce bugs, validate fixes, and build more resilient systems. Get started with GoReplay today and transform how you troubleshoot network issues.