
How to Capture HTTP Traffic for Testing and Replay
You’re about to release a checkout change and you want proof it survives real traffic, not a tidy synthetic script. So you record production requests to replay into staging, and immediately hit the hard questions. The traffic’s encrypted, the headers contain live tokens, and half the requests depend on state your staging database doesn’t have.
That’s why learning how to capture HTTP traffic well is mostly a data handling job. Recording is the easy part. You need to remove what shouldn’t be stored, keep what replay correctness depends on, and prove the result is trustworthy before it touches a test environment.
Pick the Right Capture Point for Your Traffic
Say your team wants to replay checkout traffic into staging, but requests are encrypted at the load balancer. A packet capture on the host gives you timing and volume, not readable requests. Your capture point decides what you can read at all.
The trade-off is consistent. The closer you record to the application, the more plaintext you can see and the more load and risk you add to live traffic. Move further away and you’re safer, but you lose bodies, headers, and session context.
What Each Point Can Actually Read
Capture points and what each one can read
| Capture point | Plaintext visible | Main cost | Best for |
|---|---|---|---|
| Reverse proxy or gateway after TLS termination | Yes | One extra hop on live traffic | Shadow tests and replay sets |
| Instrumented client | Yes | Code access and app changes | Reproducing a client-side bug |
| Staging recorder for scripted journeys | Yes | Needs a scripted workflow | Regression runs without production exposure |
| Load balancer mirror | Up to the balancer’s TLS termination | Mirror configuration on the balancer | Edge traffic when you control the balancer |
| Host-level packet capture | No, encrypted payloads only | Captures metadata and timing, not bodies | Timing and volume analysis, not content replay |
A reverse proxy after TLS termination is usually the practical choice for replay because plaintext is already there for legitimate reasons. An instrumented client gives you the exact requests the app sent, but only if you can change and redeploy that client. A staging recorder avoids production entirely, though scripted journeys miss the messy inputs real users produce.
I wouldn’t use host-level packet capture for replay content. It’s useful when you need connection timing or byte counts, and misleading when you expect it to reconstruct a checkout flow.
Two Checks Before Production Recording
Two gates must pass before you record anything live. First, get written authorization that names the hosts, paths, time window, and who may access the output. Second, run a short overhead test on a non-critical host and confirm the recorder doesn’t push CPU, memory, or latency past your agreed baseline.
Keep that approval and test result with the capture metadata. Teams that maintain auditable activity records for internal tools find it far easier to answer who approved a recording and who opened it later.
Choose the plaintext point with the least production exposure, and write the scope down before you press record.
If no point gives you plaintext without unacceptable exposure, don’t force production capture. Use scripted staging journeys instead and accept narrower coverage.
How to Capture HTTP Traffic Step by Step
The workflow starts before the recorder runs. How to capture traffic safely is a sequence where authorization and redaction come first, and recording comes third.
-
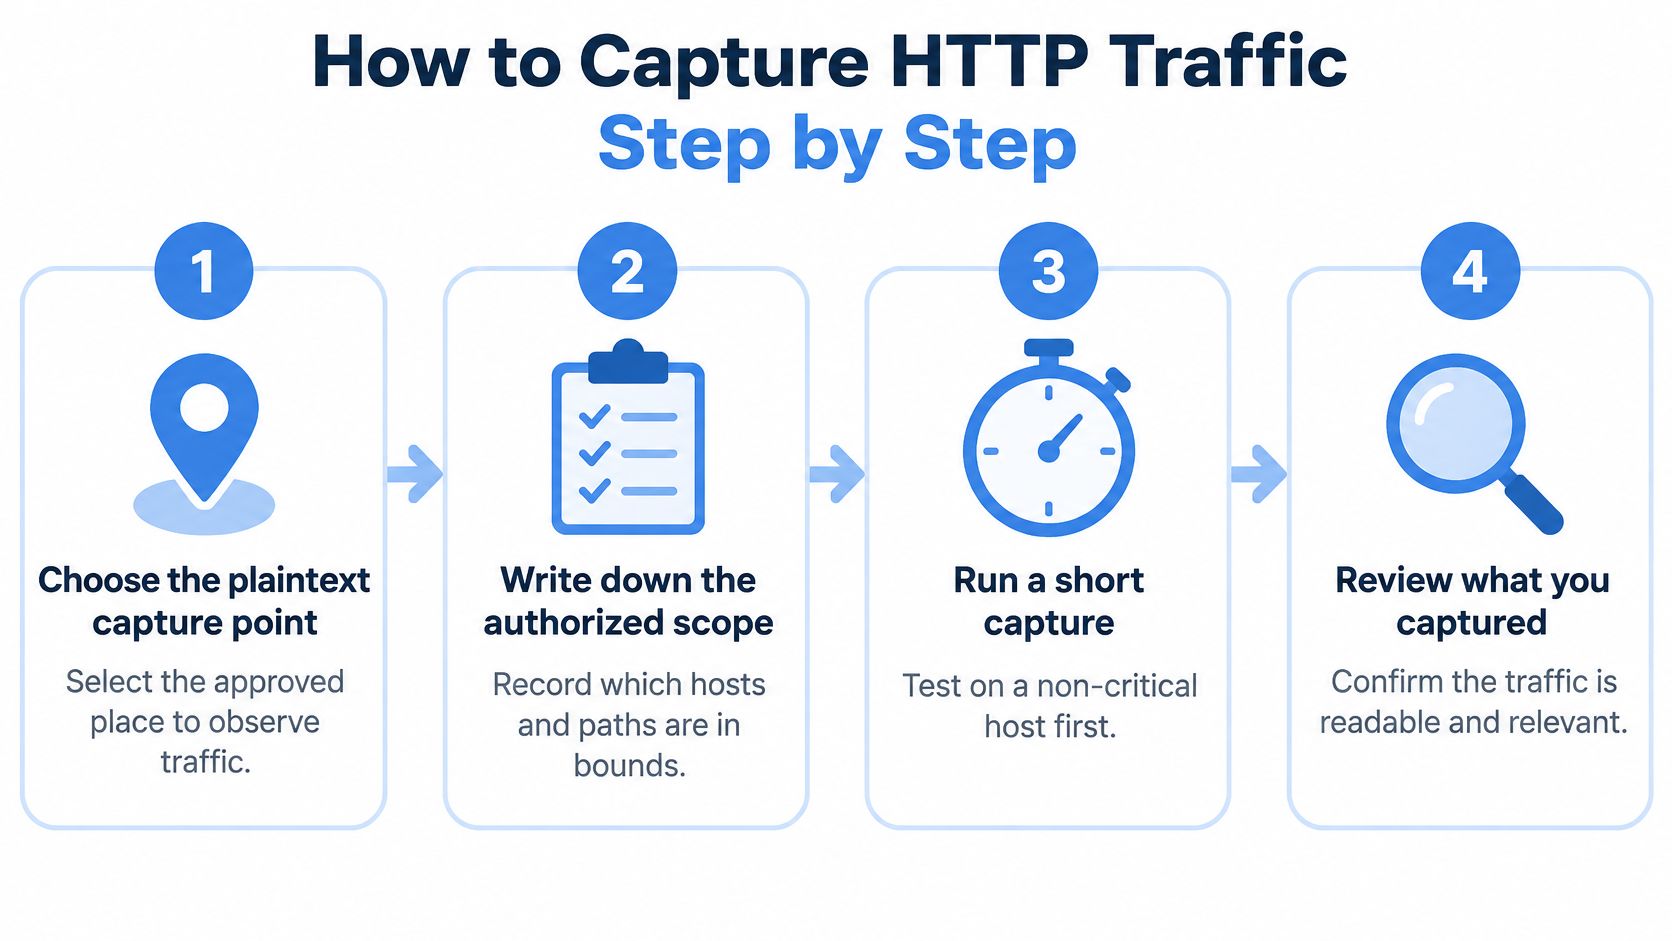
Choose the plaintext capture point and write the scope. Pick the point from the comparison above and record which hosts and paths are in bounds. This is the first step of the workflow, choose a suitable plaintext capture point, record the requests needed, and measure capture overhead. Anything outside that written scope is out, even if the tool can see it.
-
Run a short capture on a non-critical host. Measure CPU, memory, and added latency on the live path against a baseline taken without the recorder. Stop if the live path slows beyond what you agreed. A capture that degrades production has already failed, whatever it records.
-
Load the allow-list and redaction rules before any write. Configure filtering so credentials, cookies, and personal data never reach disk in raw form. Redacting a stored file later means the sensitive data already existed in storage, backups, and possibly logs.
-
Start the recorder in a time-boxed window. Point it at the chosen interface and port, for example with
sudo gor --input-raw :8080 --output-file capture.goron the plaintext leg. Cover one full business cycle, such as a peak hour and a quiet hour, so the sample isn’t all one traffic shape.
Inspect, Clean, and Label the Sample
-
Stop and inspect a sample before trusting the file. Check that methods, normalized routes, and status codes look right, and that bodies appear where you expect them. If everything reads as one route or bodies are empty, you recorded at the wrong point.
-
Remove unsuitable requests and rewrite for an isolated target. Drop health checks, bot traffic, and admin calls, then rewrite the sample for an isolated target with controlled external side effects. If you generated any journeys with a browser instead of recording live traffic, comparing browser automation options for analytics teams helps you pick a tool that drives realistic sessions rather than single page loads.
-
Save the cleaned file with a self-describing name. Include the date, scope, and capture point so anyone can repeat the run or audit it months later. A file called capture2.gor tells the next engineer nothing.
Healthy capture: Steady request counts, no 5xx spike caused by the recorder, and a file that replays without parse errors.
If the sample inspection in step 5 looks wrong, fix the capture point or filter and record again. Don’t try to repair a structurally broken capture during replay.
Redact Sensitive Fields Before Anything Is Stored
Capture only what the test needs. An allow-list approach starts from keeping nothing, then adds each field the replay requires. Recording everything and scrubbing later is backwards, because the unscrubbed version is the security incident.
The OWASP Secure Cloud Architecture Cheat Sheet recommends removing, masking, hashing, or encrypting credentials, passwords, authorization headers, cookies, access tokens, encryption keys, payment data, and unnecessary personal information rather than storing them directly. It also supports retaining the timestamp, HTTP method, normalized route template, status code, latency, request ID or trace ID, and a non-secret actor or session identifier.
Field Rules for Captured HTTP Data
| Field | Keep or drop | Handling before storage |
|---|---|---|
| Timestamp, method, status code, latency | Keep | Store as recorded |
| Route path | Keep | Normalize IDs into templates such as /orders/{id} |
| Authorization header | Drop | Never store |
| Cookies and access tokens | Drop | Never store; substitute test credentials at replay |
| Session or actor identifier | Keep as hash | Salted hash so requests still group by session |
| Request and response bodies | Keep metadata only | Store full bodies only when the test needs them |
| Personal and payment data | Drop | Remove or tokenize with a deterministic token |
Route normalization matters more than people expect. Without templates, every user ID becomes a separate route, aggregation gets expensive, and you can’t tell whether two requests exercised the same code path. A salted hash for session IDs preserves grouping without storing a credential-bearing value, and a propagated correlation ID lets you reconstruct a journey across services.
Apply sanitization in a fixed order. Define the allow-list, normalize routes, validate fields from untrusted sources, strip carriage returns, line feeds, and delimiters that could inject into logs, apply deterministic redaction, then enforce retention and access limits. Our guide to protecting sensitive data in captured traffic covers the masking mechanics in more detail.
The common failures are capturing all headers by default, logging raw bearer tokens, and keeping full bodies when only metadata is needed. Each one turns a testing artifact into a credential repository. The redacted file still has to replay, though, so preserve type, length, and correlation where the test depends on them rather than blanking values blindly.
Handle Encrypted Traffic Under Authorization
A request to “just capture the production traffic” usually means someone wants TLS plaintext they are not authorized to see. The honest answer is to move the capture point, not to break the encryption. Record where you are authorized to see plaintext: an instrumented client, a reverse proxy, or a test gateway.
Capture after TLS termination and isolate the replay target, because the point you choose determines what is visible and what stays protected. The OWASP testing guidance on sensitive information sent via unencrypted channels treats any sensitive exchange over plaintext as a finding to verify, and that check belongs in your test scope since capture exercises often surface a stray unencrypted endpoint nobody owned. When decryption is required for diagnosis, TLS key logging through SSLKEYLOGFILE records session secrets for later analysis, but only inside the authorized scope and only for the session that needs it.
The Authorized Decryption Workflow
- Confirm authorization and test scope in writing before anything is enabled.
- Capture metadata and encrypted payloads by default, which answers timing and volume questions without touching content.
- Enable SSLKEYLOGFILE only for the isolated diagnostic session, never as a standing setting.
- Restrict the key file to the analysis user with least-privilege permissions.
- Decrypt only inside a protected analysis environment, not on a laptop that syncs to shared storage.
- Apply the field rules before exporting any fixture, so decrypted material is redacted before it becomes test data.
- Securely delete keys and raw captures after validation.
For a side-by-side look at endpoint approaches, see this comparison of capturing HTTPS on the server with different tools.
A decrypted capture is trustworthy only if you can name which fields survived, which were dropped, and confirm the keys no longer exist. The failures are predictable: key logging left enabled in production, the key file stored beside the captures it decrypts, recording that drifts outside the agreed scope, or the assumption that encryption still protects data once plaintext exists at the endpoint. It does not. The moment you can read it, protecting it is your job.
Fix Captures That Replay Incorrectly
The classic symptom is a wall of 401 responses in replay when the original capture was full of 200s. The capture isn’t broken. It’s incomplete, because a recording doesn’t carry the state the original requests depended on, including valid credentials, database rows, downstream API behavior, and timestamps.
Treat each failure as a missing dependency rather than a tooling glitch. Substitute generated test credentials at replay for the 401s, since you correctly dropped the actual ones. For 404s on resources like /orders/4821, the ID came from an earlier response in the session, so extract it during replay or mock the service that issued it.
Replay Symptoms, Causes and Fixes
| Symptom | Likely cause | Fix |
|---|---|---|
| Failures only in some runs | Requests reordered by scheduling | Preserve causal order within each session |
| Same status code, wrong data | Target state differs from production | Reset test data before each run and compare application state |
| Calls to real partners or payments | External services reached from the test host | Mock or disable external side effects |
Order matters because sessions are causal chains. A cart update replayed before the cart creation fails intermittently depending on scheduling, which is why flaky replays often trace back to per-session ordering rather than the application. Keep requests from one session in sequence even when you parallelize across sessions.
State mismatch is subtler. The replay returns 200 with different data because your target database holds different products, prices, or account balances than production did. Reset test data to a known fixture before each run so differences mean something.
A successful replay alone does not establish correctness.
That point shapes how you judge results. The third step of a sound workflow measures performance and compares responses and application state against expected behavior. Status codes matching while balances diverge is a failed test that looks green.
The evidence for modeling dependencies is strong. In a 2022 industrial study of production-traffic replay at Ant Group, researchers automatically identified dependencies and generated mocking points across hundreds of microservices, and the average replay success rate reached 99%. That result came from modeling external dependencies rather than replaying naively, which is exactly the work the fixes above describe.
Select Representative Traffic for Replay
Capturing everything is a volume trap. You faithfully reproduce redundant calls, third-party overhead, and browser artifacts, then wonder why the replay tells you nothing about the failure paths that matter. Selection is where capture becomes a data-handling task: decide what enters the corpus, what gets dropped on arrival, and what evidence proves the result is trustworthy before any of it reaches a test environment.
The visual below shows selective replay working from recorded request logs rather than an undifferentiated stream.
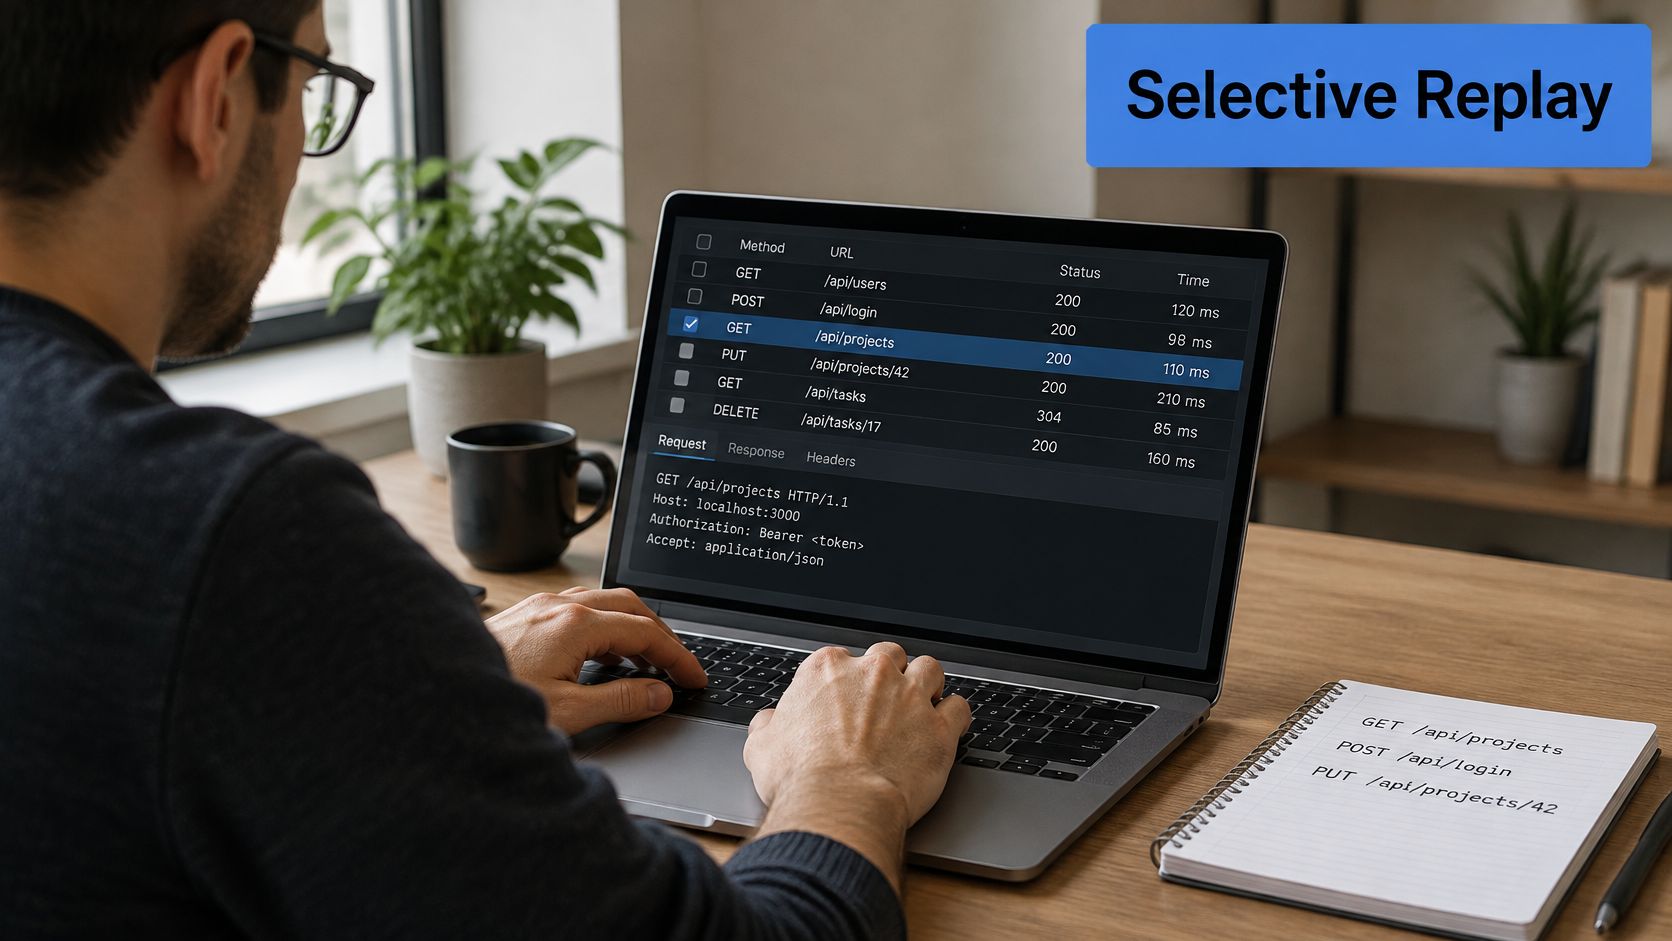
Raw traffic often contains redundant API calls, cache-unfriendly requests, and third-party overhead that you neither own nor want to enshrine as a test. Much of the volume isn’t behavior worth keeping.
Stratify instead. Sample by user journey, endpoint criticality, status code, geography, device, latency band, and failure state. Label first-party and third-party requests separately so you can exclude what you don’t control, and preserve causal ordering and session identity inside each stratum. Removing a request is fine; removing it halfway through a session and leaving its dependents orphaned is not.
A practical split looks like this. Keep every write to checkout because those requests are rare and consequential. Sample catalog reads at a fixed rate because they’re abundant and similar. Keep all 5xx responses so real failures are guaranteed a place in the test set instead of being diluted by healthy traffic.
The following walkthrough shows captured traffic being shaped into a replay set.
Check representativeness before you trust the corpus. Compare the request mix in your capture against the production mix for the same time window, route by route and status by status. If proportions differ widely, reject the corpus and resample. A biased sample produces confident, wrong conclusions, and it does so without warning: every response can replay cleanly while the workload itself misrepresents what production sends.
A filtered corpus is only as reliable as its maintenance. Between September 2020 and August 2021, the FAUSTA reliability system at WhatsApp generated and analyzed traffic for automated dynamic testing and identified 1,876 unique reliability issues, with a 74% fix rate. Treat your capture set as a living asset: version it alongside schema changes, retire stale sessions, and resample after every meaningful shift in traffic shape.
Run Your First Safe Replay Test
Don’t replay on optimism. Run a go or no-go checklist first, and treat any failed item as a stop.
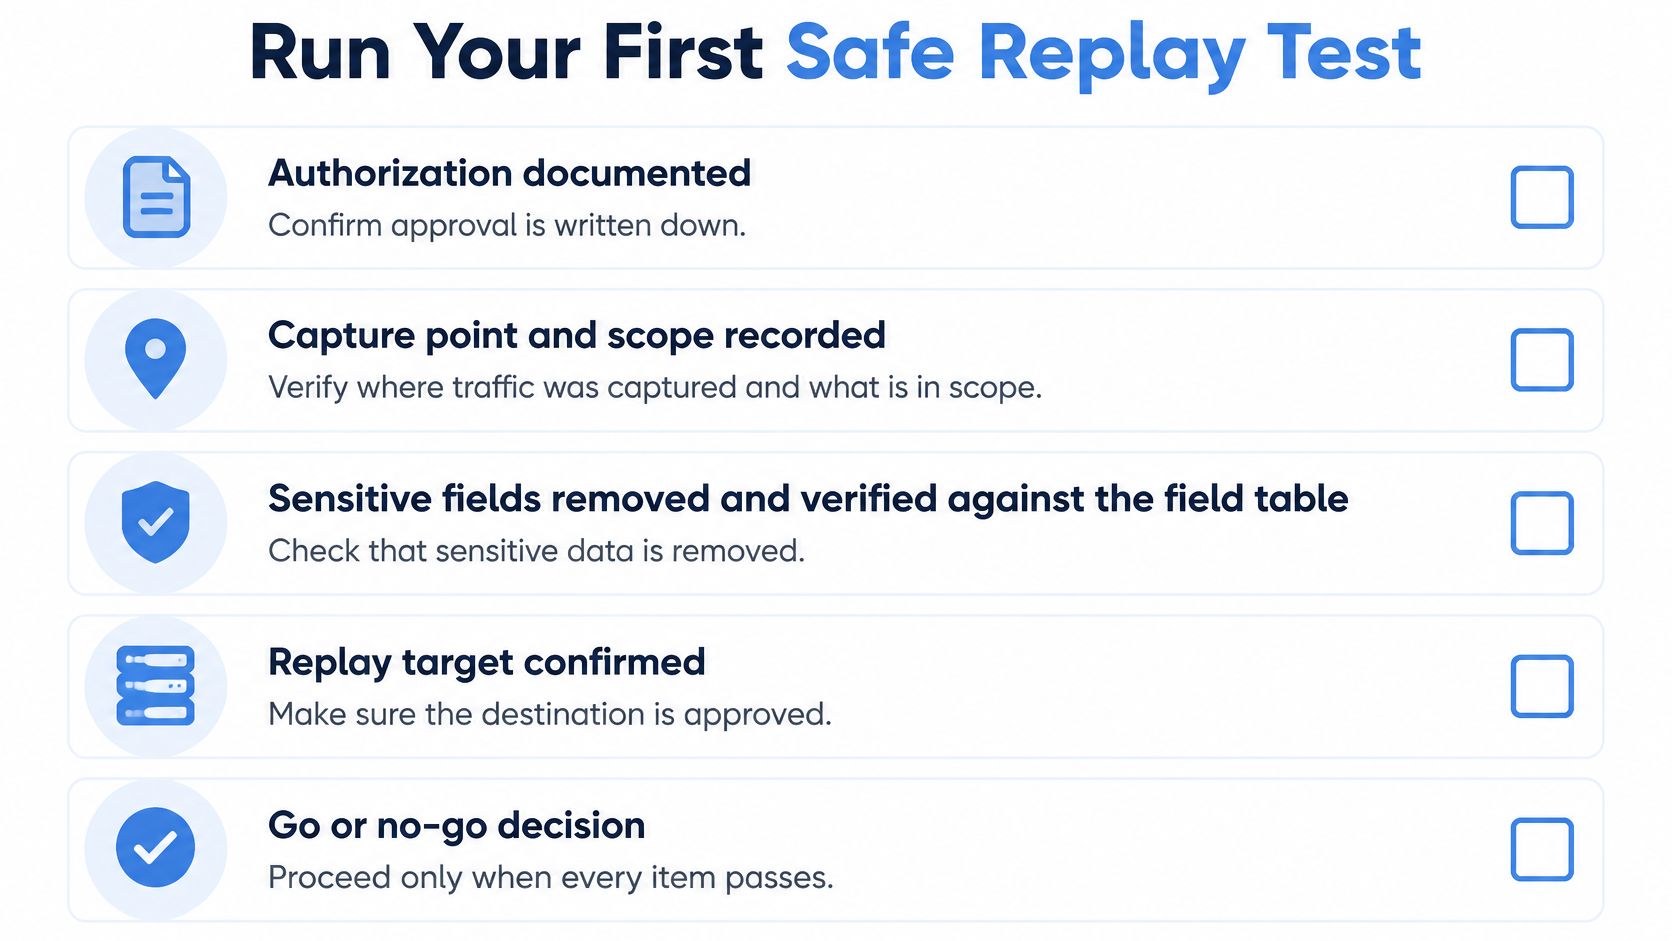
- Authorization documented: Written approval names the scope, window, and who may access the data.
- Capture point and scope recorded: You can state where traffic was recorded and what was in bounds.
- Sensitive fields removed and verified: A sample inspection confirms the field rules were applied, not just configured.
- Replay target isolated: External side effects are off, so no real payments, emails, or partner calls can fire.
- Test data reset and credentials substituted: The target holds known fixtures and generated test credentials.
- Baseline set: You have expected latency and error rate figures to compare against.
That last verification step deserves rigor, and ThreatExploit AI’s API security testing guide is a useful reference for checking that your test traffic can’t reach or expose anything outside the intended target.
The First Run
Replay the filtered sample at reduced speed against the isolated target. Watch latency, errors, and resource limits as it runs, then compare responses and application state with expected results. Our load testing feature replays a captured workload at a chosen speed and measures latency, errors, and resource limits, while the debugging and reproduction feature lets you inspect a captured request, replay a filtered sample, and compare the target response with expected behavior.
The Open Source edition includes HTTP traffic capture and replay, request filtering, rewriting and middleware, a command-line interface, and community support, which covers this entire first run. Start there rather than building capture plumbing yourself.
Then decide. If the sample replays cleanly and state matches, increase speed in steps and watch where latency or errors bend. If requests fail, work through the symptom fixes for credentials, ordering, state, and external calls. If the sample itself looks unrepresentative, go back to stratified selection and rebuild the corpus instead of tuning the replay to fit bad input.
I would rather see a small, verified, representative replay pass than a huge raw capture run once and believed. The small one you can repeat before every release, and repeatability is what turns captured traffic into a regression test instead of an artifact.
Capture your next release candidate’s traffic the safe way, with redaction before storage, session-aware replay, and an isolated target you control. GoReplay records live HTTP traffic and replays it into testing environments so you can catch failures before your users do. Start with the open source edition, run your first filtered replay at reduced speed, and build from there.