How to Calculate Throughput: Easy Step-by-Step Guide

When you get right down to it, calculating throughput is all about measuring the rate of successful work your system completes over a specific period. This single metric, usually expressed as Units per Time, is arguably the most honest indicator of your system’s real-world output. It doesn’t matter if you’re processing e-commerce orders or handling API requests—throughput tells you what’s actually getting done.
What Throughput Really Tells You About Performance
Before we jump into the formulas, it’s critical to understand what throughput truly represents. It’s so much more than a number on a dashboard; it’s a direct reflection of your system’s health and efficiency. Think of it as the ultimate productivity score.
The concept is universal. The basic formula is simply the total units processed (I) divided by the time it took (T), giving you a rate (R = I/T). Let’s say a coffee shop serves 300 coffees over a 12-hour day. Its throughput is 25 drinks per hour. This same simple logic applies to any digital system, from a manufacturing line to a complex software stack. For a few more examples, you can see how this concept is applied across industries on indeed.com.
Throughput vs Other Key Metrics
It’s incredibly common for people to mix up throughput with related terms like bandwidth and latency. They’re all connected, for sure, but they measure very different things. Nailing down these distinctions is the first step toward any meaningful performance analysis.
To help clear things up, let’s take a look at how these core metrics stack up against each other.
Core Performance Metrics At a Glance
| Metric | What It Measures | Example Analogy |
|---|---|---|
| Bandwidth | The maximum theoretical capacity of a system. | The number of lanes on a highway (e.g., a 3-lane highway). |
| Throughput | The actual rate of successful data transfer. | The number of cars that actually get through that highway in an hour. |
| Latency | The time delay for a single data packet to travel. | The time it takes for one car to travel from Point A to Point B. |
While bandwidth gives you the “best-case scenario” and latency tells you about individual speed, throughput is what really matters for understanding overall system performance under real-world conditions. It accounts for all the messy stuff like traffic jams (bottlenecks) and accidents (errors).
A system can have massive bandwidth and super-low latency but still suffer from terrible throughput because of a single, hidden bottleneck. Your job is to find that bottleneck.
Grasping this difference is fundamental. If you only focus on increasing bandwidth without looking at your actual output, you’ll likely end up with misleading conclusions and wasted effort. To learn more about how this applies in a software context, check out our comprehensive guide on software performance testing.
By learning how to calculate throughput, you’re really learning how to get a clear, unfiltered view of what your system is genuinely capable of.
Getting a Grip on Throughput with the Right Formulas
Now that we’ve covered the “what” of throughput, let’s get into the “how.” Measuring it isn’t about getting lost in complex mathematics; it’s about applying a simple, powerful idea to the right situation.
The most fundamental formula is beautifully straightforward.
Throughput = Total Units / Time
This is the bedrock of any performance analysis. In this equation, “Units” can be anything that matters to your system—API requests, e-commerce orders, data records, or even user sign-ups. “Time” is just the period you’re measuring over, whether it’s seconds, minutes, or a full day.
Putting the Basic Formula to Work
Let’s ground this with a real-world example. Imagine you run an e-commerce site. During a one-hour flash sale, your system successfully processed 1,800 orders.
Here’s the breakdown:
- Total Units: 1,800 orders
- Time: 60 minutes
- Calculation: 1,800 orders / 60 minutes = 30 orders per minute
That number—30 orders per minute—is your throughput. Simple, right? It gives you a clear baseline for performance. If your next flash sale only handles 20 orders per minute, you know immediately that something’s off and it’s time to investigate.
This applies just as well to data processing. If your pipeline chews through 500,000 log entries in a 24-hour period, your daily throughput is half a million records. If you need a more granular view, that breaks down to an average of about 5.78 records per second.

A Different Angle: Inventory and Flow Time
While the Units / Time formula is the go-to for digital systems, there’s another useful perspective that comes from the manufacturing world, where throughput has long been a key measure of efficiency. This approach looks at inventory and how long it takes to move through a process.
Throughput = Inventory / Flow Time
A furniture maker, for instance, might have an inventory of 100 chairs that take an average of 10 days to build. Their throughput would be 10 chairs per day (100 chairs / 10 days). This kind of quantitative insight is gold for managers trying to pinpoint production bottlenecks. You can dive deeper into this kind of analysis over at the Corporate Finance Institute.
This concept translates surprisingly well to software development. Just think of “Inventory” as the number of tickets in your team’s “In Progress” column and “Flow Time” as the average time a ticket sits there. A quick calculation can reveal the true velocity of your development cycle.
Looking Beyond the Basic Throughput Numbers
A simple calculation gives you a starting point, but the real story of your system’s performance is often hidden in the details. A high throughput number can be dangerously misleading if it doesn’t account for the quality of the work being done.
Imagine a system processing 1,000 requests per second. On the surface, that sounds fantastic. But what if 20% of those requests are returning errors? Your actual successful throughput is only 800 RPS. Ignoring the error rate gives you a completely false sense of security and papers over a significant underlying problem.

This is exactly why moving from basic monitoring to true system optimization means analyzing the quality of your throughput, not just the raw quantity.
Throughput without context is just a number. Good throughput is successful, error-free work completed within an acceptable timeframe.
Analyzing the Data Behind the Number
To get a truly accurate picture, you need to dig deeper into the statistical distribution of your data. A simple average can hide critical performance issues that only become visible when you look at how the data is spread out.
This isn’t just a theory. Performance testing in computing systems often pulls from statistical analysis to get a richer understanding. For instance, research from York University on human-computer interaction highlights how properties like data distribution, skewness, and normality testing are used to evaluate throughput. This approach treats throughput as a variable influenced by the consistency of performance, not just the average rate. You can find more about this analytical approach on Yorku.ca.
Adopting this way of thinking helps uncover subtle yet impactful issues. Your average response time might look great, but a closer look could reveal that 5% of your users are experiencing frustratingly long delays. These outliers are often the canaries in the coal mine—early warning signs of bigger problems.
To get the full story, start tracking these metrics alongside your main throughput number:
- Error Rate: What percentage of operations actually failed?
- Success Rate: The flip side—how many operations completed successfully?
- Latency Percentiles (p95, p99): What response time did the slowest 5% or 1% of your users experience?
By combining these data points, you build a far more accurate and actionable understanding of your system’s real-world performance. This holistic view is essential when you’re learning how to calculate throughput in a way that truly matters.
How to Measure Throughput in a Live Environment
Theoretical formulas are a great starting point, but let’s be honest—they don’t account for the beautiful chaos of a live production environment. The real challenge isn’t just calculating a number; it’s measuring the actual throughput of a complex system without disrupting your users. To do that, you have to move from estimation to direct observation by safely analyzing real-world traffic.
This is where traffic shadowing tools come into the picture. A fantastic open-source example is GoReplay. It works by capturing your live HTTP traffic and replaying it to a test or staging environment. This shadowing process lets you see exactly how your system behaves under authentic load, giving you a true measure of its performance.
The whole process, from choosing your tool to crunching the final numbers, is pretty straightforward when you break it down.
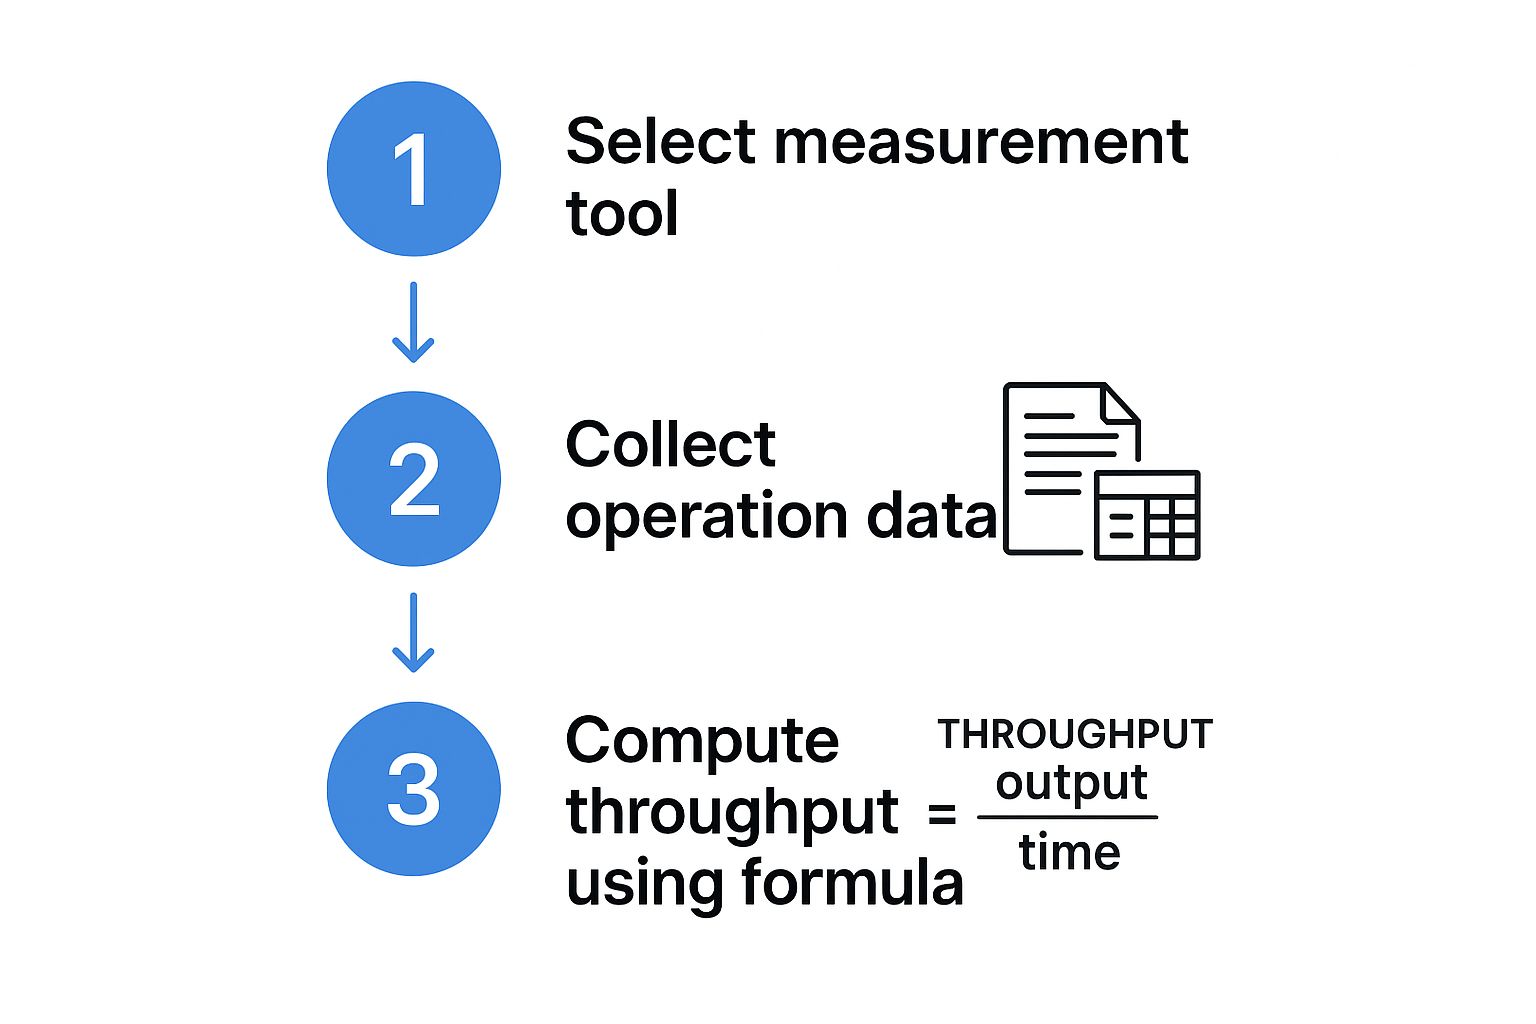
As you can see, the formula is the final step. The magic happens when you gather real data first.
Gaining Actionable Data with Traffic Shadowing
The entire point of this approach is to get actionable data. You want to find your system’s true performance ceiling—the point where it will break—long before your customers do.
By shadowing production traffic, you can:
- Pinpoint Bottlenecks: See which services start to drag their feet under real-world request patterns.
- Validate Changes: Deploy new code to your staging environment and hammer it with real traffic to see how it holds up before a full release.
- Get Accurate Load Tests: Ditch the synthetic tests that only approximate user behavior and use the real thing instead.
The most accurate way to understand your system’s limits is to test it with the exact load it will face in production. Shadowing makes this possible without risking a single user’s experience.
This strategy transforms performance tuning from a reactive, post-incident scramble into a proactive, data-driven process. To get a better feel for how GoReplay pulls this off, you can see how to measure throughput in more detail on their blog.
From Theory to Proactive Performance Tuning
Once you have a steady stream of real traffic hitting your test environment, you can finally apply the throughput formulas we talked about earlier. Now, however, you’ll be calculating based on the number of successful requests your test environment actually handles over a set period.
This is what bridging the gap between theory and reality looks like. It’s how you move from just knowing how to calculate throughput to using that knowledge to build more resilient, high-performing applications. You find and fix issues long before they ever see the light of day in production.
Common Mistakes in Throughput Calculation
Figuring out throughput sounds simple enough, but it’s a minefield of common mistakes. I’ve seen teams chase their tails for weeks, all because they started with bad measurements. These slip-ups lead to wasted resources, over-engineered solutions, and performance problems that just won’t go away.
A simple miscalculation can convince you to throw money at expensive hardware you don’t need, all while the real software bottleneck sits there, silently frustrating your users. Let’s walk through the traps I see most often so you can be sure your data is actually telling you the truth.
Confusing Throughput with Bandwidth
This is the classic one. So many people use these terms interchangeably, but they are worlds apart.
Bandwidth is your theoretical maximum—think of it as a freshly built, empty three-lane highway. Throughput, on the other hand, is the actual number of cars that make it from point A to point B in an hour, factoring in traffic jams, accidents, and slowdowns.
It’s easy to celebrate a high-bandwidth connection while completely missing the fact that your throughput is terrible. You might have a beefy 1 Gbps network pipe (your bandwidth), but if a single slow database query is holding everything up, your actual throughput might be just a trickle of requests per second. Always, always measure what you actually deliver, not what you could deliver in a perfect world.
A system’s performance is always defined by its bottleneck. Focusing on bandwidth while ignoring a software limitation is like widening a highway leading into a one-lane tunnel—it won’t make traffic move any faster.
Ignoring Peak vs. Average Loads
Relying on an average throughput calculated over a long period—say, 24 hours—is another recipe for disaster. That number lies by omission.
An e-commerce site might see an average of 10 orders per minute over a full day. Sounds great, right? But that average smooths over the terrifying reality. During a two-hour flash sale, the demand could rocket to 150 orders per minute. If your system was built to handle the average and can only process 50, it’s going down. Hard. You’re left with lost sales and a mob of angry customers.
To get a picture that reflects reality, you have to dig deeper:
- Hunt for the peaks: Pinpoint the exact times your system is under the most stress. Analyze your throughput during those windows.
- Look at different time slices: Don’t just look at the 24-hour view. Compare hourly, daily, and weekly throughput to spot the real patterns in user behavior.
- Use percentiles: Stop looking at averages. Metrics like p95 or p99 latency will show you what the worst user experiences look like during those traffic spikes.
This granular approach ensures you’re building a system for the real world, not for a fantasy land where traffic is always perfectly even.
Frequently Asked Questions About Throughput

Even after you’ve wrapped your head around the basics, a few common questions always seem to surface when you start calculating throughput in the real world. Let’s tackle them head-on so you can apply this knowledge with confidence.
What Is the Difference Between Throughput and Bandwidth
This is easily the most common point of confusion, but the distinction is critical.
Think of bandwidth as your system’s maximum theoretical capacity—it’s a brand new, empty three-lane highway. Throughput, on the other hand, is the actual rate of successful work. It’s the number of cars that really get through that highway in an hour, which is often slowed down by traffic jams, accidents, and other bottlenecks.
How Can I Improve My System’s Throughput
Improving throughput always, always starts with finding the bottleneck. You can’t fix what you can’t find. The culprit could be anything—a sluggish database query, not enough server memory, an inefficient algorithm, you name it.
To actually move the needle on performance, you have to:
- First, accurately measure your current throughput under a realistic load.
- Next, pinpoint the weakest link holding everything back.
- Finally, focus all your optimization efforts on that specific component.
Here’s the hard truth: fixing anything other than the primary bottleneck is a waste of time and won’t improve your overall throughput one bit.
What Is a Good Throughput Rate
This is a trick question because there’s no single right answer. “Good” is completely contextual.
For a massive e-commerce site, a “good” rate might be thousands of transactions per minute. But for an internal data processing tool that runs overnight, a few complex jobs per hour could be fantastic.
The only ‘good’ throughput rate is the one that meets your system’s goals and your users’ expectations.
The real key is to define what success looks like for your application and its users. Establish that benchmark, and then measure your performance against that specific target.
We’ve covered some of the most persistent questions that come up when discussing system performance. Here are a few more, broken down for quick reference.
| Frequently Asked Questions About Throughput |
|---|
| What is the difference between throughput and bandwidth? |
| Bandwidth is your system’s maximum theoretical capacity, while throughput is the actual rate of successful work. Think of bandwidth as a three-lane highway (potential) and throughput as the number of cars that actually get through in an hour, which can be slowed by traffic jams (bottlenecks). |
| How can I improve my system’s throughput? |
| Improving throughput always starts with finding the bottleneck. It could be a slow database query, insufficient server memory, an inefficient process, or a network limitation. Once you’ve accurately measured your throughput and identified the weakest link, you can focus your efforts on optimizing that specific component. |
| What is considered a ‘good’ throughput rate? |
| There’s no universal ‘good’ number. It’s entirely dependent on your goals. For a high-traffic e-commerce site, ‘good’ might be thousands of transactions per minute. For an internal data processing tool, it might be a few jobs per hour. The key is to define what success looks like for your specific system and users, then measure against that benchmark. |
Hopefully, these answers clear up any lingering confusion and give you a solid foundation for your own performance analysis.
Ready to stop guessing and start measuring your system’s true performance? With GoReplay, you can safely capture and replay live traffic to identify bottlenecks and validate changes before they ever impact your users.