Understanding What Throughput Really Means in Practice

Let’s be honest, the word “throughput” can sound a bit jargony. But if your system processes anything, understanding throughput is essential. It’s the core of efficiency. Think of a water pipe: how much water can flow through in a set time? That’s throughput in a nutshell. And trust me, I’ve seen how understanding this concept can prevent performance nightmares.
Imagine a flash sale on an e-commerce site. Thousands of customers rush to buy limited items. The website’s throughput, measured in transactions per second, determines how many sales actually happen. Low throughput equals lost sales and unhappy customers. High throughput? Happy customers and a successful sale. This is why measuring throughput correctly is key to optimization. It’s not just about speed; it’s about capacity and smooth operation.
Throughput vs. Other Metrics
People often confuse throughput with latency and bandwidth. Latency is how long it takes one thing to go through the system. Bandwidth is the potential capacity—the size of the pipe, so to speak. High bandwidth doesn’t guarantee high throughput. Think network congestion or slow processing. Measuring throughput helps pinpoint these bottlenecks, while bandwidth only shows theoretical capacity. You might find this helpful: Mastering Throughput Performance Testing.
Real-World Throughput
Throughput applies across many industries. In shipping, it’s essential for understanding port efficiency. The Bureau of Transportation Statistics (BTS) uses measures like cargo tonnage and container TEUs (Twenty-Foot Equivalent Units) to assess this. These metrics reveal trade growth and port challenges. In 2015, U.S. ports handled over 1.7 billion tons of cargo. That’s a lot of stuff! Discover more insights on port throughput.
In manufacturing, throughput is how many products are made per hour. In software, it’s often requests per second or data processed per minute. Figuring out which “units” you’re measuring is the first step. This makes throughput relevant to your situation and helps you define what it actually means for your goals.
Choosing the Right Metrics That Drive Real Results

I’ve seen it time and time again: folks get bogged down measuring everything under the sun. They end up with dashboards full of pretty graphs that don’t actually tell them anything useful. In my experience, effective throughput measurement is all about focusing on the metrics that truly align with your business goals. It’s about getting actionable insights, not just numbers.
For example, imagine you’re trying to improve the user experience on your e-commerce site. Just tracking server bandwidth won’t tell you much about how happy your customers are. What you really need to measure is completed transactions per minute. That metric gives you a direct view into how well your system is handling actual user interactions.
Identifying Key Performance Indicators
There’s a big difference between vanity metrics and real performance indicators. Vanity metrics might look impressive on a report, but they don’t actually inform your decisions. Requests per second might seem important, but if a bunch of those requests are failing, your actual throughput is suffering. Something like Boosting Application Performance Load Testing might be helpful here.
Think, too, about the units you’re using. Bits per second is essential for network performance, while messages processed per second is key for a message queue. Choosing the right units ensures accurate measurement and helps you understand how to optimize your specific system. It’s all about tailoring your approach to the way your system works and delivers value.
Matching Metrics to Objectives
At the end of the day, measuring throughput should give you the information you need to make real improvements. If your goal is to boost sales, a 20% increase in completed orders is way more valuable than a 10% increase in server CPU utilization. By tying your metrics directly to your business objectives, you ensure your optimization efforts are laser-focused on the areas that matter most. This targeted approach delivers tangible results and proves the real value of effective throughput measurement.
Let’s take a look at a few examples across different industries to illustrate this further. The table below shows common throughput metrics and their typical ranges:
Throughput Metrics by Industry
| Industry | Primary Metric | Measurement Unit | Typical Range |
|---|---|---|---|
| E-commerce | Orders per minute | orders/min | 100 - 10,000+ |
| Telecommunications | Calls per second | calls/sec | 1,000 - 1,000,000+ |
| Video Streaming | Megabits per second | Mbps | 1 - 100+ |
| Manufacturing | Units produced per hour | units/hour | 100 - 10,000+ |
As you can see, the most important metric and its typical range vary significantly depending on the industry. Understanding these differences is critical for setting realistic goals and benchmarking your performance. Picking the right metric for your business is the first step towards meaningful improvement.
Building Your Measurement Infrastructure That Delivers
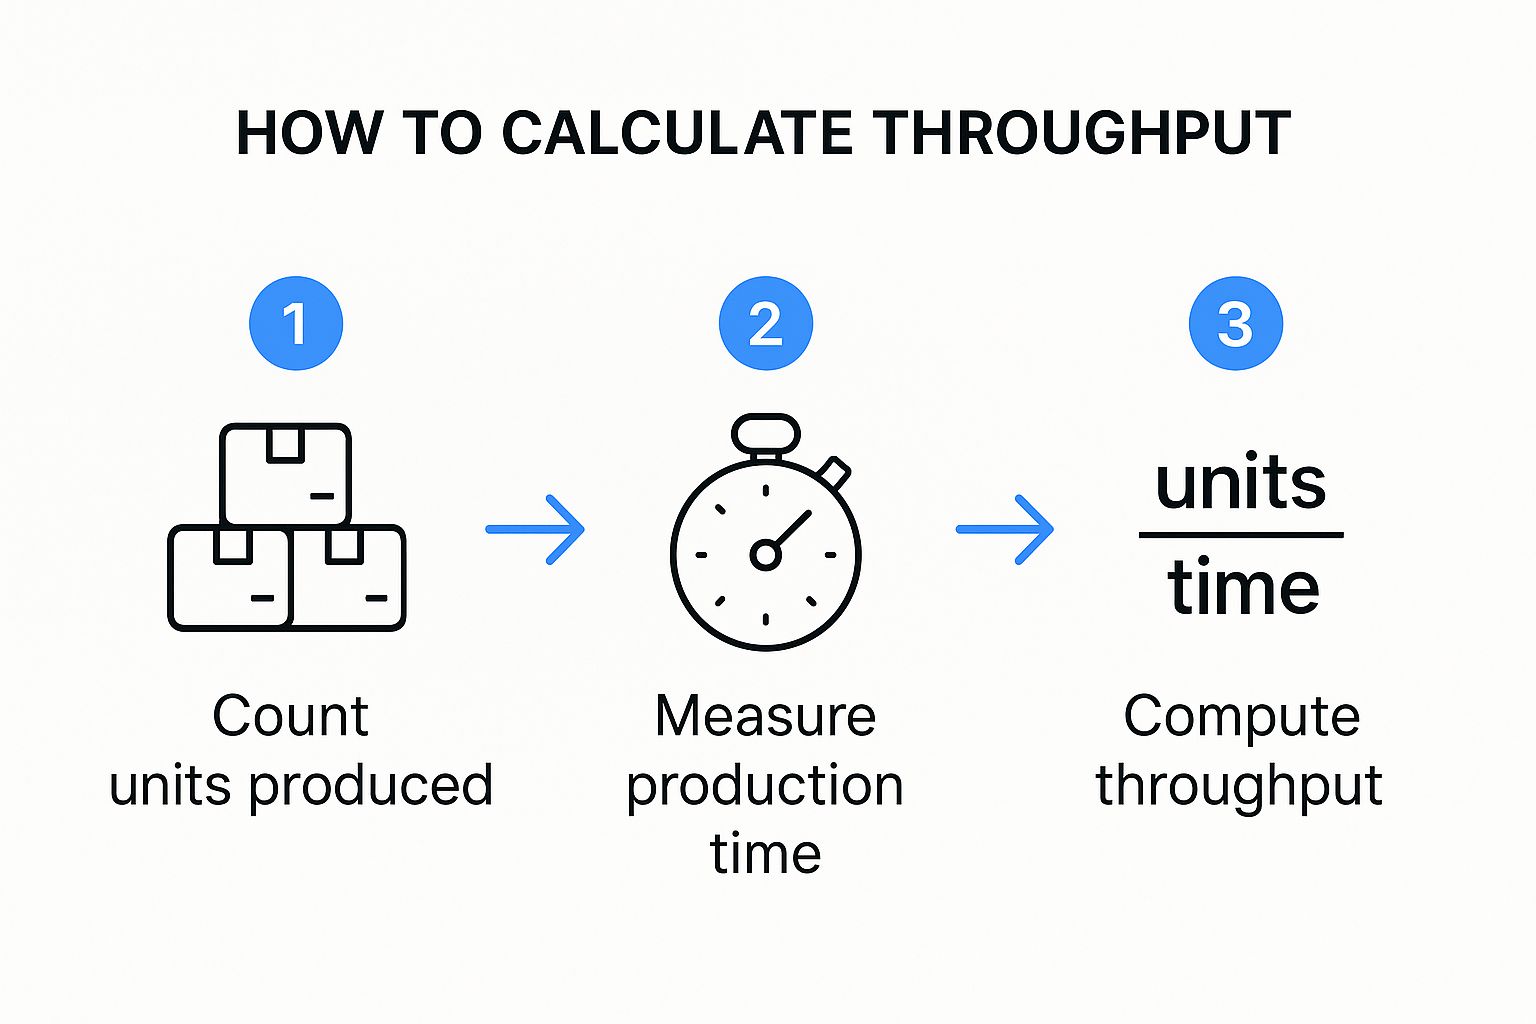
This infographic breaks down throughput calculation into three simple steps: count the units, measure the time, and divide units by time. It’s a fundamental concept, yet it highlights how crucial accurate measurement is. A slight error in any step can skew your final throughput calculation. Let’s explore how to nail these measurements in practice.
This is the GoReplay homepage – a tool we’ll be using a lot. It’s fantastic for capturing and replaying actual HTTP traffic. Having this real-world data for testing is incredibly valuable.
Choosing the Right Tools
Forget fancy dashboards and theoretical benchmarks. In my experience, practical tools that give you actionable insights are key. Think GoReplay for capturing and replaying live HTTP traffic. This allows you to test your system’s performance with real user interactions, not just simulated scenarios. It’s a game-changer.
Combining simple command-line tools with more sophisticated monitoring platforms is a powerful approach. Don’t underestimate tools like tcpdump and netstat for quick diagnostics. A well-rounded toolkit gives you a complete picture of your system’s performance.
Strategic Measurement Points
Knowing where to measure is just as critical as what to measure. Well-placed measurement points give you accurate data without bogging down your system. Think long-term: A complicated setup might look cool, but is it sustainable? Go for a practical setup you can maintain consistently.
For network throughput, precision is paramount. We often measure this in bits per second (bps) – think Kbps, Mbps, or Gbps. Analyzing network packets helps identify bottlenecks and optimize efficiency. This guide on measuring network throughput is worth checking out. Think of it as a future investment in troubleshooting.
Building a Sustainable System
Your measurement infrastructure should be dependable and adaptable. Begin with something simple and gradually expand as your needs change. It’s perfectly fine to start small and scale strategically. Don’t overwhelm your team with overly complicated systems that are hard to manage. The aim is to gain insights, not create extra work. Focus on a reliable system that delivers the data you need to make informed decisions about your infrastructure.
Capturing Data That Actually Reflects Reality
So, you’re looking to measure throughput. Excellent! But grabbing a few quick numbers isn’t going to give you the full picture. You need data that truly reflects real-world usage, not just some idealized, best-case scenario. Trust me, I’ve witnessed countless performance tests crash and burn because they relied on theoretical maximums. What we really need to focus on is capturing actual traffic patterns. This means understanding how your system behaves under stress, during those peak traffic hours, and even when things go sideways.
Handling Measurement Periods
Choosing the right measurement period is absolutely key. Too short, and you’ll likely miss crucial variations. Too long, and those long-term trends might obscure short-term issues. Think about it: measuring throughput during a brief lull in traffic won’t tell you how your system handles a sudden influx of users. The sweet spot is finding a balance.
Consider using shorter bursts of measurement during peak traffic times, and supplement that with longer, less frequent captures during off-peak hours. This will give you a much more comprehensive understanding of your system’s performance.
Dealing With Traffic Variations
Let’s face it: real-world traffic is rarely consistent. You’ll have peaks, valleys, unexpected spikes, and maybe even the occasional DDoS attack. Your measurement strategy needs to be robust enough to account for these variations. This is where GoReplay really excels. By capturing and replaying live traffic, you can recreate real-world conditions in your testing environment. This helps you identify how these traffic fluctuations impact your throughput and pinpoint any potential bottlenecks.
Accounting for Real-World Conditions
Textbook examples rarely prepare you for the messy reality of production environments. Network jitter, intermittent connectivity hiccups, and background processes all play a role in influencing your throughput. Capturing data under these less-than-ideal conditions is essential. GoReplay shines here too. By replaying actual traffic, warts and all, you get a much more accurate picture of how to measure throughput in your specific environment.
Building Confidence in Your Data
Identifying and handling anomalies is crucial for the reliability of your data. Incomplete data can seriously skew your results. You need strategies to handle missing data points and filter out irrelevant noise. Cross-checking your GoReplay captures with other monitoring tools can help validate your measurements and ensure they’re truly representative of your system’s performance under various conditions.
This builds confidence in your data, allowing you to make informed decisions based on reality, not assumptions. This is especially important when you’re comparing performance before and after system changes.
Before we move on, let’s look at some best practices for collecting accurate throughput data. The following table summarizes key considerations to ensure your measurements are reliable and actionable.
Data Collection Best Practices: Essential considerations for accurate throughput measurement
| Factor | Impact | Recommended Approach | Common Pitfalls |
|---|---|---|---|
| Measurement Period | Can skew results if too short or too long | Balance short bursts during peak times with longer captures during off-peak hours. | Only measuring during low-traffic periods. |
| Traffic Variations | Impacts throughput and reveals bottlenecks | Use GoReplay to capture and replay real traffic, including variations. | Assuming constant traffic patterns. |
| Real-World Conditions | Affects overall performance | Capture data under realistic conditions, including network jitter and background processes. | Ignoring the impact of environmental factors. |
| Data Anomalies | Skews results and reduces reliability | Develop strategies to handle missing data and filter noise. Cross-check with other tools. | Relying on incomplete or noisy data. |
By following these guidelines, you’ll be well on your way to gathering throughput data that accurately reflects the realities of your system. This will enable you to make more informed decisions about optimization and resource allocation.
Making Sense of Your Results With Proven Analysis
Let’s be honest, just looking at raw throughput numbers isn’t going to magically reveal the secrets of your system’s performance. I’ve learned this the hard way – trust me, misinterpreting good data can lead you down a rabbit hole of wasted time and resources. What you really need is to analyze those throughput measurements in the right context. That means knowing the difference between normal ups and downs and real bottlenecks.
One of the first things I always look for are trends. Is your throughput consistently dropping over time? That’s a red flag that something might be growing out of control. Or perhaps you see spikes during peak hours. This could be a sign you need more capacity. Recognizing these patterns is key to figuring out where you can improve.
Separating Signal From Noise
Here’s another tricky bit: separating the real problems from the background noise. A bunch of factors can influence throughput – network conditions, background processes, even your testing tools themselves. You have to understand what “normal” variation looks like in your specific system. This helps you pinpoint actual performance issues.
When digging into historical data, statistical methods become your best friend. Discover more insights about statistical methods. Time series analysis helps uncover those hidden trends, patterns, and anomalies lurking within your data. Techniques like linear regression and moving averages can even help predict future throughput. This gives you a real proactive edge, allowing you to address potential bottlenecks before they impact your users.
Comparing Performance Across Conditions
Another critical aspect is comparing performance across different conditions and time periods. Did that recent code change actually improve throughput, or was it just a fluke? Statistical methods help you cut through the noise and determine if changes are genuine improvements. This kind of data-driven decision making is essential for effective optimization.
Actionable Insights: The Real Goal
Remember, gathering throughput data isn’t the endgame. The real goal is actionable insights. This means understanding why your throughput behaves the way it does, and knowing exactly what you can do to improve it. This transforms raw numbers into valuable knowledge, allowing you to optimize your system and deliver real business value. Honing your analytical skills will turn measurements into meaningful improvements that truly make a difference.
Solving Common Measurement Problems Before They Break You
Let’s face it, measuring throughput can be a real pain. It’s not always a smooth ride, and you’re bound to bump into a few annoying issues along the way. I’ve been there, wrestled with these problems, and I want to arm you with the knowledge to avoid wasting precious time on phantom issues. In my experience, inconsistent measurements, system overhead, timing issues, and contradictory measurements are the biggest headaches.
Inconsistent Measurements: When the Numbers Just Don’t Add Up
Ever see your throughput numbers bouncing around like a rubber ball? One minute you’re cruising at 1000 requests per second, the next you’re down to 500. Super frustrating, right? This usually boils down to inconsistencies in how you’re measuring. Are you capturing data at the same point in your system every time? Is your measurement window consistent? Even tiny variations can throw your results way off.
System Overhead: The Silent Performance Thief
Here’s the thing: measuring throughput itself adds overhead to your system. If your tools are too heavy, they’ll actually impact the very thing you’re trying to measure. It’s like trying to weigh yourself while holding a bowling ball – you’re not getting a true reading. Using lightweight tools like GoReplay is key, as it minimizes this impact.
Timing Issues: Throwing a Wrench in the Works
When it comes to throughput, timing is crucial. If your clocks aren’t synced, or you’re not accounting for network latency, your data can get seriously skewed. Imagine timing a race with a stopwatch that’s a few seconds off. The results are meaningless. Accurate timing and understanding its impact are essential.
Contradictory Measurements: When Tools Disagree
It can be incredibly confusing when different tools, or even different parts of your system, give you conflicting throughput numbers. Which one do you trust? This usually means digging deeper to understand exactly what each tool is measuring and how. Are they even looking at the same thing? Are there subtle differences in their approach? Validating your measurements with multiple tools and cross-checking the results is vital.
Building Your Troubleshooting Toolkit
This isn’t about memorizing solutions; it’s about developing the problem-solving skills to tackle those inevitable moments when your measurements go haywire. Learning to validate, cross-check, and troubleshoot problems with your setup, your system, or your interpretation is the real key. Trust me, it will save you a ton of time and frustration in the long run. It’s all about building a deep understanding of how to get accurate throughput measurements, even when things don’t go as planned.
Turning Measurements Into Performance Wins
Understanding how to measure throughput isn’t just about gathering data; it’s about leveraging that data to make your systems faster, more reliable, and ultimately, better for your users (and your bottom line!). I’ve seen seemingly small performance tweaks translate into huge wins, and I’m excited to share how you can do the same. This section is all about turning raw metrics into actionable improvements.
Setting Realistic Performance Targets
Once you have solid throughput data, you can set realistic performance targets. Don’t just guess! Ground your goals in your current performance. For example, if you’re currently at 1000 transactions per minute, aiming for 1200 next quarter might be a sensible goal. This data-driven approach gives you a solid benchmark and sets you up for success.
Having concrete numbers also makes it easier to communicate progress and justify the effort spent on optimization. Nobody wants to invest time and resources without a clear understanding of the potential return.
Tracking Progress and Communicating Results
Tracking progress isn’t about stressing over daily ups and downs. It’s about identifying long-term trends. Are your optimization efforts making a real difference? Regular monitoring, maybe weekly or monthly, will give you the bigger picture.
When communicating results, remember to speak your stakeholders’ language. They’re interested in business impact, not technical details. Instead of reporting a 15% increase in requests per second, frame it as a 10% increase in sales conversions. That’s the kind of information that resonates.
Building a Sustainable Measurement Practice
A sustainable measurement practice isn’t a one-time thing; it’s an ongoing process. Automate your measurements with tools like GoReplay to free up your team. Set up smart alerts for significant changes, such as a sudden drop in throughput. And create reports that are actually useful and easy to digest.
This isn’t just about collecting numbers. It’s about building a system that constantly monitors performance, flags potential problems, and supports ongoing optimization. It becomes a vital part of how you manage and improve your systems, leading to continuous improvement rather than just one-off projects.
Ready to boost your throughput? GoReplay can help you capture, replay, and analyze real HTTP traffic, turning real user interactions into powerful testing data. Start optimizing your performance today!