Blue Green Testing for Safer Deployments
Blue-green testing is a deployment strategy designed to eliminate downtime and drastically reduce the risk that comes with releasing new code. It’s a beautifully simple concept: you run two identical production environments. We call them Blue (the current, live version) and Green (the new version you want to deploy).
While all your live traffic is flowing to the Blue environment, the Green one is quietly getting the new update. Once it’s ready, you can test it, validate it, and when you’re confident, a simple router switch instantly redirects all users to Green. The old Blue environment is kept on standby, ready for an immediate rollback if needed.
Why Blue Green Testing Is a Game Changer for DevOps

In a world driven by continuous delivery, the riskiest moment for any team is pushing new code live. We’ve all been there. Traditional deployment methods often force you into planned downtime or complex, phased rollouts that can expose users to bugs.
Blue-green testing flips this entire dynamic on its head. By creating a complete, isolated clone of your production environment, you get to validate the new release under real-world conditions before it ever sees a live user.
This approach gives you an incredible safety net. If anything goes wrong in the Green environment after the switch, rolling back is as simple as flipping the router back to the still-running Blue environment. This isn’t a complex, hours-long process. It’s nearly instantaneous, slashing your mean time to recovery (MTTR) from hours down to just seconds.
To put it in perspective, let’s look at how this stacks up against more traditional methods.
Blue Green Testing vs Traditional Deployments
This table offers a quick comparison, highlighting the key differences in risk, downtime, and rollback capabilities between blue green testing and older deployment methods like rolling updates.
| Feature | Blue Green Testing | Traditional Deployments |
|---|---|---|
| Downtime | Zero downtime during the switch. | Often requires planned downtime or service degradation. |
| Risk | Low. Issues are caught in the isolated Green environment. | High. Bugs are exposed directly to users during rollout. |
| Rollback | Instantaneous. A simple router switch back to Blue. | Complex and slow. Often requires a full redeploy of the old version. |
| Consistency | All users are on the same version at any given time. | Users can be on different versions simultaneously, causing issues. |
The differences are stark. Blue green testing provides a level of control and safety that older methods just can’t match, making it a far more reliable choice for modern applications.
The Power of Real-Traffic Validation
The real magic happens when you pair this strategy with live traffic replay. Instead of just relying on synthetic tests, you can capture actual user requests from your Blue environment and replay them against the Green one using a tool like GoReplay. This transforms blue-green testing from a simple infrastructure trick into a powerful, data-driven validation machine.
This method lets you answer critical questions with hard evidence before a single user sees the new code:
- Can the new version handle production-level load without falling over?
- Are there strange errors or exceptions when processing real, messy user data?
- Have we introduced any subtle regressions that only show up under specific, real-world scenarios?
By stress-testing the Green environment with a mirror of live traffic, you’re not just hoping the new version works—you’re proving it. This shifts the deployment mindset from reactive debugging to proactive validation.
It’s no surprise that this strategy’s adoption rate continues to climb, especially as software complexity grows. A significant number of Fortune 500 companies have integrated it into their DevOps workflows to keep pace with demands for non-stop innovation. To dig deeper, you can discover more insights about the benefits of blue green deployment and see how teams are implementing it.
Ultimately, this approach is more than just a deployment technique; it’s a commitment to stability, reliability, and delivering a flawless user experience with every single release.
Alright, let’s get our hands dirty and build the environment for our blue-green testing. Moving from theory to practice means getting your infrastructure ready to host two identical, production-grade environments. The success of this whole strategy really hinges on getting this initial setup right.
Our main goal here is to get the Blue (live) and Green (our new version) environments established. Then, we’ll bring in the tool that makes all the magic happen: GoReplay. We’ll focus on getting the GoReplay listener running on your live production server, which is the key to capturing real HTTP traffic for our tests.
Laying the Foundation: Your Infrastructure
Before you even think about installing GoReplay, you have to ensure both environments are perfect mirrors of each other. I can’t stress this enough. Any tiny difference in hardware, software versions, or network configs can throw off your results and lead you to the wrong conclusions.
The Green environment has to be an exact clone of Blue. This is non-negotiable.
- Identical Server Specs: CPU, RAM, and disk I/O must match. No exceptions.
- Consistent Software Stack: Your OS, runtimes (like Node.js or Java), and all application dependencies have to be the same version.
- Mirrored Configurations: Everything from environment variables and firewall rules to external service connections needs to be duplicated.
Think of it like this: your Green environment isn’t just some staging or QA box with fewer resources. It’s a production-ready replica, waiting in the wings to take over.
Getting GoReplay on Your Blue Environment
With the infrastructure squared away, it’s time to install GoReplay on the live Blue server. One of the best things about GoReplay is how lightweight it is. It’s built for high-performance systems, so its impact on your production setup is minimal.
The installation is pretty simple. You just need to grab the latest binary for your system. For a standard Linux server, it looks something like this:
Download the GoReplay binary for your system architecture
wget https://github.com/buger/goreplay/releases/download/v1.3.3/gor-v1.3.3-linux-amd64.tar.gz
Unpack it
tar -xvzf gor-v1.3.3-linux-amd64.tar.gz
And move the binary somewhere in your PATH
sudo mv gor /usr/local/bin/
Once that’s done, just run gor --version to make sure it’s working. It’s a quick sanity check to confirm the binary is good to go before you start pointing it at your production traffic.
A Quick Pro Tip: Always run GoReplay as a user with the fewest privileges possible. It needs to see network traffic, but it almost never needs root. This is a basic but critical security habit to keep your attack surface small.
Firing Up the GoReplay Listener
Now for the fun part. We’re going to tell GoReplay to start listening to the traffic hitting your Blue server. This is done by running the gor command with a few flags that tell it where to listen and where to send the traffic it captures.
A great first step is to capture traffic and just save it to a file. It’s a safe way to start, and it lets you inspect the requests before you do anything with them.
Here’s the command to start capturing traffic from port 80:
sudo gor —input-raw :80 —output-file requests.gor
So what’s this command actually doing? Let’s break it down:
--input-raw :80: This is the core of it. You’re telling GoReplay to grab raw TCP traffic from the network interface on port 80. This is how it snoops on live user requests hitting your server.--output-file requests.gor: Instead of replaying the traffic live, this flag tells GoReplay to write every single request it captures into a file namedrequests.gor.
Just like that, you’ve created a snapshot of real user behavior. This file is now a reusable, high-fidelity test suite you can throw at your Green environment again and again. Next, we’ll look at how to take this captured traffic and replay it against your new deployment.
Alright, your blue and green environments are up and running. Now for the fun part: putting GoReplay to work. This is where we graduate from simply flipping a switch between environments to truly validating our new release with cold, hard data.
We’re going to capture live HTTP traffic straight from your production (Blue) environment and replay it against the new (Green) one. It’s the ultimate reality check, letting you see exactly how your new code handles the chaos of real-world user behavior.
This isn’t your standard load test. Forget synthetic scripts that just guess what your users might do. We’re using a perfect copy of their actual requests, which is the only way to uncover the weird edge cases and sneaky performance bottlenecks that scripted tests almost always miss.
The whole process is pretty straightforward, starting with a solid infrastructure setup before you capture and replay traffic.
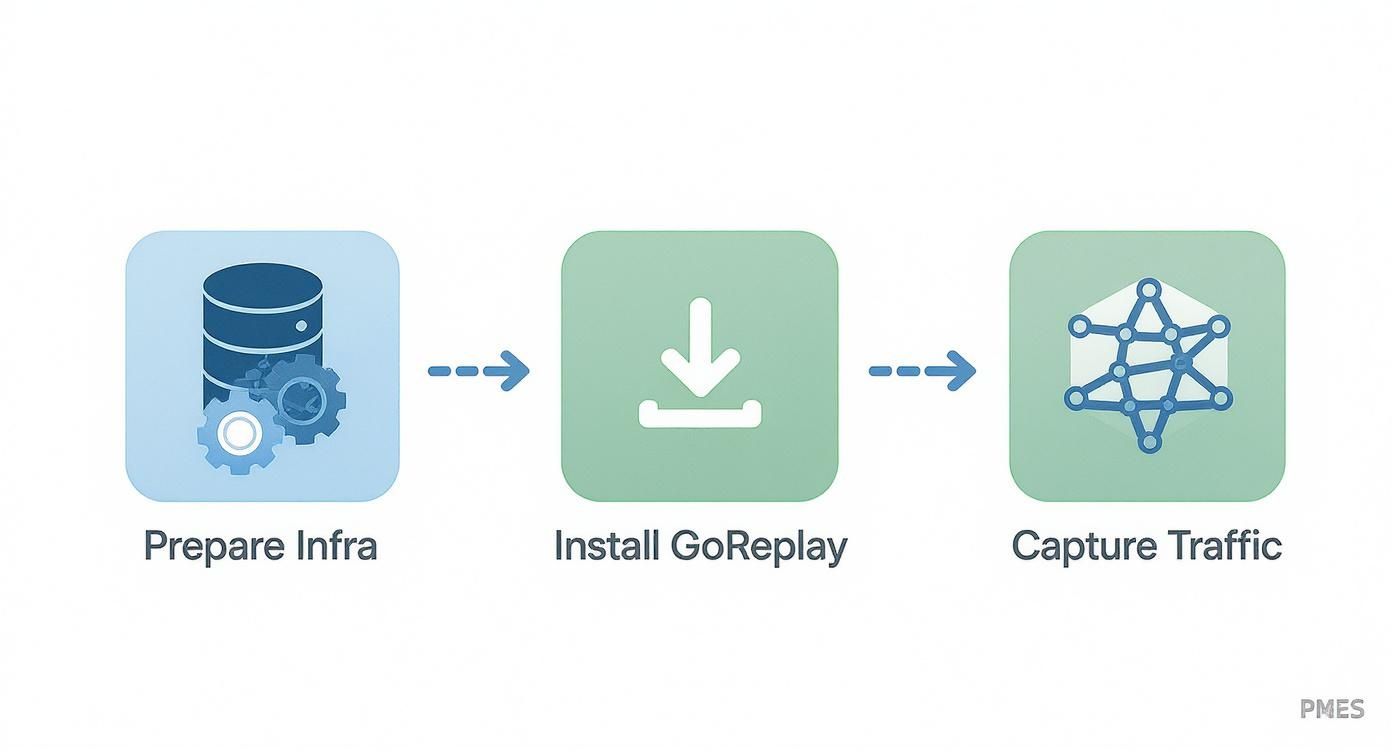
As you can see, getting the foundation right is key. Once that’s handled, you can install GoReplay and configure it to grab the exact data you need for a meaningful test.
Mastering the Art of Traffic Replay
Replaying traffic isn’t just about hitting a “play” button and hoping for the best. You need a strategy, and that strategy depends entirely on what you’re trying to learn. Are you hunting for performance regressions under a massive load, or are you trying to squash a subtle bug in a specific API endpoint?
Here are a few ways I’ve seen teams approach this:
- Full-Throttle Replay: This is my favorite for stress testing. You capture traffic and then replay it as fast as the server can handle it. It’s a fantastic way to find the absolute breaking point of your Green deployment and see if performance degrades under extreme pressure.
- Targeted Endpoint Replay: Sometimes, you only care about one critical piece of your app, like the payment gateway or a core API. With GoReplay, you can easily filter traffic to replay only the requests hitting those specific endpoints.
- Partial Session Replay: You can also get creative and filter traffic based on things like user agents or request headers. This is super useful for simulating specific user segments, like seeing how your app performs for mobile users versus desktop users.
Picking the right strategy makes your blue-green testing focused and productive. You don’t always need to boil the ocean by replaying everything; a surgical approach often yields better insights.
Practical Commands for Replaying Traffic
Let’s get our hands dirty. Imagine you’ve captured your production traffic and saved it to a file named requests.gor. Now, you want to point that traffic at your Green environment, which is listening on green-app-server:8080.
The basic command is simple enough:
gor —input-file requests.gor —output-http “http://green-app-server:8080”
This command tells GoReplay to read from your file and fire every single request at the Green server. While simple, it’s a bit like turning on a firehose. Without any controls, you could easily overwhelm your new environment and get skewed results. For a deeper dive into setup, the official docs have a great post on GoReplay setup for testing environments that covers more advanced configurations.
Controlling the Flow with Throttling
A much more realistic test often involves replaying traffic at a speed that mimics your actual production load. This is where the --output-tcp-speed flag becomes your best friend. It lets you throttle the replay, so you don’t accidentally DDoS your own system.
For instance, to replay traffic at 10% of its original speed, you’d run this:
gor —input-file requests.gor —output-http “http://green-app-server:8080” —output-tcp-speed 10%
I find this technique incredibly powerful for a few reasons:
- Realistic Load Simulation: You can gently ramp up the load on your Green environment, just like a natural traffic spike.
- Resource Monitoring: By controlling the pace, it’s much easier to watch how CPU, memory, and I/O respond as the request volume climbs.
- Safe Stress Testing: You can incrementally increase the speed—10%, 50%, 100%, then even 200%—to pinpoint the exact moment performance starts to suffer, all in a controlled way.
By throttling the replay, you transform a chaotic stress test into a controlled experiment. This precision is what gives you actionable data, helping you decide whether the Green deployment is truly ready for primetime.
At the end of the day, it’s this combination of real traffic and careful, controlled replay that makes blue-green testing so effective. It gives you a level of confidence that no amount of synthetic testing ever could, ensuring your releases are not just fast, but incredibly safe.
Analyzing Results to Validate Your Green Deployment

Replaying live traffic against your new green deployment is a powerful technique, but it’s only half the story. The real value comes from what you do next. Without a clear, data-driven plan for analysis, you’re just making noise. This is where we move past gut feelings and build undeniable confidence in your release.
The goal is simple: prove, with hard data, that the green environment performs as well as—or better than—the blue one under a realistic load. You need to establish a baseline from your live blue environment and then compare the green environment’s performance directly against it.
This process transforms blue-green testing from a simple deployment mechanism into a rigorous validation gate. It’s how you ensure only high-quality, battle-tested code makes it to your users.
Defining Your Key Performance Indicators
Before you even start the replay, you have to decide what success looks like. Don’t wait until after the test to try and interpret the data; define your Key Performance Indicators (KPIs) and their acceptable thresholds ahead of time. This removes all ambiguity and makes the final go/no-go decision a straightforward, logical one.
You should focus on the metrics that directly impact user experience and system stability. Here are the essentials I always recommend monitoring:
- HTTP Error Rate (Especially 5xx): This is your most critical indicator. A spike in server-side errors (500-599) on the green environment is an immediate red flag that something is seriously wrong with the new code.
- Response Latency: How quickly is your application responding? Pay close attention to the average, 95th, and 99th percentile latencies. A small increase might be acceptable, but a significant jump signals a performance regression.
- Resource Utilization: Keep a close eye on the holy trinity of system resources: CPU, memory, and disk I/O. Your new deployment shouldn’t consume drastically more resources to handle the same amount of traffic.
The most effective validation strategies compare the green environment’s metrics directly against the blue environment’s live baseline. The question isn’t “Is latency low?” but rather “Is green’s latency comparable to blue’s under the same load?”
Setting Objective Rollback Criteria
Once you know what to measure, you need to define clear, non-negotiable thresholds for a rollback. These rules should be so clear that there’s no room for debate in the heat of a deployment.
Having these metrics defined upfront makes the decision to roll back an objective, data-backed choice, not a panicked reaction.
Here’s a look at some of the key metrics we monitor when validating a new environment, along with some typical thresholds we might use.
| Key Metrics for Green Environment Validation | | :--- | :--- | :--- | | Metric | Description | Example Threshold | | 5xx Error Rate | Monitors server-side errors. An increase signals instability. | Greater than 0.5% above baseline. | | P95 Latency | The 95th percentile response time. Measures the experience for most users. | Increase of more than 15% vs. blue. | | CPU Utilization | Tracks CPU usage under load. High usage can indicate inefficient code. | Sustained 25% higher than blue. | | Memory Leaks | A steady, unexplained increase in memory consumption over time. | Any steady increase in memory usage. |
These are just examples, of course. Your own thresholds will depend on your application’s specific performance profile and business requirements.
Protecting User Data During Replay
Replaying production traffic means you might be handling sensitive user data, like Personally Identifiable Information (PII), passwords, or API keys. It’s your absolute responsibility to ensure this data is never exposed or misused in your testing environment.
GoReplay offers powerful middleware capabilities that let you modify requests on the fly. You can use this to mask or anonymize sensitive fields before they ever hit your green environment. For instance, you can write a simple script to rewrite the Authorization header or replace email addresses in a JSON payload with dummy data.
This step isn’t optional; it’s a critical part of a responsible and secure blue-green testing process.
The impact of getting this right is huge. In fact, an industry report found that organizations using blue-green deployment saw a 73% decrease in user-reported errors following a release. They also cut the average time to recover from a failed deployment from 4.2 hours to just 1.1 hours. You can read the full analysis on deployment strategies to see how these practices lead to more stable systems.
By combining real traffic replay with a rigorous, metrics-driven validation plan, you create a powerful feedback loop. You can deploy with confidence, knowing your new release has already proven its stability against the ultimate test: reality itself.
Weaving GoReplay into Your CI/CD Pipeline
Running traffic captures manually is a great way to get a feel for blue green testing. But to make it a core part of your engineering culture, you have to automate it. This is where your CI/CD pipeline comes in, transforming a one-off check into a reliable, hands-off safety net for every single deployment.
The end goal is simple: a git push to your main branch should kick off the whole show. Your pipeline should automatically spin up the green environment, grab a fresh slice of production traffic, replay it against the new code, and run automated checks. The deployment only proceeds if every check passes with flying colors.
This is how you build a process that actively prevents bad code from ever reaching your users. It’s about making every release battle-tested against reality by default.
Crafting the Automation Blueprint
It doesn’t matter if you’re using GitLab CI, Jenkins, or GitHub Actions—the logic is always the same. You’ll want to structure your pipeline into distinct stages that handle each piece of the blue-green validation.
Here’s what a typical automated workflow looks like:
- Build & Deploy Green: Your pipeline kicks off by building the application artifact (like a Docker image) and deploying it to your isolated green environment.
- Capture Live Traffic: Next, a script triggers GoReplay on your blue (production) server. It’ll capture live traffic for a predefined window—say, 15 minutes—and save the recording to a shared location like an S3 bucket.
- Replay & Validate: The pipeline then fires up the replay, pointing that captured traffic at the new green environment. At the same time, another script starts polling your monitoring tools (like Prometheus) to see how the new code is holding up against your key performance indicators.
- Promote or Rollback: This is the moment of truth. Based on the validation results, the pipeline decides what to do. If all metrics are within their thresholds, it automatically promotes green to blue. If anything looks off, it aborts the deployment and fires off an alert.
With this setup, you remove the human element entirely unless a problem is detected. Your deployments get safer and faster.
Handling Dynamic Changes with Middleware
One of GoReplay’s killer features for automation is its middleware support. Middleware lets you programmatically modify requests and responses on the fly as they’re being replayed. This is a lifesaver for dealing with the dynamic parts of your application that change with every session or deployment.
For instance, you can use a simple middleware script to:
- Inject Fresh Auth Tokens: If your tests need valid authentication, a script can grab a new token and inject it into the
Authorizationheader of every single replayed request. - Rewrite API Endpoints: Did a new version change an API path from
/v1/userto/v2/user? Middleware can rewrite the old path to the new one, ensuring requests hit the right code. - Mask Sensitive Data: Enforce on-the-fly data masking to strip out any PII before it even touches your testing environment, keeping your tests secure.
This ability to make dynamic modifications is what makes for a truly robust, automated testing loop that adapts to code changes without someone having to tweak scripts for every release.
The Big Idea: Your CI/CD pipeline should make safe deployments the default option. By automating the capture, replay, and validation cycle, you embed quality assurance directly into your delivery process, making it nearly impossible to ship a performance regression.
Setting Up Automated Alerts
When a deployment goes sideways, your pipeline should be the first to scream about it. Integrating automated alerts is the final piece of this puzzle. When your validation script sees that a performance threshold has been breached—maybe the P95 latency on the green environment just jumped by 20%—it shouldn’t just quietly fail the build.
It needs to send an alert straight to your team’s Slack or Microsoft Teams channel. The message should be short, sharp, and actionable:
- Which deployment failed.
- The exact metric that breached its threshold.
- The measured value vs. the expected value.
This gives the development team immediate, concrete feedback so they can start debugging right away. By wiring your blue green testing directly into your team’s daily workflow, you close the feedback loop and turn performance into a shared responsibility. For teams looking to take this even further, exploring broader strategies for CI/CD pipeline optimization can help contextualize where advanced testing methods like this fit into the bigger picture.
Common Questions About Blue-Green Testing
Even with a solid game plan, you’re going to have questions. It’s just part of the process when you’re bringing a new deployment strategy into the mix. Getting a handle on the nuances of blue-green testing isn’t just about the “how”—it’s about understanding the “why” and “when” behind your choices so you can set the right expectations for your team.
A lot of engineers first ask how this method stacks up against other popular deployment techniques. That’s a great question, because the best strategy really depends on what you’re trying to accomplish with a specific release.
Blue-Green Testing vs. Canary Releasing
One of the first things people want to clarify is the difference between blue-green and canary releases. They both aim to cut down on deployment risk, sure, but they work on totally different principles and are built for different jobs.
-
Blue-Green Testing: You’re deploying a completely new, parallel environment. Once you’ve validated it, 100% of traffic gets switched over in one go. It’s a clean, all-or-nothing cutover focused on proving out the infrastructure and application stability before a single user sees it.
-
Canary Releasing: This is a much more gradual rollout. The new version goes out to a tiny slice of real users—say, 5%—while you monitor its performance like a hawk. If everything looks good, you slowly dial up the percentage until everyone is on the new version.
The bottom line: Blue-green is your go-to for validating technical stability and performance with zero user impact before the final switch. Canary releasing, on the other hand, is perfect for testing new features with real user feedback in a controlled, incremental way.
How Do You Handle Database Migrations?
Database changes are almost always the scariest part of any deployment. The most reliable way to handle this is to separate your database schema changes from your application deployments. This move prevents your database from becoming a single point of failure during the cutover.
The trick is to make your database changes backward-compatible. This means your old application version (Blue) has to work perfectly with the new database schema. Once that migration is done and dusted, you can confidently roll out your new application (Green), which is already built to work with the new schema. Breaking it into a two-step process like this sidesteps downtime and avoids nasty data consistency problems.
Can GoReplay Handle Stateful Applications?
This is a great, practical question. GoReplay is fantastic at replaying stateless HTTP traffic, but stateful applications with complex user sessions definitely add a wrinkle. While you can replay the sequence of requests, making sure session continuity is perfect takes some real planning. You have to get the user’s entire journey replayed in the exact right order for it to be meaningful.
In many cases, you can lean on GoReplay’s filtering features to zero in on traffic by session ID. You could even use middleware to tweak requests on the fly, maybe to inject valid auth tokens. But for highly stateful applications, you’ll get the best results by combining traffic replay with other dedicated testing strategies.
Ready to make your deployments safer with real traffic? GoReplay is an open-source tool that captures and replays live HTTP traffic, allowing you to validate your new releases with unparalleled realism. Start testing with GoReplay today.