Automated Interface Testing with GoReplay
Automated interface testing is all about making sure an application’s user interface (UI) works exactly as it should, without a human having to manually click through every single screen. It’s a vital practice for squashing bugs early, making sure user journeys flow smoothly, and ultimately, delivering a great user experience. The whole point is to simulate what users do and automatically check if the UI responds correctly.
Why Real Traffic Is Your Best Testing Asset

Most teams start their automated testing journey with scripted scenarios. While those scripts have their place, they’re built on a fundamental flaw: they’re based on assumptions of how users will behave, not the messy, unpredictable reality of how they actually do. This gap between assumption and reality is exactly where the most frustrating and hard-to-find bugs love to hide.
The best, most authentic test data you can possibly get your hands on is your own production traffic. It’s a perfect recording of every weird user journey, every broken request, and the true diversity of real-world interactions.
The Problem with Perfectly Scripted Scenarios
Scripted tests, by their very nature, are limited. They follow clean, predictable paths and simply can’t account for the chaotic nature of real people using your software. A QA engineer might write a flawless test for a login flow, but they’d probably never think to test what happens when a user pastes an emoji into a password field or frantically double-clicks a submit button.
Key Takeaway: Your test cases are only as good as your imagination. Real traffic captures all the bizarre user interactions you’d never dream of scripting, giving you a much richer and more realistic testing foundation.
This is exactly why replaying live traffic with a tool like GoReplay is so powerful. You stop guessing and start using a perfect mirror of your production activity to see how your staging environment really holds up. This approach goes way beyond simple functional checks and gives you deep insights into problems you might otherwise miss.
- Performance Bottlenecks: See how your interface handles the true load of concurrent users and their complex request patterns.
- Edge-Case Bugs: Uncover those maddening errors that only pop up under specific, rare conditions that are nearly impossible to script by hand.
- Stateful Interaction Failures: Reliably test complex user sessions, like an e-commerce checkout, using the actual sequence of requests made by a real customer.
While this might feel like a new idea, it’s part of a much bigger industry trend. The global automated software testing market was valued at around USD 84.71 billion in 2024 and is on track to hit USD 284.73 billion by 2032, according to market analysis. This growth is all about the relentless need for faster, more reliable releases.
Let’s break down the core differences between these two testing philosophies.
Traditional Scripted Tests vs Live Traffic Replay
| Aspect | Traditional Scripted Testing | Traffic-Based Testing (GoReplay) |
|---|---|---|
| Data Source | Synthetic, manually created data and user paths. | Real production user traffic, captured live. |
| Realism | Low. Based on assumptions of user behavior. | High. Reflects actual, unpredictable user interactions. |
| Coverage | Limited to the specific scenarios you can imagine and write. | Comprehensive. Captures all user journeys, including edge cases. |
| Maintenance | High. Scripts often break with UI changes. | Low. Adapts to new features as users interact with them. |
| Bug Discovery | Finds known and expected issues. | Uncovers unknown, stateful, and performance-related bugs. |
| Setup Complexity | Can be complex to write and maintain large test suites. | Simple to set up traffic capture; may need middleware for state. |
By using real traffic, you’re not just testing more; you’re testing smarter. You align your quality assurance with the modern demand for truly robust, user-ready software that can handle the chaos of the real world.
Your GoReplay Installation and Setup Playbook
Getting GoReplay up and running is pretty simple, but let’s be honest—going from a quick install to a setup that can reliably capture production traffic takes a bit more finesse. I’ve been through it, and this playbook is built from those real-world lessons. We’ll skip the textbook examples and get straight to what you actually need to do to get this working in a real server environment.
First things first, you need the GoReplay binary on your server. For most Linux distros, grabbing the latest release is easy enough. But from my experience, the first wall people hit is permissions. You absolutely need to make sure the user running GoReplay can actually listen to network traffic. A quick sudo might be all you need, depending on your company’s security policies.
Navigating Containerized Setups
So what happens when your app lives in a container? This is where a lot of people get stuck. Your instinct might be to install GoReplay inside your app’s container, but don’t. The best way to handle this is to run GoReplay in its own dedicated container, but on the same host network.
By using the --net=host flag, you give the GoReplay container direct access to the host machine’s network interfaces. This is the magic trick. It lets GoReplay see all the traffic flowing to your application container without you having to build a bunch of complex, brittle network configurations. It keeps the tool isolated but gives it the full visibility it needs.
I’ve seen teams waste hours trying to attach GoReplay directly to an application container’s network namespace. Trust me, just use the host network. It’s cleaner, more reliable, and you’ll capture everything without meddling with your primary app’s environment.
This whole process—capturing, replaying, and analyzing—is what makes automated interface testing so effective. This visual breaks it down nicely.
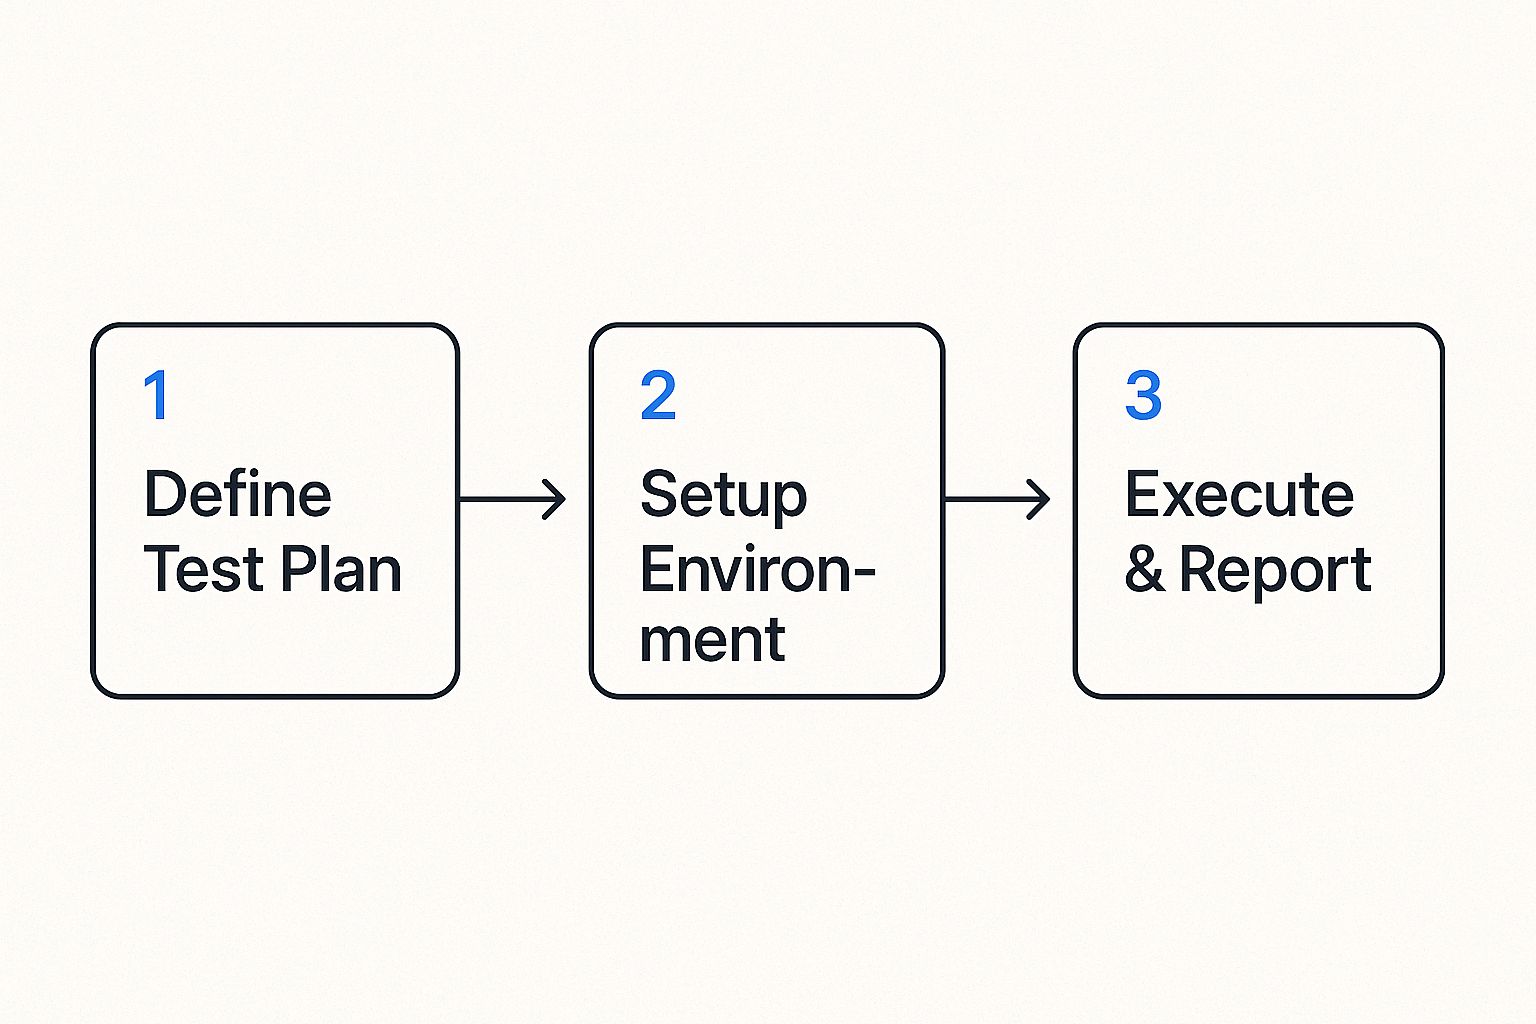
It all comes back to having a solid plan and a properly configured setup. Without those, you’re just generating noise, not meaningful test results.
Your First Capture Command
Alright, you’re installed and ready. Your first command is where the action starts. You just need to tell GoReplay what to listen to (the input) and where to put the traffic it captures (the output). For a standard web app on port 80, this is a great starting point:
sudo gor --input-raw :80 --output-file requests.gor
Let’s quickly break that down:
--input-raw :80: This tells GoReplay to grab raw TCP traffic hitting port 80. It’s the bread and butter for most web traffic capture.--output-file requests.gor: This is the destination. All the captured traffic gets saved into a file namedrequests.gor, which you’ll use later for the replay step.
Getting the network interface right is critical. If your server has a few, like eth0 and eth1, you might need to be more specific (e.g., --input-raw eth0:80). If you’re working with APIs, you can get even more sophisticated. Check out these tips for simplifying REST API testing with GoReplay to see how you can zero in on specific endpoints.
Once that command runs without errors, you’re officially doing it—capturing real user traffic. That file is the raw material you need to build some seriously high-quality automated tests.
Capturing Production Traffic Like a Pro

Alright, with GoReplay installed, we’re at the most critical part of this whole process: capturing live production traffic. This isn’t just about hitting “record.” It’s about being smart and selective, grabbing the genuine user interactions you need for high-fidelity automated interface testing while filtering out all the noise.
Think about it. Your servers are constantly getting hit with traffic that has nothing to do with real users. You’ve got health checks from load balancers, pings from internal monitoring tools, and a stream of administrative API calls. All that stuff is vital for operations, but for testing user-facing features? It’s junk that will pollute your test data and lead you to chase down phantom issues.
The first thing you need to figure out is the right network interface and port. For a typical web app, you’ll be looking for traffic heading to port 80 (HTTP) or 443 (HTTPS) on your main network interface, something like eth0. But there’s a common catch: if you run GoReplay on an application server that sits behind a load balancer handling SSL termination, you’ll actually be listening for unencrypted traffic on a higher port, like 8080.
Filtering Traffic for Cleaner Tests
Precision is everything here. GoReplay gives you some powerful flags to zero in on exactly the requests that matter. One of the most useful tricks is targeting specific HTTP methods or URL paths to isolate particular API endpoints or user flows.
Let’s say you’re focused on testing the checkout flow of an e-commerce site. You can completely ignore the firehose of GET requests for images and CSS files. Instead, you can focus squarely on the POST and PUT requests that actually drive a transaction forward. That’s where the real action is.
Here’s a practical command to get you started:
sudo gor —input-raw :8080 —output-file-append
—http-allow-method POST
—http-allow-method PUT
—output-file “checkout-traffic-%Y-%m-%d.gor”
This command listens on port 8080 but—and this is the important part—it only saves POST and PUT requests. It’s a simple but incredibly effective way to isolate the most critical user actions for your automated interface testing.
Pro Tip: From my own experience, always use the
--output-file-appendflag in production. If you don’t, GoReplay will wipe out your capture file every time it restarts. Appending ensures you don’t lose precious traffic data if the process gets interrupted for any reason.
Managing Your Captured Data
If you have a high-volume application, you’re going to generate a ton of traffic data. Just dumping it all into one giant file is a recipe for headaches and performance problems down the line. The command I showed you above has a clever solution built right in: file rotation.
By using the --output-file "checkout-traffic-%Y-%m-%d.gor" syntax, you’re telling GoReplay to automatically create a new, separate file for each day’s traffic. This keeps your individual capture files at a manageable size and makes it a breeze to find traffic from a specific day if you need to investigate a past incident.
Here are a few essential strategies I always follow for data management:
- Rotate Daily: Use date-based file naming like
%Y-%m-%d. It’s the most logical way to segment your captured traffic. - Automate Cleanup: A simple cron job to delete or archive old
.gorfiles after 7 or 14 days is a must. This will keep you from running out of disk space, which I’ve seen happen more than once. - Compress Old Files: For long-term storage, zip up your older traffic files. They shrink down beautifully and save a huge amount of space.
By being thoughtful about how you capture and manage your traffic, you’re doing more than just collecting data—you’re curating a pristine library of real-world test cases. This clean, relevant traffic is the absolute foundation for an effective and reliable automated testing strategy.
Replaying Traffic to Validate Your Interface
Capturing traffic is just the beginning. The real magic happens when you replay that traffic against your test environment to see what breaks. This is where your automated interface testing strategy gets real, uncovering the kinds of bugs that only show up under the stress of genuine user activity.
But hold on. Just dumping your production traffic onto a staging server is a recipe for disaster. If you don’t configure the replay correctly, you’ll end up with a chaotic mess that generates more noise than insight. Let’s walk through how to do it right.
Simulating Realistic User Load
One of the first things you’ll run into is replay speed. Your production environment might be humming along with thousands of requests per minute, but your staging server probably isn’t built for that. Hitting it with the full firehose of traffic will just knock it over, and a crashed server doesn’t tell you anything useful.
This is why rate limiting is so essential. By controlling the replay speed, you can simulate specific, realistic user loads and see how your interface actually holds up.
- Average Load: Replay traffic at your production server’s typical rate to validate baseline performance.
- Peak Load: Want to simulate a Black Friday rush? Crank up the speed to identify performance bottlenecks before they happen.
- Stress Testing: Keep increasing the rate until something gives. This is how you find your application’s true breaking point.
This controlled approach is the bedrock of a solid load testing strategy. If you want to go deeper, our guide on how traffic replay improves load testing accuracy is a great resource. Fine-tuning the replay speed is the key to gathering precise performance data instead of just DDoSing your own test environment.
Rewriting Traffic for Test Environments
Here’s another common problem: your captured traffic is pointing at your production domain, not your staging one. GoReplay has a simple but powerful fix for this—rewriting the host header on the fly. This lets you redirect every request to your test server without ever touching the original capture file.
Key Insight: The ability to modify traffic during replay is what makes this technique so flexible. It allows you to adapt real production data to the specific needs of a non-production environment, bridging the gap between real-world scenarios and testing constraints.
The need for this kind of robust testing is growing fast. The global automation testing market is projected to hit USD 35.52 billion in 2024, driven by an explosion of smart devices like TVs and home appliances that all need to talk to each other. That market is expected to skyrocket to USD 169.33 billion by 2034, with the US market alone valued at USD 10.66 billion in 2024. Effective automated interface testing isn’t a luxury anymore; it’s a necessity to make sure all this stuff actually works together. You can discover more about these automation testing trends and what they mean for software quality.
Handling Stateful User Sessions
Now for the trickiest part: state. A real user’s journey—like adding items to a shopping cart and then checking out—relies on a persistent session. The problem is that your captured traffic is full of real authentication tokens and session IDs that are completely invalid in your staging environment.
This is where middleware becomes your best friend. GoReplay lets you inject custom scripts that can intercept and modify requests before they get replayed.
Imagine a user’s captured request has an old, expired production JWT. Without intervention, that request is dead on arrival. But with middleware, you can build a script that:
- Catches the request with the expired token.
- Makes a quick API call to your staging auth service to get a fresh test token.
- Swaps the old production token for the new test token right in the request header.
- Lets GoReplay send the modified—and now valid—request on its way to your staging server.
By managing state this way, you can accurately replicate complex, multi-step user flows. This transforms your replay from a simple barrage of stateless hits into a true, end-to-end validation of your application’s logic, letting you squash bugs long before they ever see a real user.
Making Sense of the Results to Find Real Defects
Once you’ve finished replaying a chunk of traffic, you’re sitting on a goldmine of data. Now for the most important part of automated interface testing: turning all that raw output into clear, actionable bug reports and performance fixes. Just knowing a test failed is useless. You need to know why it failed.
This is where GoReplay’s response diffing feature really shines. It automatically compares the original responses from your production environment against the new responses from your staging box. Any difference it flags is almost certainly a sign of trouble brewing.
Key Takeaway: The goal here isn’t just to spot differences, but to figure out what they actually mean. A tiny change in a JSON payload might look harmless, but it could easily break a mobile app’s parser. A 100ms bump in latency might seem small, but it could be screaming about a database query that’s about to fall over under real load.
This is where you get the real value. Instead of just guessing, you get concrete proof of regressions, functional bugs, or performance hits—all triggered by the chaos of real user behavior.
Decoding Common Interface Problems
After you run a few tests, you’ll start to see the same kinds of issues pop up again and again. Getting good at spotting these patterns is the secret to triaging problems quickly instead of getting lost in the noise.
Here’s what I always look for first:
- HTTP Status Code Mismatches: Did a request return a
200 OKin production but a500 Internal Server Errorin staging? You’ve just found a show-stopper. This is the clearest possible sign of a functional regression. - Creeping Latency: GoReplay makes it easy to see if responses from your staging server are consistently dragging their feet compared to production. This is a classic early warning of a performance bottleneck you’ll want to squash immediately.
- Payload Drift: Are there new fields in a JSON response that nobody expected? Even worse, are fields the frontend relies on suddenly missing? These small API changes are notorious for causing massive client-side failures.
- A Surge of
4xxErrors: If you suddenly see a lot of404 Not Foundor401 Unauthorizederrors, it’s a huge red flag. It usually points to a problem with routing, authentication, or authorization logic in the new build.
This kind of targeted analysis helps you get past a simple “pass/fail” mentality. You’re not just a tester; you’re a detective, turning raw output into a clear to-do list for your development team.
From Findings to Fixes: Creating Reports That Work
Finding a bug is only half the job. You have to report it in a way that lets a developer fix it without a dozen back-and-forth emails. A bug report from a GoReplay session can be incredibly powerful because it’s based on a real, captured user interaction.
A solid report needs to include:
- The Original Request: The exact HTTP request that caused the problem.
- The Expected Response: What the production server sent back.
- The Actual Response: The broken response from the staging server.
- A Clear Diff: A quick summary of what changed—the status code, the latency, or the specific payload fields that are different.
This level of detail is a game-changer for any team. It removes the guesswork and the “works on my machine” excuses, letting developers get straight to replicating and squashing the bug. The demand for this kind of precision is driving huge growth in the industry. The global automation testing market is on track to hit USD 129.27 billion by 2033, with service components making up nearly 59% of that spend. A huge piece of that is mobile interface testing, driven by 6.9 billion global smartphone users who won’t tolerate a buggy app.
You can read more about the growing automation testing market and its relentless focus on service quality. By baking these detailed findings into your workflow, you’re not just testing—you’re directly contributing to that quality and making sure your software is truly ready for primetime.
When you start exploring a new testing method like traffic replay, you’re bound to have questions. Moving from the idea of automated interface testing to actually doing it means hitting some real-world snags. Let’s walk through a few of the most common hurdles engineers face when they first get their hands on GoReplay.
A big one right out of the gate is always about encryption. How does a tool like GoReplay deal with HTTPS? The simplest answer is that it’s designed to listen to unencrypted traffic. The best and most common approach is to capture traffic after it’s been decrypted by your load balancer or reverse proxy.
This usually means running GoReplay on the application server itself or on a machine sitting just behind the SSL termination point. By listening to the plaintext HTTP traffic, often on a port like 8080, you get full visibility into the requests without ever needing to mess with private keys.
Fitting It Into Your Workflow
The next question I always hear is about automation. Can you actually plug this into a CI/CD pipeline? Absolutely. Since GoReplay is a command-line tool, it’s a natural fit for build automation. You can easily script a pipeline stage to replay a recorded traffic file against a fresh deployment in your staging environment.
The real magic here is GoReplay’s exit codes. Your CI/CD job can check the exit code after a replay finishes. If it signals a problem, the pipeline can automatically fail the build, creating a powerful quality gate that stops critical regressions from ever making it to production.
Performance is another major concern. What kind of overhead does running GoReplay add to a live production server? Honestly, not much. It was built from the ground up for high performance using a lightweight raw socket sniffing method. For most systems, the CPU and memory footprint is barely noticeable.
Of course, it’s always smart to keep an eye on your system resources when you first deploy it. If you’re running a massive, high-volume service, you can use flags like --rate-limit to just sample the traffic, which minimizes the overhead even further.
Keeping Your Data Safe
Finally, and this is a big one, how do you manage sensitive data? You can’t just replay traffic with real user passwords and API keys floating around. That’s a non-starter for security and compliance.
This is where GoReplay’s middleware comes in. It gives you a powerful hook to modify requests and responses on the fly. You can write simple scripts to find and replace, hash, or strip out sensitive info, such as:
- Passwords and session tokens
- API keys or other credentials
- Personally Identifiable Information (PII)
This way, you get to test with the complexity and randomness of real user behavior, but without ever letting sensitive data leave your secure environment. It’s a critical part of making automated interface testing both realistic and responsible.
Ready to stop guessing and start testing with real user traffic? GoReplay gives you the power to capture and replay live HTTP traffic, uncovering critical bugs before they impact your users. Explore our open-source tool and see how it can transform your QA process. Learn more about GoReplay.