Mastering Application Capacity Planning
Think of application capacity planning as building a strategic blueprint for your digital infrastructure. It’s the whole process of making sure your application has exactly the right amount of resources—not too much, not too little—to handle user demand flawlessly and without breaking the bank.
What Is Application Capacity Planning and Why It Matters

At its heart, application capacity planning is a business strategy that just happens to live in the engineering world. It’s about moving past guesswork and panicked, reactive fixes. Instead, you get a structured way to anticipate future needs and make smart, proactive decisions about your infrastructure resources like CPU, memory, storage, and network bandwidth.
Imagine you’re running a popular e-commerce site. Without a solid capacity plan, a sudden holiday sales rush could easily crash your website. The result? Lost revenue and seriously frustrated customers. But the opposite is just as bad—constantly over-provisioning resources “just in case” leads to bloated cloud bills that silently eat away at your profit margins.
Application capacity planning is the critical bridge between performance and cost. It helps you find that sweet spot where your application delivers a fast, reliable user experience without wasting money on idle resources.
This isn’t just a niche discipline anymore; it’s a core business function. The global capacity management market was valued at USD 1.64 billion in 2023, and it’s projected to climb to nearly USD 7.91 billion by 2031. This explosive growth, driven by the massive shift to cloud computing, shows just how vital this has become. You can explore more about these market dynamics to see why so many businesses are getting on board.
The Four Pillars of Effective Planning
To really get why capacity planning is so valuable, we can break it down into four fundamental pillars. Each one represents a core goal that, when balanced correctly, leads to a resilient and efficient system. Getting these concepts right is the first step toward building a proactive, forward-thinking engineering culture.
This table breaks down the core objectives of application capacity planning, explaining what each pillar means for the business and its users.
The Four Pillars of Application Capacity Planning
| Pillar | Objective | Business Impact |
|---|---|---|
| Performance | Ensure fast response times and low latency under all load conditions. | Improves user satisfaction, boosts conversion rates, and enhances brand reputation. |
| Availability | Prevent outages and downtime by ensuring the system can handle peak demand. | Protects revenue streams, maintains customer trust, and ensures business continuity. |
| Cost Optimization | Align resource allocation with actual demand to avoid overspending on idle capacity. | Lowers operational expenses, improves profitability, and maximizes return on investment (ROI). |
| Scalability | Design the system to grow efficiently as user traffic and business needs evolve. | Supports long-term growth, enables quick adaptation to market changes, and provides a competitive advantage. |
Ultimately, a strong application capacity plan isn’t just about preventing failures; it’s about building a solid foundation for sustainable growth. It ensures that as your user base expands, your infrastructure can scale gracefully right alongside it, providing a consistently excellent experience every step of the way. By balancing these four pillars, you can finally stop fighting fires and start strategically building for the future.
A Repeatable Framework for Capacity Planning
Great capacity planning isn’t a one-off project you just check off a list. It’s a living cycle you build right into your operations for resilience and foresight. If you’re only reacting to traffic spikes, you’re always one surge away from a crisis. But with a proactive framework, you can turn that chaos into a predictable, repeatable workflow.
This isn’t about just putting out fires anymore—it’s about strategically building for the future. We can break it down into a clear, four-step loop: monitoring performance, forecasting demand, modeling scenarios, and finally, provisioning resources. This turns capacity planning from a headache into a manageable part of your development lifecycle.
Stage 1: Monitor and Measure Baselines
You can’t plan for tomorrow’s capacity if you don’t have a crystal-clear picture of today. The first step is to establish a performance baseline by constantly monitoring your application and infrastructure under normal conditions. This goes way beyond just watching CPU usage; it’s about deeply understanding the complete performance profile of your system.
Here’s what that looks like in action:
- Instrument Your Application: Get robust monitoring in place to collect the metrics that matter—response times, error rates, transaction throughput, and infrastructure health (CPU, memory, disk I/O).
- Define “Normal”: Dig into the data over time to learn your system’s rhythm. What does an average Tuesday look like? How does it compare to a quiet Sunday morning?
- Identify Current Limits: Watch how performance metrics bend and break as the load fluctuates. These initial numbers are the foundation for every forecast you’ll make later.
Stage 2: Analyze and Forecast Demand
Once you have a solid baseline, it’s time to look ahead. This stage is all about analyzing your historical data and business intelligence to forecast future demand. The goal is to predict how your traffic will grow and change, so you can have the right infrastructure ready long before you need it.
This is where you turn raw data into a strategic asset. For instance, if you can correlate past marketing campaigns with traffic surges, you can predict the impact of the next big promotion with much greater accuracy. Analyzing user growth trends helps you project the organic increase in load your system needs to handle next quarter or even next year. You’re connecting engineering data directly to business outcomes.
Stage 3: Model and Test Scenarios
A forecast gives you an educated guess. Modeling and testing are how you prove it’s right. In this critical stage, you take those forecasts and create “what-if” scenarios to throw at a staging environment. This is where you find your system’s true breaking points before your users do.
What-if modeling is where you systematically remove the uncertainty from capacity planning. It lets you safely simulate massive traffic spikes or potential failures, turning hypothetical risks into hard, actionable data.
This is where theory meets reality. You can see how the process flows from initial data to a concrete resource plan.
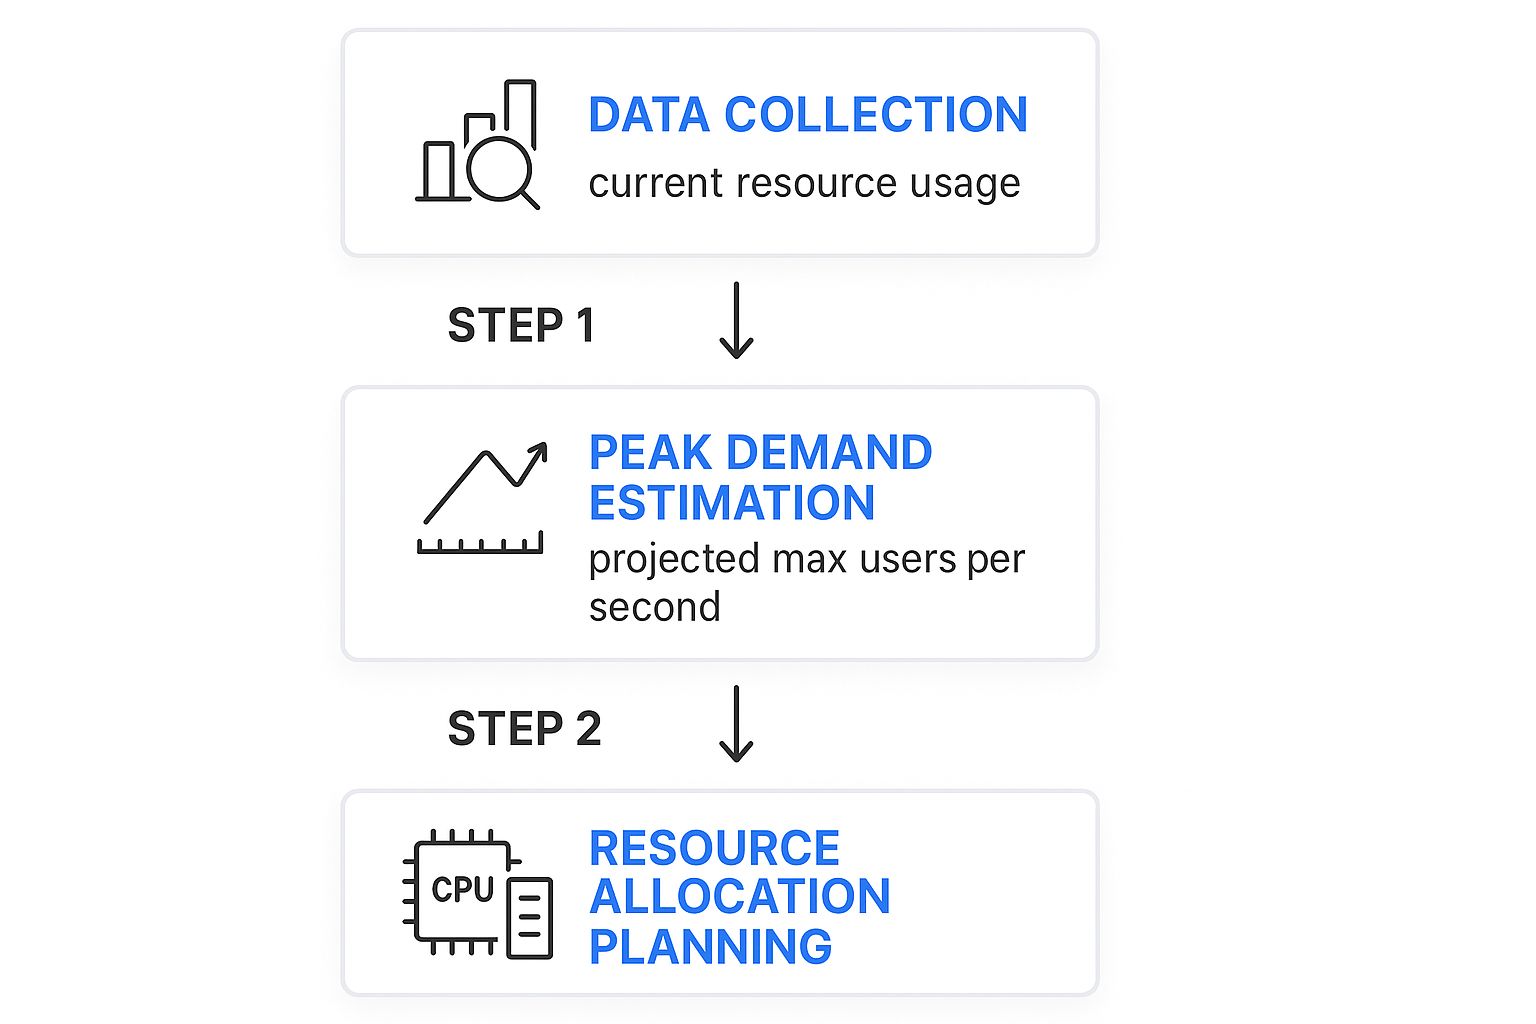
The logic is simple but powerful: use real data to estimate peak demand, then translate that into the specific resources you’ll need to allocate.
Stage 4: Provision and Tune Resources
This is the final stage, where you put your findings into action. Armed with data from your monitoring and validated models, you can provision and tune resources with confidence. Because your decisions are based on solid evidence—not guesswork—you can allocate exactly what’s needed without the wasteful cost of over-provisioning.
But this is never a “set it and forget it” task. As soon as you deploy new resources or apply a configuration change, the cycle starts all over again. You loop right back to Stage 1, monitoring the newly tuned system to establish its new baseline. This constant, iterative process ensures your capacity strategy stays perfectly aligned with your evolving business, creating a system that is both cost-effective and rock-solid reliable.
Key Metrics That Drive Capacity Decisions

When it comes to application capacity planning, there’s a simple truth every experienced engineer learns (sometimes the hard way): you can’t manage what you don’t measure. Guesswork is a recipe for outages or a bloated cloud bill. The right metrics, however, turn raw data into smart, actionable insights.
These numbers aren’t just abstract data points on a dashboard; they’re the vital signs of your application’s health. By watching them closely, you can see the story of your system’s performance and make data-driven decisions on when and how to scale. Let’s break down the key metrics you absolutely need to be watching.
User-Facing Performance Metrics
This is where the rubber meets the road. These metrics are the most direct reflection of your customer’s experience. If these numbers start to slip, your users feel it instantly.
- Response Time: The total time it takes for your server to get a request, process it, and send a complete response back. A snappy, responsive application keeps this number consistently low.
- Error Rate: The percentage of requests that fail, often showing up as 5xx server errors. A sudden jump in the error rate is a classic distress signal that your system is overloaded and can’t keep up.
A slow response time could point to an inefficient database query or application logic that buckles under pressure. Monitoring these gives you the earliest possible warning that you’re hitting a capacity limit, long before a small slowdown becomes a full-blown outage.
Infrastructure Health Metrics
While your users will never see these numbers, they form the bedrock of your application’s performance. These metrics track the health of the underlying hardware and virtual resources that power everything.
CPU Utilization: Think of the CPU (Central Processing Unit) as your server’s brain. This metric shows how much of its processing power is in use. If your CPU is consistently pinned above 80%, you have zero wiggle room for traffic spikes, and performance is guaranteed to degrade.
Memory Usage is another big one, tracking how much RAM your app is consuming. Run out of memory, and your application will slow to a crawl or crash entirely. Don’t forget Disk I/O (Input/Output), either—it measures how fast data moves to and from storage, which is often a major bottleneck for database-heavy applications.
System Throughput Metrics
Throughput metrics tell you one simple thing: how much work is your system actually doing? By measuring volume and rate, you get a clear picture of the load your application is handling at any given moment. This is essential for forecasting future needs.
A core metric here is Requests Per Second (RPS) or Transactions Per Second (TPS). This is the raw count of how many user requests or business actions your system can handle every second. Tracking RPS helps you map out your peak traffic patterns and, eventually, find your system’s absolute breaking point. This data is the foundation for any good performance test, as we cover in our comprehensive guide to load testing software.
Business Alignment Metrics
Finally, great capacity planning has to connect the dots between technical performance and business outcomes. These metrics help you justify infrastructure spend and prove that your resource strategy supports the company’s financial goals. They answer the critical question: “Are we spending our money wisely?”
A perfect example is Cost Per Transaction. This metric calculates exactly how much you spend on infrastructure for every valuable business action, like a customer purchase or a new user signup. The goal is to keep this cost low and predictable, even as you scale. By tracking it, you can ensure that growing your application remains profitable for the long haul.
Key Metrics for Capacity Planning by Category
To tie it all together, here’s a quick-reference table that organizes the most important metrics by what they tell you about your system.
| Metric Category | Key Metric | Why It Matters |
|---|---|---|
| User-Facing Performance | Response Time | Directly reflects user experience. Slow is bad. |
| Error Rate | Indicates system overload and user-facing failures. | |
| Infrastructure Health | CPU Utilization | Shows how “busy” your server’s brain is. Over 80% is the danger zone. |
| Memory Usage | Running out of memory causes crashes and instability. | |
| Disk I/O | Measures storage speed, a common bottleneck for databases. | |
| System Throughput | Requests Per Second (RPS) | Measures the raw volume of traffic your system is handling. |
| Transactions Per Second (TPS) | Tracks the rate of meaningful business actions. | |
| Business Alignment | Cost Per Transaction | Connects infrastructure spend directly to business value. |
Monitoring a balanced set of these metrics—from user experience all the way down to cost—is the only way to build a truly robust and efficient capacity planning strategy.
Let’s be honest: the days of using static spreadsheets and gut feelings for application capacity planning are long gone. That old-school, manual approach might have worked once, but it just can’t keep pace with the speed and complexity of today’s systems. Modern applications, especially those built on cloud-native architectures, need a much smarter, more forward-thinking strategy to handle resources well.
This shift has sparked a new generation of sophisticated planning tools. These tools help teams move from a defensive, reactive posture—scrambling to fix problems after they happen—to a proactive one. Instead of just waiting for the next outage, modern teams can now anticipate future needs with an almost spooky level of accuracy.
From Spreadsheets to Predictive Analytics
The real game-changer is the move from manual forecasting to automated, intelligent analysis. A spreadsheet can tell you what last month’s peak traffic was, but it’s clueless about what a new marketing campaign mixed with organic growth will do to your infrastructure next Tuesday. This is where modern tooling really shines.
Today’s capacity planning tools have evolved to integrate advanced tech, especially artificial intelligence (AI) and machine learning, to completely change how we manage resources. Predictive analytics, powered by AI, is now baked into these platforms to forecast future resource demands with incredible precision. This helps you get ahead of workload spikes before they even happen. You can see how different capacity planning software solutions stack up and find one that fits your needs.
This built-in intelligence allows systems to learn from historical data, uncovering subtle patterns a human would almost certainly miss.
- Seasonal Trends: It can spot recurring traffic patterns, like the predictable surge during holiday sales or even daily login rushes.
- Correlated Events: It connects the dots between a spike in user sign-ups and that promotional email you sent, helping you predict the impact of the next one.
- Anomalous Behavior: It flags unusual performance dips that could point to a hidden bug or a misconfigured service that’s about to cause trouble.
By understanding these little details, teams can finally make smart, data-driven decisions about when and how to scale their resources.
The Power of “What-If” Modeling
One of the most powerful features of these modern tools is what-if scenario modeling. This lets you simulate the impact of hypothetical events on your infrastructure—all in a safe, controlled environment. It takes abstract risks and turns them into hard data.
Instead of just wondering, “What happens if we lose a data center?” you can actually model it. You’ll see exactly how traffic would failover and which systems would buckle under the strain.
This is a fundamental shift in how we manage risk. For example, teams can now run simulations for all sorts of potential chaos:
- Sudden Traffic Surges: What happens if our new feature goes viral and traffic shoots up 5x in an hour?
- Infrastructure Failures: How does the system hold up if a core database server or an entire availability zone suddenly goes dark?
- Customer Growth: What’s the real impact of onboarding that huge new client we just signed?
These simulations give you clear, actionable answers. They show you precisely which components will become bottlenecks and how performance will suffer. This allows engineers to patch up weak points and validate their scaling strategies long before a real crisis hits. It’s how the best teams build truly resilient systems that can handle the unexpected, ensuring reliability and keeping users happy.
How to Simulate Realistic Loads with GoReplay
Theory and forecasting will only get you so far. To really know if your application can handle a real-world traffic spike, you need to hit it with everything you’ve got—under realistic conditions. This is where a powerful open-source tool like GoReplay helps you find your system’s breaking point before your users do.
Scripted tests are a good start, but they often miss the beautiful chaos of real users. People click in unexpected ways, abandon carts, and generate bizarre request patterns you could never script. Synthetic tests are clean and predictable; real user traffic is anything but.
The Power of Replaying Production Traffic
This is why replaying actual production traffic is so much more effective for load testing. When you capture the HTTP traffic from your live app, you get a perfect, high-fidelity recording of every single user interaction. It’s not a simulation of user behavior; it is user behavior.
GoReplay is built for this. It lets you “shadow” your production environment by passively listening to and recording all incoming traffic without hurting performance. You can then take that recorded traffic and unleash it on a staging or test environment. It’s an incredibly accurate way to validate your capacity models and make scaling decisions based on hard data, not just hopeful guesses.

The idea is simple but profound: capture real traffic, replay it against your test environment, and see what happens. This lets you test changes and verify performance with genuine user patterns.
The GoReplay Workflow for Capacity Testing
Using GoReplay for capacity planning is a straightforward process that gives you an almost scientific way to find your system’s absolute limits. You capture what’s happening live, then replay it at higher volumes.
Here’s how it works:
- Capture Live Traffic: First, deploy the GoReplay listener in your production environment. It sits on your server, quietly capturing all HTTP requests and saving them to a file without adding any noticeable overhead.
- Replay Against a Test Environment: Next, you take that file of recorded traffic and use GoReplay to replay it against a staging environment that mirrors your production setup. This is your safe sandbox for experimentation.
- Amplify the Load: Here’s where the magic happens for capacity planning. You can tell GoReplay to replay the traffic at 2x, 5x, or even 10x its original speed. This perfectly simulates a massive, sudden surge in traffic.
- Analyze the Breaking Point: As you crank up the load multiplier, you watch your key metrics—response times, error rates, CPU usage. Eventually, you’ll find the exact point where performance tanks and things start to break. That’s your true capacity limit.
By replaying and amplifying real traffic, you move beyond “what-if” scenarios and get definitive answers. You’re not just guessing what a 10x traffic spike looks like; you’re actually creating one in a controlled setting.
This data-driven approach takes all the guesswork out of your planning. If your system handles a 5x load just fine but falls over at 7x, you now have a concrete, measurable ceiling. You can learn more about why this is critical for boosting application performance with effective load testing and how it fits into a broader performance strategy.
This method gives you the confidence to make precise infrastructure changes. Let’s say you need to handle a 10x load for a big marketing launch, but your tests show you can only handle 7x. Now you know exactly how much more capacity you need. Your planning shifts from a reactive guessing game to a proactive, engineering-driven discipline, making sure your app stays solid no matter what you throw at it.
Best Practices for Proactive Capacity Management
Getting capacity planning right is about more than just running a few tests. It’s a cultural shift. You have to move your team from a reactive, “firefighting” mode to a proactive one where performance is baked into everyone’s workflow. It becomes a shared responsibility, not just a problem for the ops team when things go wrong.
The whole point is to make capacity planning a habit—something you do continuously, not just when you’re forced to. By building a few core practices into your daily work, you can create a system that’s resilient, cost-effective, and earns the trust of your users.
Integrate Planning into Your Development Lifecycle
The best teams don’t treat capacity planning as a special event. It’s just part of how they build software. The secret is to wire performance validation directly into your Continuous Integration/Continuous Deployment (CI/CD) pipeline.
Every single time a developer commits new code, it should automatically trigger load tests in a staging environment. This is often called continuous performance testing, and it gives you instant feedback on how that change affects system resources. You can spot performance regressions or potential bottlenecks long before they ever see the light of day in production.
Think of it this way: your pipeline becomes a performance watchdog. It ensures that every deployment is backed by real data, creating a safety net that protects your users from surprise slowdowns or outages.
Establish Clear Ownership and Accountability
Saying “capacity is everyone’s job” sounds great, but it usually means it’s no one’s job. If you want your strategy to actually work, someone has to own it and drive it forward. This doesn’t mean you need to hire a dedicated capacity planner, especially if you’re a smaller team.
Instead, you can:
- Designate a Capacity Lead: Pick a senior engineer or a DevOps lead to own the framework. Their job is to keep the monitoring, forecasting, and testing efforts on track.
- Form a Virtual Team: Pull together a small, cross-functional group with folks from development, ops, and product. This team can meet regularly to look at performance trends and plan for what’s next.
- Define Responsibilities: Write down exactly who is responsible for watching key metrics, running load tests, and deciding when to add more resources.
When ownership is crystal clear, capacity planning goes from being a vague idea to a concrete set of actions. It ensures crucial tasks don’t get dropped and that there’s always a steady hand guiding the strategy.
Foster a Culture of Performance Awareness
Tools and processes are only half the battle. A truly proactive approach comes from a culture that genuinely cares about performance. This means making performance data visible and easy to understand for everyone—from developers all the way to product managers.
A proactive culture is built on shared data and shared understanding. When everyone sees the direct link between code changes, system performance, and user experience, they naturally start making better decisions.
Put up dashboards showing key capacity metrics where everyone can see them. Celebrate performance wins. And when things go wrong, run blameless post-mortems so the whole team can learn together. When everyone is aligned on why performance matters, proactive capacity management just becomes the natural way you work.
The strategic value of this approach is powerfully illustrated by Amazon Web Services (AWS), a pioneer in cloud infrastructure. As millions of businesses migrated to the cloud, AWS faced the immense challenge of scaling efficiently without overcommitting resources. Their success hinged on forward-thinking application capacity planning, which enabled them to manage resource allocation across a vast network of global data centers. You can discover more insights about strategic capacity planning and its business impact. This proactive strategy is what allowed them to maintain reliability and cost-efficiency at a massive scale, setting a standard for the entire industry.
Got Questions About Capacity Planning?
Even with a solid plan, you’re bound to have questions when you start putting theory into practice. Let’s tackle some of the most common ones teams run into when they get serious about managing their application’s capacity.
How Often Should We Actually Do This?
Capacity planning isn’t a “set it and forget it” task. Think of it as a living process. A quarterly review and forecasting cycle is a great starting point for most applications.
But you also need to be ready to act based on events. A major product launch, a big marketing push, or a significant change to your architecture should all trigger a planning review. The best approach? Weave automated performance tests right into your CI/CD pipeline. That way, you’re keeping an eye on capacity impacts with every single deployment.
What’s the Single Biggest Mistake We Can Make?
Being purely reactive. Waiting for a performance problem or, worse, an outage to happen before you think about capacity is a recipe for disaster. This “firefighting” mode always leads to rushed, expensive fixes and erodes the trust you’ve built with your users.
A proactive strategy is non-negotiable for modern systems. When you build a process on continuous monitoring, trend analysis, and realistic load testing, you spot potential bottlenecks long before they ever impact a single customer.
Making that shift from firefighting to forward-thinking is the absolute core of great capacity management.
Is This Worth It for a Small Team?
Absolutely. A startup might not need the same complex enterprise tools as a giant corporation, but the principles of capacity planning are just as critical. In fact, for smaller teams, it’s an essential discipline for keeping cloud costs in check and avoiding wasteful overspending.
Simple monitoring and basic forecasting can make a huge difference. It helps you scale smartly, keep users happy, and manage your burn rate as you grow. You’re building a scalable foundation right from day one.
Ready to stop guessing and start testing with real traffic? The GoReplay open-source tool lets you capture and replay your production traffic to see exactly how your application holds up under a realistic load. Validate your capacity plans with confidence at https://goreplay.org.