Level Up Your API Performance
APIs drive modern applications, but can they handle the pressure? This list of top API load testing tools helps you uncover performance bottlenecks before they impact users. Discover eight powerful solutions—from open-source favorites like GoReplay, JMeter, k6, and Locust, to robust platforms like BlazeMeter, Artillery, Gatling, and LoadRunner—to ensure your APIs perform under stress. Learn about each tool and choose the best fit for your API load testing needs.
1. GoReplay: Real-World API Load Testing
GoReplay stands out among API load testing tools by leveraging real production traffic for highly realistic testing environments. This open-source tool captures and replays HTTP traffic, transforming real user interactions into actionable testing data. It’s a powerful solution for software developers, QA engineers, DevOps professionals, and enterprise IT teams seeking to proactively identify and resolve performance bottlenecks before they impact live systems. With GoReplay, you’re not simulating hypothetical scenarios; you’re testing against the actual behavior of your users, ensuring your APIs can withstand the demands of real-world usage. This approach provides unmatched confidence in your application’s ability to perform under pressure, making it a valuable addition to any API testing toolkit.
GoReplay’s core strength lies in its ability to capture live traffic and replay it with remarkable fidelity. This session-aware replay, combined with optimized TLS handling and robust connection pooling, accurately mimics complex user sessions, including authentication, cookies, and other session-specific data. This ensures your tests accurately reflect the nuances of real user behavior, revealing performance issues that might be missed by synthetic load testing tools. Furthermore, its scalable load testing capabilities allow you to amplify the captured traffic, simulating diverse real-world scenarios, from peak loads to sustained high-volume traffic. This enables you to thoroughly assess your API’s performance under various conditions, providing a comprehensive understanding of its resilience and scalability.
GoReplay’s integrated analytics dashboard offers real-time monitoring and insightful visualizations of user behavior, providing valuable data on response times, error rates, and other key performance indicators. These real-time insights empower teams to proactively address performance bottlenecks and optimize API performance. This proactive approach helps prevent potential outages and ensures a seamless user experience. For example, during a major infrastructure migration, GoReplay can capture traffic from the existing system and replay it against the new infrastructure, identifying potential performance issues before the migration goes live. Similarly, for high-traffic websites, GoReplay can simulate peak load scenarios based on real user behavior, ensuring the site can handle surges in traffic without degradation in performance.
GoReplay offers a robust free open-source version ideal for individual developers and smaller teams. This version provides the core functionality for capturing and replaying traffic, performing load tests, and accessing basic analytics. For enterprise-grade requirements, GoReplay Pro offers advanced features like traffic storage for later analysis, data masking for sensitive information, customizable security rules, WebSocket support, and priority expert support. This tiered approach makes GoReplay accessible to a wide range of users, from individual developers to large organizations. While the Pro version requires a commercial license with associated costs, the investment can be justified by the enhanced security, scalability, and support it provides. Contact GoReplay directly for specific pricing details.
From a technical standpoint, GoReplay is relatively straightforward to implement. It runs as a standalone application and requires minimal configuration to capture and replay traffic. However, for more complex scenarios involving advanced filtering, data manipulation, or integration with other testing tools, some technical expertise might be necessary. For instance, using middleware to modify requests or responses during replay can require familiarity with GoReplay’s scripting capabilities. GoReplay’s documentation provides comprehensive guides and examples to assist with various configurations and integrations. Compared to tools like JMeter or Gatling, which require more extensive scripting and configuration, GoReplay provides a more streamlined approach for leveraging real user traffic in load testing. However, for highly customized synthetic load testing scenarios, these tools might offer greater flexibility.
In summary, GoReplay’s ability to harness real user traffic for API load testing sets it apart. Its features like session-aware replay, scalable load generation, advanced analytics, and both open-source and enterprise-grade options make it a versatile tool for ensuring API performance and reliability. Whether you’re a developer testing a new API endpoint or an enterprise IT team preparing for a major infrastructure migration, GoReplay’s reality-driven approach provides valuable insights and unmatched confidence in your application’s ability to handle real-world demands. Visit https://goreplay.org to explore GoReplay and start leveraging real traffic for your API load testing needs.
2. JMeter
Apache JMeter is a powerful open-source, Java-based performance testing tool specifically designed for load testing and measuring the performance of web applications and APIs. While initially created for testing web applications, its capabilities have expanded to encompass a wide range of protocols, including HTTP, HTTPS, SOAP, REST, FTP, and even database connections via JDBC. This versatility makes JMeter a valuable asset for developers, QA engineers, and DevOps professionals seeking a comprehensive solution for API load testing. JMeter provides a user-friendly graphical user interface (GUI) for building test plans, yet also offers the flexibility of command-line execution, crucial for integration into Continuous Integration/Continuous Deployment (CI/CD) pipelines. Its ability to simulate heavy user loads and analyze performance bottlenecks makes it an essential tool for ensuring the stability and scalability of your APIs.
JMeter’s prominence in the realm of API load testing tools stems from its rich feature set and open-source nature. The tool supports multiple protocols, allowing you to test a variety of API endpoints. The comprehensive GUI simplifies the creation of complex test plans, incorporating various elements like thread groups, samplers, listeners, and assertions. Distributed testing, a key feature for simulating large-scale user loads, enables you to orchestrate tests across multiple machines, generating substantial traffic against your API. Real-time monitoring and extensive reporting features provide invaluable insights into performance metrics like response times, throughput, and error rates, enabling you to identify bottlenecks and optimize API performance. Moreover, a thriving plugin ecosystem extends JMeter’s functionality further, adding support for new protocols and integrating with other tools.
One of JMeter’s most significant advantages is that it’s completely free and open-source. This eliminates licensing costs, making it accessible to organizations of all sizes. A large and active community provides extensive documentation, tutorials, and support forums, ensuring that help is readily available when needed. This active community also contributes to the ongoing development and improvement of the tool. JMeter is highly configurable and extensible through its plugin architecture, allowing you to tailor it to your specific testing needs. Furthermore, it boasts cross-platform compatibility, running seamlessly on Windows, Linux, and macOS. For a more in-depth guide on using JMeter for REST API load testing, you can learn more about JMeter.
While JMeter offers a wealth of advantages, it’s also essential to be aware of its limitations. Being Java-based, JMeter can be resource-intensive and consume significant memory, especially when executing large-scale tests. The learning curve can be steep for beginners, particularly when dealing with complex test scenarios. The GUI can become sluggish when working with extensive test plans containing numerous elements. Finally, compared to some modern cloud-native load testing tools, JMeter’s cloud integration features are somewhat limited, requiring manual configuration and setup in cloud environments.
Despite these limitations, JMeter remains a popular and powerful choice for API load testing. Its open-source nature, comprehensive features, and extensibility make it a valuable tool for ensuring the performance and scalability of your APIs. If you’re looking for a cost-effective and feature-rich solution for API load testing, JMeter is definitely worth considering. You can download JMeter and explore its features from the official website: https://jmeter.apache.org/. Setting up JMeter involves downloading the Java Development Kit (JDK), configuring environment variables, and downloading the JMeter distribution. Once set up, you can begin building your test plans by adding thread groups, samplers for your API requests, listeners for monitoring performance, and assertions for validating responses.
3. k6
k6 is a powerful and flexible open-source load testing tool specifically designed for developers and DevOps teams. It shines in its ability to integrate seamlessly into modern development workflows, utilizing JavaScript for scripting, enabling teams to leverage their existing skills and knowledge to build robust and realistic load tests. This makes it particularly attractive for organizations invested in a “shift-left” testing approach, incorporating performance testing early and often in the development lifecycle. Its focus on performance, combined with its developer-friendly approach, makes it a compelling choice for API load testing. k6 stands out for its ability to generate high load with minimal resource consumption, ensuring accurate and reliable results without straining your infrastructure. This efficiency translates to cost savings, particularly when performing large-scale load tests. It’s built to handle diverse testing scenarios, supporting various protocols like HTTP/1.1, HTTP/2, WebSockets, and gRPC, covering the spectrum of modern API architectures.
One of the most significant advantages of k6 is its JavaScript-based scripting. Developers can leverage their existing JavaScript expertise and readily available libraries to create sophisticated and realistic load test scenarios. This allows for complex test logic, custom metrics, and seamless integration with other JavaScript-based tools and frameworks. This makes k6 ideal for testing complex API workflows, mimicking real-world user behavior, and validating performance under diverse conditions. For instance, you can simulate user logins, browse product catalogs, add items to a cart, and complete purchases, all within a single load test script, mirroring actual user journeys.
Furthermore, k6 excels in its CI/CD integration capabilities. Its command-line interface (CLI) allows for easy incorporation into automated build and deployment pipelines. This facilitates running load tests as part of the regular development process, ensuring continuous performance validation and catching performance regressions early. Thresholds can be defined within scripts to automatically mark tests as pass or fail based on performance metrics, enabling automated performance monitoring and alerting. Learn more about k6 and the principles of API load testing to better understand the significance of these features. This proactive approach helps maintain high performance and availability for your APIs.
k6 offers both cloud and on-premises execution options. While the core tool is open-source and free to use, the cloud offering provides additional features like distributed load generation, advanced analytics and reporting, and cloud-based test execution. This makes it scalable and suitable for various testing needs, from small-scale tests to large-scale performance simulations.
While k6 is a robust and feature-rich tool, it does have some limitations. Its primarily CLI-based interface might be less appealing to users who prefer GUI-based tools. While a browser-based interface is available for analyzing test results, the core interaction with k6 is through the command line. Also, while k6 boasts a vibrant and growing community, its ecosystem is still smaller than that of more established tools like JMeter. This might translate to fewer readily available plugins and extensions. Finally, while the core k6 offering is open-source, access to advanced features and distributed execution requires a paid subscription to their cloud service. This could be a consideration for organizations on a tight budget.
Pricing: Open-source (free) core with paid cloud-based features.
Technical Requirements: k6 runs on various platforms (Windows, macOS, Linux) and requires a supported version of Go.
In comparison to tools like JMeter, k6 offers a more modern and developer-centric approach. While JMeter might be better suited for users accustomed to GUI-driven tools and benefiting from a larger ecosystem, k6 shines with its JavaScript scripting, performance optimization, and seamless CI/CD integration. This makes it an excellent choice for teams already leveraging JavaScript and seeking a modern and efficient API load testing solution. The choice between the two often depends on the team’s technical skills, existing workflows, and specific testing requirements.
4. BlazeMeter
BlazeMeter is a powerful, cloud-based API load testing tool designed for businesses that need to ensure their APIs can handle high traffic and perform optimally under pressure. It’s built upon and extends the capabilities of the popular open-source tool Apache JMeter, offering a more streamlined and enterprise-ready solution. BlazeMeter provides a comprehensive platform for various performance testing needs, ranging from simple load tests to sophisticated simulations of real-world usage scenarios, making it an excellent choice for organizations requiring scalable and robust API load testing. If you’re looking for api load testing tools that can help ensure the reliability and performance of your critical APIs, BlazeMeter is worth considering.
One of BlazeMeter’s key strengths lies in its ability to simulate massive loads from geographically distributed locations. This allows you to test the performance of your API from the perspective of users around the world, identifying potential bottlenecks and performance issues specific to different regions. This is particularly crucial for global businesses or those targeting international audiences. Beyond its core load testing capabilities, BlazeMeter supports various other testing types, including stress testing to identify breaking points, spike testing to simulate sudden traffic surges, and volume testing to evaluate system capacity under sustained heavy loads. This flexibility makes it a versatile tool for diverse API testing needs.
BlazeMeter offers several key features that simplify and enhance the API load testing process. Its compatibility with existing JMeter scripts eliminates the need to rewrite tests, allowing teams to leverage previous work and quickly transition to a cloud-based environment. The platform also provides a user-friendly GUI for creating tests without requiring extensive coding knowledge, empowering non-technical users to contribute to performance testing efforts. Real-time monitoring and an advanced analytics dashboard provide comprehensive insights into API performance, enabling quick identification of bottlenecks and performance regressions. The integration with popular CI/CD tools facilitates incorporating load testing into automated workflows, ensuring that performance is continuously validated throughout the development lifecycle. Further integrations with Application Performance Monitoring (APM) solutions enhance the depth of performance analysis and provide end-to-end visibility into the application’s behavior under load.
While BlazeMeter offers numerous advantages, it also has a few limitations. As a subscription-based service, the cost can be a significant factor, particularly for smaller teams or startups with limited budgets. Open-source alternatives like JMeter itself offer greater flexibility and customization options, albeit at the cost of requiring more technical expertise and infrastructure management. BlazeMeter’s cloud-based nature means it relies on a stable internet connection, making offline testing impossible. Finally, while the basic features are relatively easy to use, mastering the more advanced functionality may require a learning curve.
BlazeMeter’s pricing follows a subscription model with various tiers to suit different needs. Specific pricing details are available on their website and are typically based on the number of virtual users, test duration, and included features. Technical requirements are minimal, as the platform is entirely cloud-based. Users primarily interact with the web interface, which is accessible through a modern web browser. Setting up a test involves uploading existing JMeter scripts or creating new ones using the GUI-based test builder. BlazeMeter’s documentation provides extensive guidance on configuring tests, defining load profiles, and analyzing test results.
Compared to similar api load testing tools like LoadView and k6, BlazeMeter shines in its enterprise-grade features and scalability. LoadView offers similar cloud-based load testing capabilities but may not match BlazeMeter’s comprehensive feature set and integrations. k6 is a popular open-source tool known for its developer-friendly scripting and integration with CI/CD pipelines, but it may require more manual configuration and infrastructure setup compared to BlazeMeter’s managed cloud environment. For organizations seeking a robust and scalable API load testing solution with enterprise-level features and support, BlazeMeter is a strong contender. It’s essential to evaluate the specific requirements of your project and budget to determine if BlazeMeter is the right fit. You can explore the platform and its features further by visiting their website: https://www.blazemeter.com/.
5. Artillery
Artillery is a modern, open-source load testing toolkit specifically designed for testing the performance and resilience of APIs, microservices, and web applications. Its focus on simplicity and developer-friendly design, combined with powerful testing capabilities, makes it a compelling option for developers and QA engineers looking to integrate performance testing into their workflows. Built on Node.js, Artillery offers a balance between ease of use and advanced features, allowing you to quickly get started with load testing and scale your tests as your needs evolve. This makes it a valuable tool for any team prioritizing API performance and reliability. If you are looking for an efficient and easy-to-use API load testing tool, Artillery deserves a place in your toolkit.
One of Artillery’s core strengths lies in its simple YAML-based configuration. This allows developers to describe complex test scenarios in a human-readable format, eliminating the need for complex scripting in many cases. Furthermore, Artillery allows you to extend the YAML configuration with JavaScript hooks. This offers flexibility to incorporate custom logic, dynamic data generation, and complex test scenarios, addressing the limitations of purely declarative configurations. For example, you can use JavaScript to generate unique user IDs for each virtual user in your test, simulate realistic user behavior, or handle authentication flows.
Artillery supports HTTP, WebSockets, and Socket.io protocols out-of-the-box, covering a broad range of modern application architectures. This broad protocol support makes Artillery suitable for testing REST APIs, real-time applications, and microservices that rely on persistent connections. This versatility allows developers to utilize a single tool for various testing needs, streamlining their performance testing strategy.
While the open-source version of Artillery provides robust functionality for small to medium-scale testing, Artillery Pro offers advanced features such as distributed load testing across multiple AWS regions. This capability is crucial for simulating large-scale user traffic from geographically diverse locations, providing a more realistic representation of real-world usage patterns. Real-time metrics and customizable reporting are also key features, enabling teams to monitor performance bottlenecks and analyze test results effectively. Artillery’s plugin architecture further enhances its extensibility, allowing developers to integrate with other tools and customize the testing environment. For instance, integrations with monitoring platforms like Datadog or Prometheus can provide deeper insights into system performance during load tests.
Compared to more comprehensive API load testing tools like k6 and JMeter, Artillery’s protocol support might seem limited. However, its focus on core protocols and ease of use makes it a more accessible option for many teams. k6 excels in its JavaScript-based scripting and extensibility, while JMeter boasts extensive protocol support and a mature ecosystem. Artillery sits comfortably in the middle ground, offering a balance between simplicity and functionality. While the ecosystem and integrations around Artillery are not as extensive as those of more established tools, the active community and good documentation provide ample support and resources.
Getting started with Artillery is straightforward. Installation is a breeze with npm or yarn, and the clear documentation provides comprehensive guides for creating and running your first load tests. Define your test scenarios in YAML, configure the desired load, and execute the test from your command line. Artillery integrates smoothly into CI/CD pipelines, facilitating continuous performance testing. This allows you to identify and address performance regressions early in the development cycle, contributing to a more robust and reliable application.
Artillery’s pricing model is based on a freemium structure. The open-source version is free to use and sufficient for many testing needs. Artillery Pro offers advanced features like distributed testing and dedicated support at a subscription cost, catering to organizations with more demanding performance testing requirements. Specific pricing details are available on the Artillery website.
In summary, Artillery offers a compelling solution for API load testing with its focus on simplicity, developer experience, and performance. Its YAML-based configuration, JavaScript extensibility, and support for various protocols make it a versatile tool suitable for a wide range of applications. While the open-source version is ideal for small to medium-scale testing, Artillery Pro unlocks advanced capabilities for larger organizations. If you’re looking for an API load testing tool that is easy to learn, quick to set up, and integrates well with your development workflows, Artillery (https://artillery.io/) deserves serious consideration.
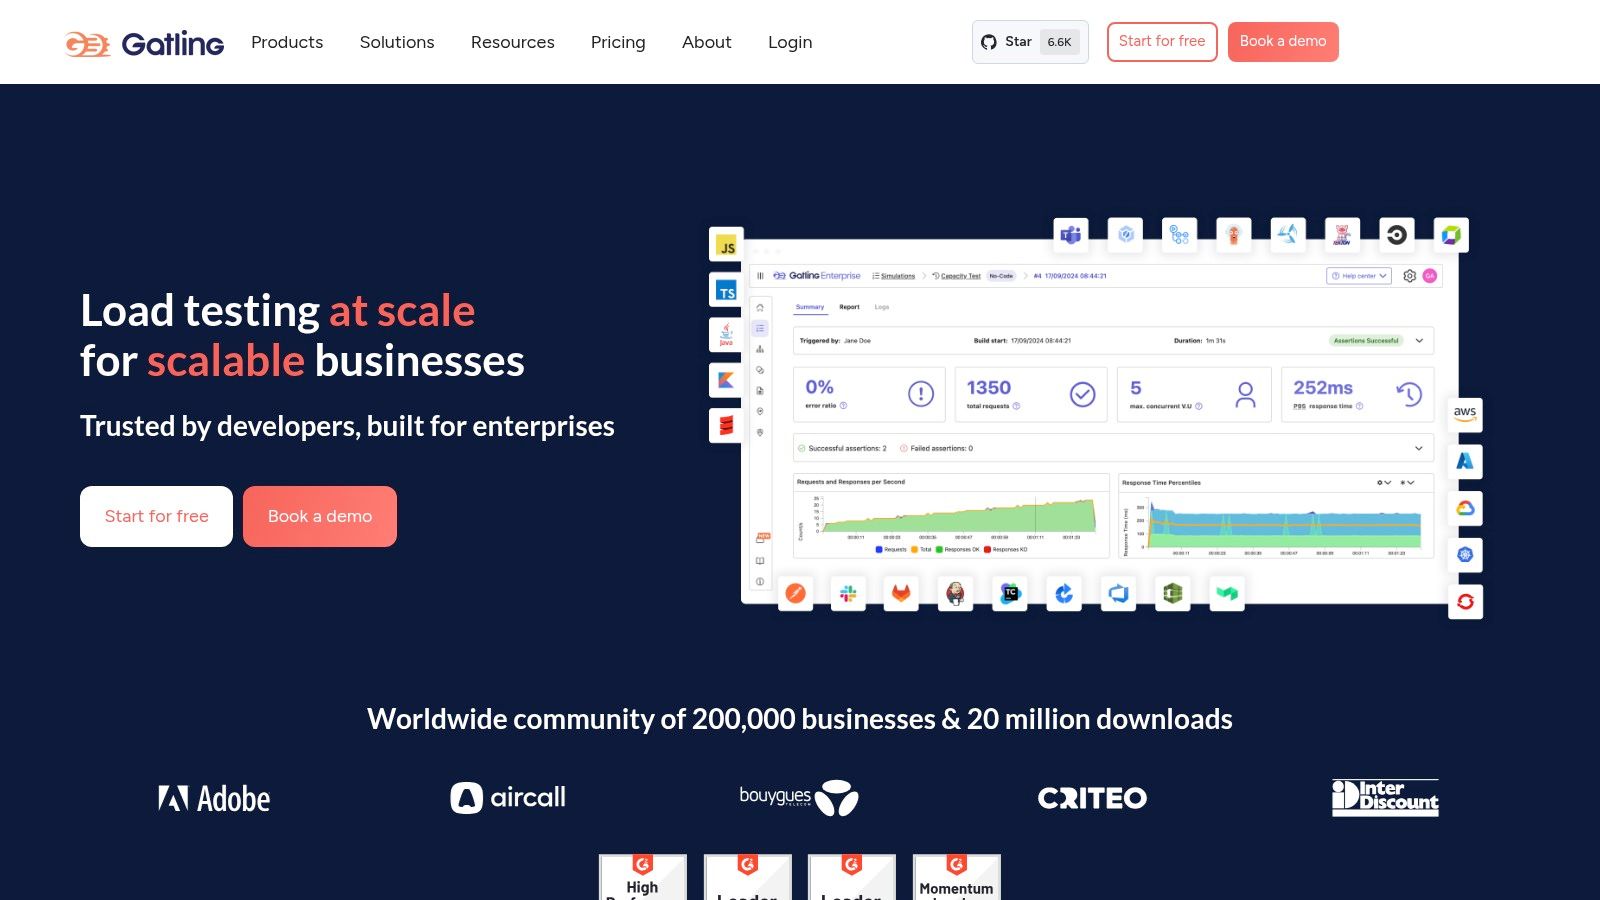
6. Gatling: High-Performance API Load Testing for the Discerning
Gatling stands out as a powerful and efficient open-source load testing framework specifically designed for rigorous API testing. Built on Scala, Akka, and Netty, Gatling excels in simulating high user loads with minimal resource consumption, making it an ideal choice for stress-testing your APIs and identifying performance bottlenecks. Its asynchronous architecture allows it to handle thousands of concurrent virtual users, providing valuable insights into how your APIs behave under pressure. This makes it an essential tool for software developers, QA engineers, DevOps professionals, and tech-savvy business leaders alike, ensuring their APIs can handle real-world traffic demands.
Beyond its robust performance, Gatling’s elegant Scala-based Domain Specific Language (DSL) empowers users to create highly readable and maintainable load test scenarios. While Scala knowledge is beneficial for advanced customization, the DSL’s structure is intuitive enough for those familiar with Java or other programming languages to grasp relatively quickly. Furthermore, its compatibility with Java opens doors for leveraging existing Java libraries within your test scripts. This allows for more complex and tailored test scenarios, going beyond simple API calls to simulate realistic user journeys and interactions with your application.
Gatling’s reporting capabilities are another significant advantage. It generates detailed HTML reports that include a wealth of performance metrics, visualized in clear and informative charts and graphs. These reports go beyond simple response times, providing insights into percentiles, requests per second, and error rates, enabling you to pinpoint performance bottlenecks and optimize your API design. The real-time monitoring feature allows you to observe test execution as it happens, providing immediate feedback and enabling proactive adjustments if necessary. This real-time feedback loop is particularly valuable in identifying and addressing performance issues quickly during development and testing phases.
Compared to simpler API load testing tools like JMeter, Gatling’s performance and reporting capabilities are generally considered superior, especially for high-load scenarios. JMeter, while user-friendly with its GUI, can struggle with resource consumption under heavy load. Gatling’s focus on asynchronous operations allows it to maintain high performance even with thousands of concurrent users. However, Gatling’s steeper learning curve and the requirement of Scala knowledge for advanced customization can be a barrier for some. Simpler tools like Postman or Rest-Assured might be more suitable for basic API testing or for teams lacking the resources to invest in learning Scala.
Gatling seamlessly integrates with popular build tools like Maven and Gradle and fits smoothly into CI/CD pipelines. This integration allows you to automate your load tests as part of your development workflow, ensuring that performance regressions are caught early. Gatling’s open-source version provides a comprehensive set of features for most load testing needs. For advanced features like real-time dashboards, integrations with enterprise monitoring tools, and dedicated support, Gatling Enterprise is available under a paid license. Pricing details for the Enterprise version are available upon request from Gatling Corp.
For setting up Gatling, you’ll need a Java Development Kit (JDK) installed. The Gatling bundle includes all necessary dependencies and can be downloaded directly from the Gatling website (https://gatling.io/). Once downloaded, you can start creating load test scripts using the bundled tools. Several resources, including documentation and tutorials, are available on the Gatling website to assist with the setup and script creation process.
In conclusion, Gatling deserves its place on this list due to its exceptional performance, comprehensive reporting, and focus on modern technologies. While the learning curve might be slightly steeper compared to simpler tools, the benefits in terms of performance and insights make it a compelling choice for serious API load testing. If you’re looking for a tool that can push your APIs to their limits and provide detailed performance metrics, Gatling is a powerful option worth exploring.
7. LoadRunner
Micro Focus LoadRunner is a venerable enterprise-grade performance testing platform widely recognized for its comprehensive capabilities in load testing APIs, web applications, mobile apps, and other enterprise software. Its long-standing presence in the market speaks to its robustness and ability to handle complex, high-volume testing scenarios. This makes it a powerful, albeit complex, tool for organizations needing in-depth API performance analysis. While it might be overkill for smaller projects or simple API tests, its extensive features and enterprise-grade support make it an ideal choice for large organizations with demanding performance requirements. For organizations seeking a robust solution for API load testing and have the resources to invest in it, LoadRunner offers a powerful suite of tools to ensure their APIs can handle the pressure.
LoadRunner’s strength lies in its breadth of protocol support, covering over 500 different protocols, including HTTP, SOAP, REST, and many others. This extensive support is crucial for testing a diverse range of APIs and ensures compatibility with various architectural styles. Its enterprise-grade reporting and advanced analysis capabilities provide deep insights into performance bottlenecks, allowing developers to pinpoint and address performance issues effectively. For API load testing, this translates into a granular understanding of endpoint performance under stress, helping identify slow database queries, inefficient code, or other bottlenecks that impact API responsiveness.
Features that make LoadRunner suitable for API load testing include:
- Extensive Protocol Support: Support for over 500 protocols, including all major API protocols (HTTP, REST, SOAP, etc.), allows LoadRunner to test virtually any API architecture.
- Enterprise-Grade Test Management: Features like scenario creation, virtual user management, and distributed load generation provide sophisticated control over complex load tests, simulating real-world user behavior.
- Advanced Performance Analysis: Detailed performance metrics, bottleneck identification tools, and customizable reports provide deep insights into API performance under various load conditions.
- Integration with Enterprise Tools: LoadRunner integrates with other enterprise tools, like application performance monitoring (APM) solutions, providing a holistic view of performance across the entire application landscape.
- Cloud and On-premises Deployment: LoadRunner can be deployed both in the cloud and on-premises, offering flexibility and scalability to suit different organizational needs.
Practical Applications and Use Cases:
LoadRunner excels in large-scale enterprise environments where rigorous API testing is paramount. For instance, it is well-suited for organizations operating high-traffic e-commerce platforms, financial institutions processing millions of transactions daily, or large-scale SaaS providers needing to guarantee API reliability and responsiveness under peak loads.
Comparing LoadRunner to Similar Tools:
While tools like JMeter offer open-source alternatives for API load testing, LoadRunner differentiates itself with its broader protocol support, advanced analysis features, and enterprise-grade support. While JMeter may be sufficient for smaller projects with limited budgets, LoadRunner provides a more comprehensive and robust solution for organizations needing to thoroughly test complex API interactions at scale.
Implementation and Setup Tips:
Implementing LoadRunner requires careful planning and configuration. It’s recommended to start with a clear understanding of your API architecture and performance goals. Creating realistic load testing scenarios that mimic real-world user behavior is crucial for accurate results. Leveraging LoadRunner’s scripting capabilities allows for highly customized tests that simulate specific API interactions and workflows.
Pricing and Technical Requirements:
LoadRunner licensing costs are substantial, and the pricing structure can be complex, varying based on virtual user counts and required features. Furthermore, running LoadRunner effectively requires significant infrastructure, potentially including dedicated load generators and controller machines. The technical requirements are dependent on the scale and complexity of your tests.
Pros:
- Comprehensive enterprise features and extensive protocol support
- Mature platform with a proven track record
- Advanced analysis and reporting capabilities
- Strong enterprise support and training resources
Cons:
- High licensing costs and complex pricing structure
- Resource-intensive and requires significant infrastructure
- Steep learning curve and complex setup
- May be overkill for simple API testing scenarios
Website: https://www.microfocus.com/en-us/portfolio/performance-engineering/overview
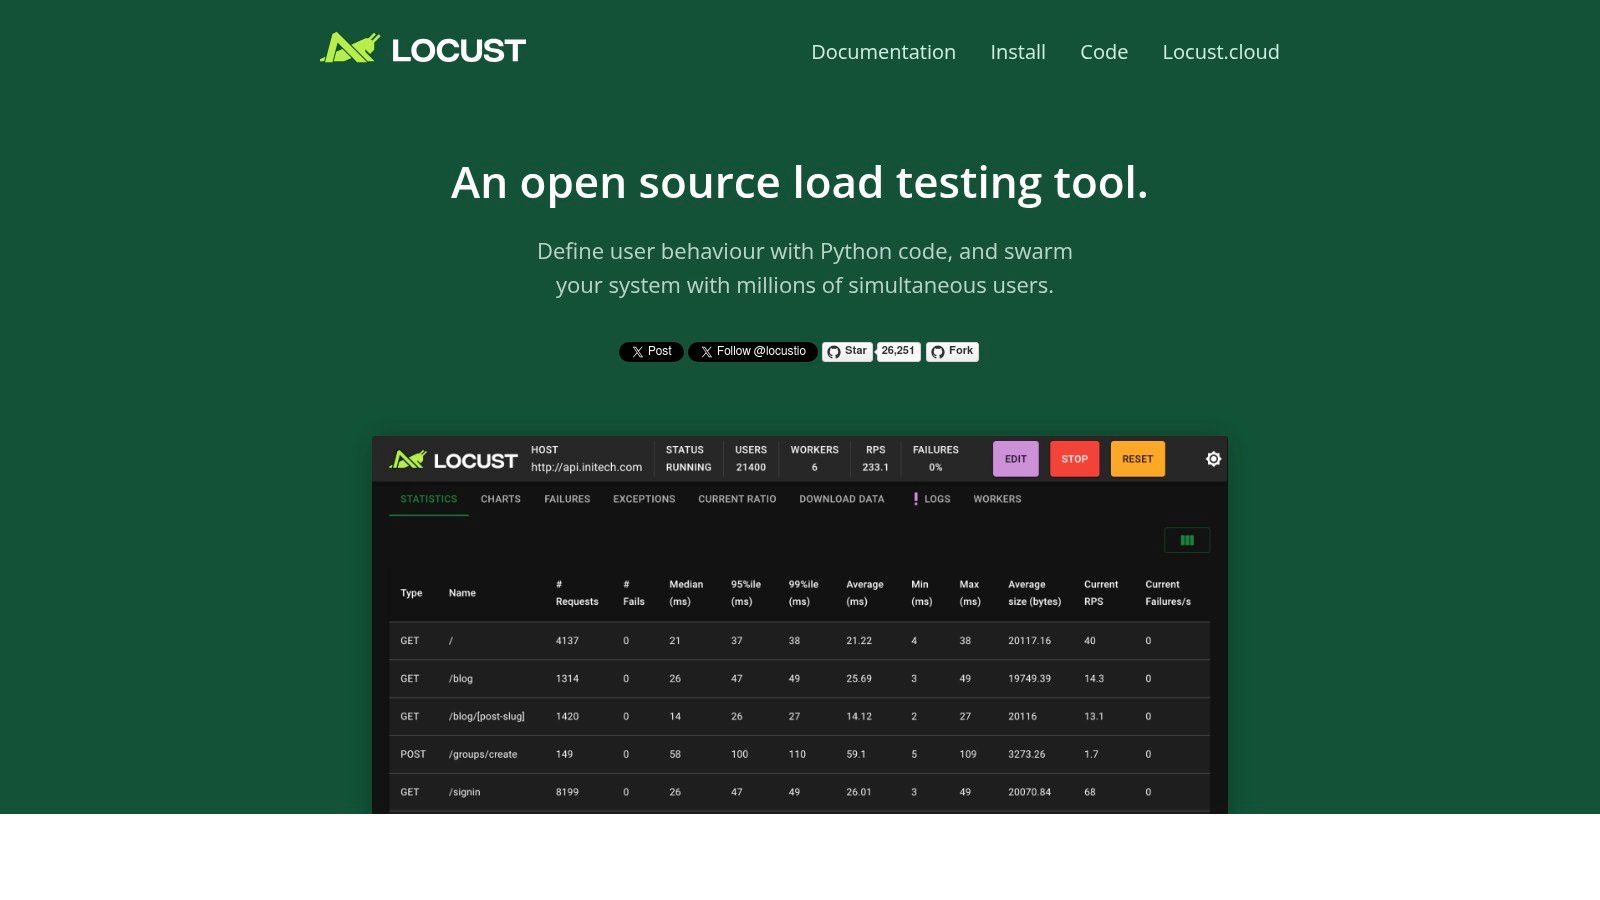
8. Locust
Locust is a powerful and flexible open-source load testing tool particularly well-suited for testing APIs. Unlike many other load testing tools that rely on clunky UIs or domain-specific languages, Locust empowers developers to leverage the full expressiveness of Python to define user behavior. This makes it exceptionally adaptable for simulating complex user scenarios and handling intricate API interactions. If you’re looking for a scriptable, scalable, and developer-friendly solution for API load testing, Locust deserves a place in your toolkit. Its ability to accurately simulate real-world user behavior and its distributed nature make it an excellent choice for ensuring your APIs can handle the expected traffic load.
Locust distinguishes itself through its event-driven architecture, allowing a single machine to simulate thousands of concurrent users. This efficiency stems from its use of lightweight, asynchronous greenlets instead of traditional threads. This approach minimizes overhead and maximizes resource utilization, making Locust highly scalable for simulating large user bases. Furthermore, Locust’s distributed testing capabilities allow you to easily scale your tests across multiple machines, generating even more substantial load and providing a realistic representation of high-traffic scenarios. This distributed approach is crucial for accurately assessing the performance and stability of your APIs under stress.
One of Locust’s key strengths lies in its Python-based scripting. This offers developers immense flexibility in defining user behavior, allowing for complex test scenarios that go beyond simple GET and POST requests. You can leverage Python’s rich ecosystem of libraries to handle authentication, data manipulation, and other custom logic within your load tests. For instance, you can easily integrate with data sources to parameterize your requests, simulate user-specific behaviors, or validate API responses against expected values. This level of control is rarely found in other API load testing tools and makes Locust a particularly powerful choice for sophisticated testing needs. Moreover, Python’s readability and familiarity make it easy for developers to quickly ramp up and create effective load tests.
Locust’s web-based UI provides real-time monitoring and control during test execution. While not as feature-rich as some commercial alternatives, it offers essential metrics such as the number of active users, request per second (RPS), response times, and error rates. This allows you to observe performance bottlenecks and identify potential issues in your API under load. The UI also enables you to adjust the user load on the fly, allowing for dynamic testing and the exploration of different traffic patterns.
Features:
- Python-based test scripting with full programming language capabilities
- Web-based UI for real-time monitoring and control
- Distributed testing across multiple machines
- Event-driven architecture supporting thousands of concurrent users
- Extensible through Python libraries and custom implementations
Pros:
- Highly flexible with Python’s full programming capabilities
- Easy to learn for Python developers
- Good scalability and distributed testing support
- Active open-source community and regular updates
Cons:
- Requires Python programming knowledge
- Limited built-in reporting compared to commercial tools
- No official commercial support
- UI is basic compared to enterprise solutions
Pricing and Technical Requirements:
Locust is open-source and free to use. It requires Python 3.7 or later.
Implementation and Setup Tips:
Installation is straightforward using pip install locust. Start by defining user behavior in a Python script, outlining the sequence of API requests and interactions. Then, launch the Locust web UI, configure the number of users and hatch rate, and start the test. Monitor the results in real-time and adjust the load as needed.
Comparison with Similar Tools:
Compared to tools like JMeter or Gatling, Locust’s strength lies in its Python integration, offering unmatched flexibility for complex scenarios. While JMeter and Gatling may provide more comprehensive built-in reporting and UI features, Locust’s scriptability makes it a powerful contender, especially for developers already comfortable with Python.
Website: https://locust.io/
Locust is a valuable addition to the API load testing landscape, providing a powerful and flexible alternative to traditional tools. Its Python-centric approach, combined with its distributed testing capabilities and real-time monitoring, makes it an excellent choice for developers and teams seeking a robust and adaptable solution for ensuring their APIs can handle the demands of real-world traffic.
API Load Testing Tools Feature Comparison
| Tool | Core Features / Capabilities | User Experience / Quality ★ | Value Proposition 💰 | Target Audience 👥 | Unique Selling Points ✨ |
|---|---|---|---|---|---|
| GoReplay 🏆 | Session-aware HTTP traffic capture & replay; TLS optimization; Scalable load testing; Advanced analytics | ★★★★☆ Robust & real-time insights | Free OSS with Pro tier for enterprise; cost for advanced features | Developers, QA, DevOps, Enterprise teams | Real user traffic replay; Enterprise analytics; Data masking; Priority support |
| JMeter | Multi-protocol testing; GUI and CLI modes; Distributed testing; Plugin ecosystem | ★★★☆☆ Powerful but resource-heavy | Completely free & open-source | Developers, QA, Test Engineers | Broad protocol support; Large community |
| k6 | JavaScript scripting; High-performance load generation; HTTP/2 & WebSocket support; Cloud/on-prem | ★★★★☆ Efficient & developer-friendly | OSS with paid cloud service | DevOps, Developers | JS scripting; Low resource use; CI/CD native |
| BlazeMeter | Cloud-based load generation; JMeter compatibility; Advanced analytics; CI/CD integrations | ★★★★☆ User-friendly cloud platform | Subscription pricing; Enterprise focus | Enterprises requiring scalable cloud testing | Global load generation; Drag-and-drop UI |
| Artillery | YAML + JS config; HTTP & WebSocket support; Distributed testing; Plugin extensibility | ★★★☆☆ Lightweight & fast | Free OSS; advanced distributed requires paid | Developers, Small to Mid teams | Simple config; Node.js-based; Cost-effective |
| Gatling | High-performance async design; Scala DSL; Detailed reports; CI/CD integration | ★★★★☆ Efficient with rich metrics | Open-source + paid enterprise | Developers, Enterprises | Scala-based DSL; Visual reports |
| LoadRunner | Extensive protocol support; Enterprise-grade; Advanced analysis; Cloud/on-prem options | ★★★★☆ Mature & comprehensive | High licensing costs | Large enterprises | Enterprise features; Wide protocol coverage |
| Locust | Python scripting; Web UI; Distributed testing; Event-driven | ★★★☆☆ Flexible & scripting-based | Free open-source | Python developers, QA teams | Python code-based; Good scalability |
Choosing the Right API Load Testing Tool
Selecting the perfect API load testing tool from the myriad of options available can feel overwhelming. This article has explored eight popular choices, from open-source solutions like GoReplay, JMeter, k6, Artillery, Gatling, and Locust, to commercial platforms like BlazeMeter and LoadRunner. Each tool offers unique strengths, catering to different needs and technical skill sets. Key takeaways include the importance of considering factors like open-source vs. commercial licensing, scripting language preference (JavaScript, Java, Scala, Go, etc.), reporting capabilities, and community support when making your decision. Remember, the best API load testing tools empower you to identify performance bottlenecks, optimize resource allocation, and ultimately ensure a seamless user experience.
Choosing the right tool hinges on understanding your specific requirements. For smaller teams or projects with limited budgets, open-source API load testing tools like JMeter or Locust could be ideal starting points. Larger enterprises or those with complex testing needs might benefit from the advanced features and dedicated support offered by commercial platforms like BlazeMeter or LoadRunner. Regardless of your choice, consider the learning curve associated with each tool, the scalability it offers for future growth, and the integration possibilities with your existing CI/CD pipeline. Implementing these tools effectively requires careful planning, realistic test scenario design, and ongoing monitoring to maximize their value.
By carefully evaluating your needs and exploring the diverse capabilities of these API load testing tools, you can equip yourself with the insights necessary to build robust and resilient APIs. The right tool will empower you to proactively address performance issues, ensure scalability, and deliver a high-quality user experience. Ready to simplify your API load testing and gain valuable insights into your system’s performance? Check out GoReplay, an open-source tool that lets you capture and replay real-world traffic for realistic load testing scenarios. Visit GoReplay to learn more and start optimizing your APIs today.