A Guide to Realistic API Automation Testing with Live Traffic
API automation testing is just what it sounds like: using software to automatically check if your APIs are doing what they’re supposed to. This whole process is meant to make sure your APIs work correctly, perform well, and stay secure, which in theory should speed things up by getting rid of manual testing.
But there’s a catch.
Why Your Current API Automation Testing Misses the Mark
If you’ve ever pushed code that aced every single scripted test, only to watch it crumble under real-world pressure, you know exactly what I’m talking about. There’s a huge gap between staging and production.
Your traditional api automation testing approach is probably giving you a false sense of security. It’s great for baseline checks, but these tests run in a clean, predictable, sterile environment—one that looks nothing like the chaotic reality of live user traffic.
This is where the subtle, yet critical, failures love to hide. Your tests are designed to follow the “happy path,” but they can’t possibly anticipate the randomness of real human behavior.
The Limits of Synthetic Tests
Think about it. Synthetic tests, whether you build them by hand in a tool like Postman or script them in a framework, are fundamentally based on prediction. You’re just guessing what users might do. This approach is terrible at replicating the complex, tangled sequences of API calls that make up a genuine user session.
For instance, a user might add an item to their cart, abandon it, immediately search for something else, and then come back to the original cart. That one workflow generates a very specific—and often stressful—sequence of API requests. Scripting every possible permutation like this isn’t just impractical; it’s impossible.
These conventional tests almost always miss:
- Unpredictable User Journeys: Real users are messy. They don’t follow scripts. They click around, go backward, and do things in weird orders, creating all sorts of edge cases your tests will never find.
- Concurrent Request Collisions: Your load tests might simulate 1,000 users signing up, but do they simulate 500 users signing up while 300 others are updating their profiles and 200 more are browsing products? This kind of concurrency is exactly where race conditions and deadlocks are born.
- Long-Tail Edge Cases: Sure, most of your traffic probably hits a few key endpoints. But what about those obscure, rarely-used API calls that only pop up under very specific conditions? Synthetic tests almost always overlook these.
The real problem is that scripted tests only verify what you expect to happen. True production resilience comes from testing against what actually happens—in all its messy, unpredictable glory.
The Pain of Production-Only Discoveries
What happens next is a frustratingly familiar cycle. The CI/CD pipeline glows green, signaling that every automated check passed. You deploy. For a little while, everything seems fine.
Then the alerts start firing. Latency is spiking, or worse, you’re getting flooded with 500 Internal Server Error logs.
Often, the root cause is a performance bottleneck or a logic bug that only shows its face when hit with the unique signature of real production traffic. Finding these issues after deployment is expensive, stressful, and terrible for the user experience. This is the exact gap that testing with real, captured traffic is designed to close—moving the discovery of these problems from production back into your pre-deployment workflow where it belongs.
Your Hands-On Setup for GoReplay Traffic Capture
Alright, let’s get our hands dirty. Theory is great, but the real fun begins when you start capturing live traffic. This is where your journey into realistic api automation testing truly kicks off, and it’s simpler than you might think. We’re talking about a few basic commands to get GoReplay listening in on your server.
GoReplay is just a lightweight binary you run on your server. It works by sniffing packets directly from a network interface, which means it barely adds any performance overhead. It’s completely non-intrusive—a huge plus compared to agents that force you to instrument your code.
Installing and Running GoReplay
First things first, you need to get GoReplay onto the server where your API lives. This could be a production box, a staging environment that mirrors production, or even your local development machine. Installation is usually as simple as downloading the right pre-compiled binary for your OS.
Once it’s there, you can start capturing traffic with a single command. The most basic version just tells GoReplay to listen on a specific port and dump everything it hears into a file.
For instance, if your API is chugging along on port 8080, you’d run this:
sudo gor --input-raw :8080 --output-file requests.gor
Let’s quickly break that down:
sudo: GoReplay needs root privileges to peek at the network interfaces.--input-raw :8080: This is the magic flag. It tells GoReplay to capture raw TCP traffic on port 8080.--output-file requests.gor: This is where all the captured goodness goes—a file namedrequests.gor.
That’s it. This one command starts recording every single request hitting your API, creating a perfect snapshot of real user interactions.
Choosing the Right Capture Method
Listening on a port is a great start, but sometimes you need to be more surgical. What if you have multiple services running on the same server? You can get more specific by telling GoReplay which network interface to watch.
By capturing from the network layer, you’re not just getting the “what” (the API request), but also the “when” and “how” (the timing, concurrency, and sequence). This rich context is what makes replaying this traffic so powerful for uncovering hidden issues.
On a Linux machine, you can run ifconfig or ip addr to see what network interfaces are available. Once you’ve found the right one (like eth0), you can tweak your command. This helps you filter out the noise and focus your capture on just the traffic you care about. For more advanced setups, you can check out our detailed guide on configuring testing environments.
This whole approach is part of a much bigger trend. The global automation testing market hit USD 32.70 billion in 2024 and is expected to explode to USD 129.27 billion by 2033. This massive growth shows a clear industry shift toward more effective and realistic QA. It’s also interesting to note that North America is leading the charge, holding over 38.7% of the market share.
Configuring Your Replay Environment
Now that you have a file full of captured traffic, you need a place to unleash it. Your replay environment should be as close to a carbon copy of production as possible, especially when it comes to infrastructure and application configs. This is the only way to get results you can actually trust.
Make sure your test environment has:
- Identical Application Version: Replay against the exact same code build that’s in production for regression testing, or a new build to see if you broke anything.
- Representative Database: You don’t need a full production copy (that’s often a huge security risk), but the structure and volume of data should be similar.
- Isolated Dependencies: Point your test environment to staging or mock versions of any third-party services. You really don’t want to be sending test data to live payment gateways.
Setting up this parallel environment is the final piece of the puzzle. It gives you a safe sandbox where you can replay real production traffic patterns without putting your live users at risk. With your requests.gor file in hand and a staging server ready to go, you have everything you need to start the replay.
Turning Raw Traffic Into Solid Test Cases
Capturing live traffic with a GoReplay listener is a great start, but that raw data is just the first ingredient. Think of it as a goldmine of real user behavior—it’s incredibly valuable, but you can’t just plug it directly into your API automation testing pipeline. Raw production data is often messy, full of dynamic, one-time values that will immediately break any replay attempt.
The real magic happens when you refine this raw data into a set of clean, repeatable, and reliable test cases. This transformation is what turns a simple recording into a powerful asset for regression and load testing. It’s all about filtering out the noise and programmatically handling the dynamic bits unique to every user session.
This simple flow shows how traffic gets from a live server to your test analysis.
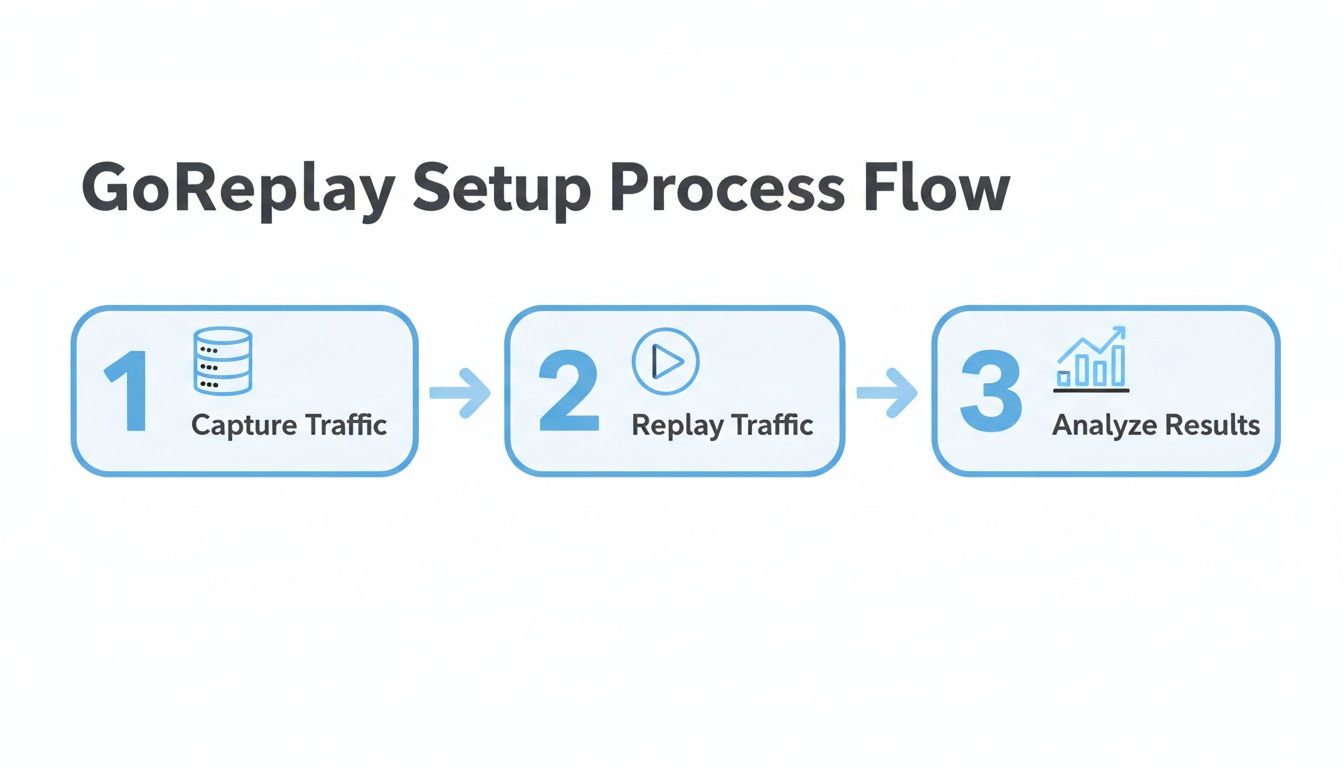
It’s a good reminder that capturing is just step one. The real value comes from replaying that traffic against a test environment and analyzing the results to find bugs before your users do.
Filtering for Precision
Your production environment handles all sorts of API calls, and not all of them are relevant to the feature you’re testing right now. Capturing everything creates massive, bloated test files that are a pain to manage. Luckily, GoReplay lets you apply filters during the capture process to zero in on exactly what you need.
For example, you can target requests based on their HTTP method or URL path. This is perfect for isolating traffic hitting a new microservice or a specific user flow, like the checkout process.
Common filtering strategies include:
- Targeting Specific Endpoints: Use flags to capture requests sent only to
/api/v2/usersor/api/v1/payments. - Filtering by HTTP Method: Isolate all
POSTrequests to test your resource creation logic orDELETErequests for cleanup jobs. - Excluding Static Assets: Filter out requests for images, CSS, or JavaScript. This keeps your test files lean and focused squarely on your API logic.
This kind of precision keeps your test suites targeted and efficient, which makes interpreting the results a whole lot easier.
Handling Dynamic Data with Middleware
Here’s the biggest hurdle you’ll face with traffic replay: dynamic data. I’m talking about things like session IDs, authentication tokens (like JWTs), CSRF tokens, and unique transaction IDs. A token captured from a live user session will be expired or invalid by the time you try to replay it, causing every single request to fail with a 401 Unauthorized or 403 Forbidden error.
This is where GoReplay’s middleware really shines. Middleware is basically a script that intercepts and modifies requests and responses on the fly during the replay. It’s the key to making captured traffic genuinely reusable.
You can write a simple script in a language like Python or Go to act as this middleware, performing powerful transformations that make your test cases rock-solid.
For instance, your middleware could:
- Strip Expired Tokens: It sees a replayed request and removes the old
Authorizationheader. - Request a New Token: It then makes a fresh call to your auth service to get a valid token for the test environment.
- Inject the New Token: Finally, it sticks the new, valid token back into the request header before sending it to your application.
You can apply this same logic to anything that needs to be current for a request to succeed—timestamps, unique IDs, you name it. You’re essentially rewriting history just enough to make it work in a test environment while preserving the core of the original user’s intent.
Protecting Sensitive User Data
This part is non-negotiable. You absolutely cannot replay raw production traffic containing Personally Identifiable Information (PII) into a non-production environment. It’s a massive security risk and a compliance nightmare waiting to happen. Data masking isn’t optional; it’s a requirement.
Your middleware script should also be responsible for finding and sanitizing sensitive data. Using regular expressions or simple string replacement, you can swap out fields like emails, passwords, names, and credit card numbers with fake, anonymized data. To really get this right, check out our detailed guide on masking production data for testing.
By filtering, transforming, and masking your captured traffic, you create a powerful and safe regression suite that truly reflects how your application is used in the wild. This ensures your API automation testing is both realistic and secure.
Here’s a quick-reference table for some of the most common GoReplay flags you’ll use for capturing and replaying traffic.
Essential GoReplay Capture and Replay Flags
| Flag | Purpose | Example Use Case |
|---|---|---|
--input-raw | Captures live HTTP traffic from a specific network port. | Capturing all web traffic coming into your server on port 80. |
--output-http | Forwards captured traffic to a specified HTTP endpoint. | Replaying traffic against your staging environment at http://staging.yourapi.com. |
--http-allow-url | Filters incoming traffic, capturing only requests that match a URL pattern. | Isolating traffic for your user API by capturing only /api/v1/users/.* requests. |
--http-disallow-url | Excludes requests that match a URL pattern. | Ignoring static assets by excluding all .css, .js, and .jpg files. |
--http-allow-method | Captures only requests with a specific HTTP method. | Focusing a test on creation logic by capturing only POST requests. |
--middleware | Executes an external script to modify requests/responses during replay. | Running a Python script to swap out expired auth tokens and mask user data. |
Getting comfortable with these flags is the key to tailoring your traffic capture and replay to fit your specific testing needs. They give you the control to create clean, focused, and secure test suites.
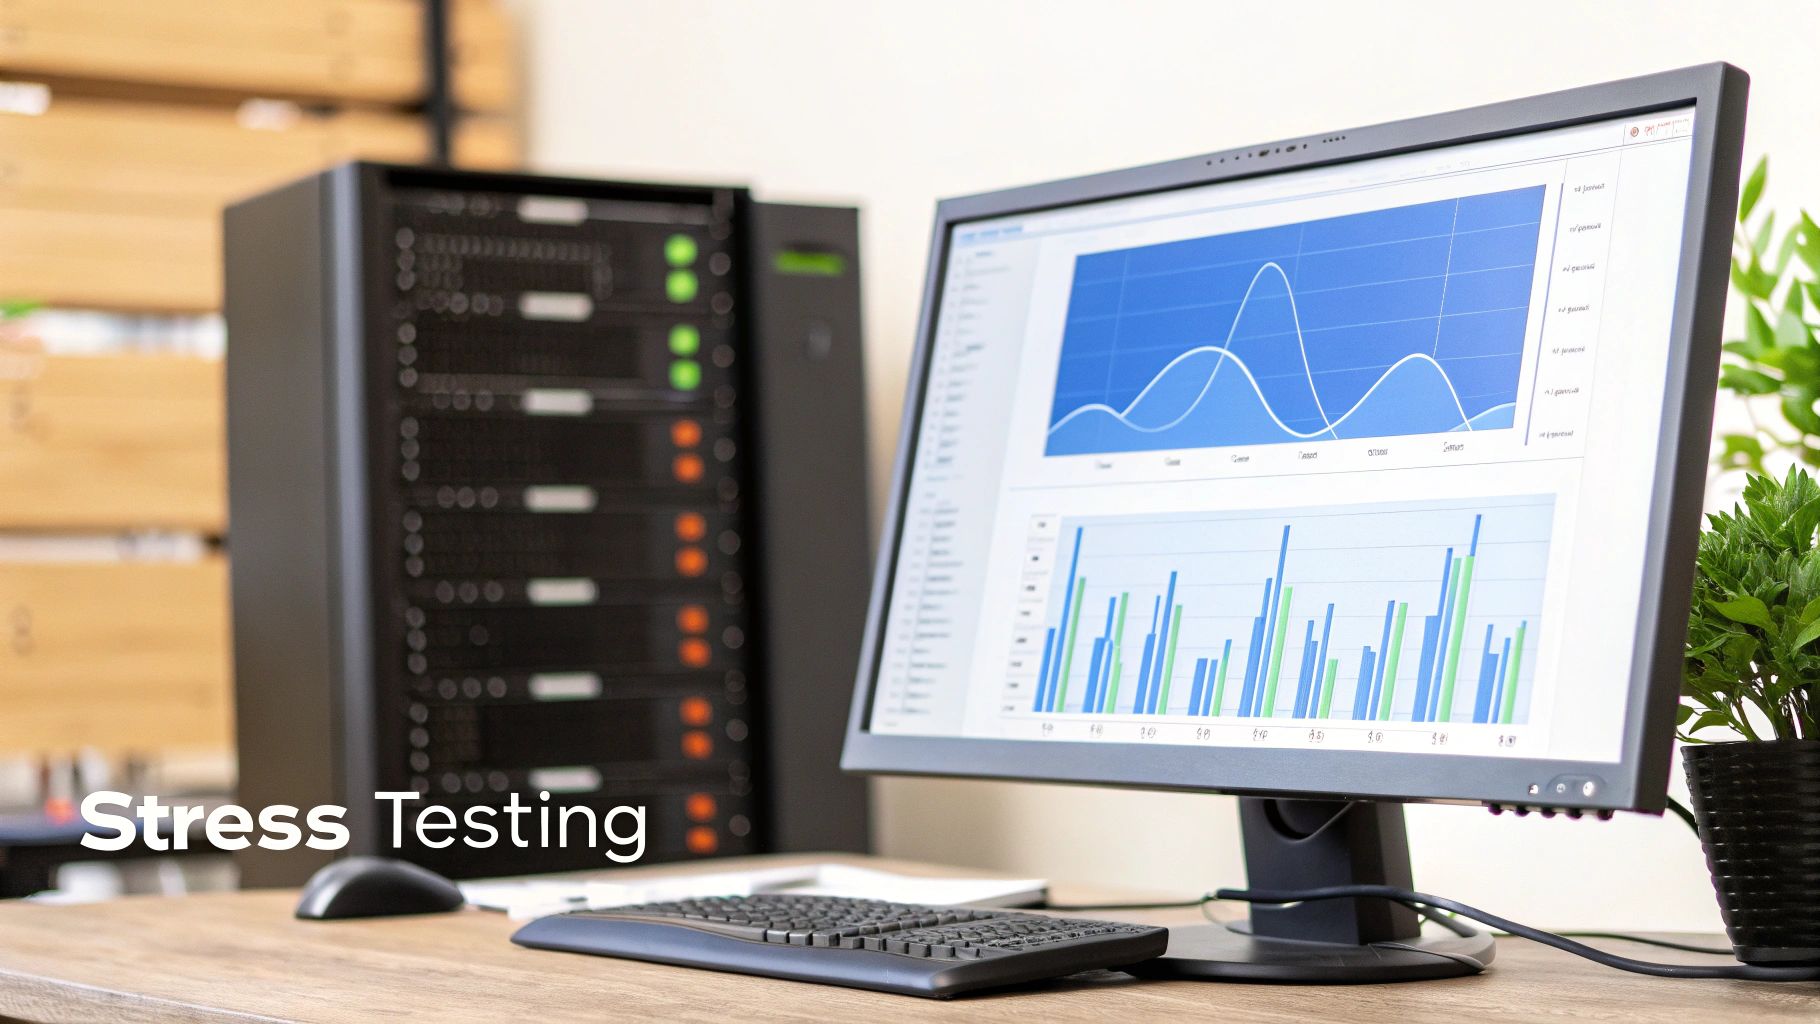
Simulating Real-World Load and Stress Tests
Regression testing with one-to-one replays is a great start, but the real magic happens when you push your system to its absolute limits. This is where we go beyond simple checks and start simulating the kind of intense, high-stakes events your application will face in the real world. Think of it as moving from a controlled sparring match to an all-out stress test that mirrors reality.
This drive for realistic api automation testing is exactly why the market is exploding. The global API testing market was valued at USD 4.074 billion in 2024 and is projected to skyrocket to USD 33.14 billion by 2035. That explosive growth shows just how much the industry needs tools that can validate API resilience before a single customer is affected. You can dig into more insights about API testing market growth in the full research.
By multiplying and manipulating captured traffic, you can find out exactly how your API will behave during a Black Friday sales surge, a viral marketing campaign, or a sudden, unexpected traffic spike. This isn’t just about hammering your server with random requests; it’s about replaying authentic user behavior at a massive scale to find the breaking points.
Amplifying Traffic for Peak Load Simulation
One of the most powerful things you can do with GoReplay is traffic amplification. You can take a capture file representing an hour of typical user activity and replay it at 10x or even 100x the original speed. This is how you simulate a massive, sudden flood of users without scripting a single test case.
For instance, to replay traffic at five times the original rate, you can use a simple rate-limiting flag:
gor --input-file "requests.gor" --output-http "http://staging.yourapi.com|500%"
That one command tells GoReplay to fire the recorded requests at your staging server at 500% of the captured speed. It’s an incredibly straightforward way to load test your entire stack—infrastructure, databases, and third-party integrations—with the genuine complexity of real user workflows.
Testing Stateful Journeys with Session Awareness
Most load testing tools fall flat when it comes to complex, stateful user journeys. Sure, they can simulate thousands of users logging in, but they completely miss the nuance of a single user’s multi-step journey, like adding items to a cart, applying a coupon, and checking out. Every step depends on the state created by the one before it.
This is where session-aware replays are indispensable. GoReplay can track and maintain user sessions, ensuring that a sequence of requests from one user in your capture is replayed in the exact same order. This is critical for uncovering those subtle, tricky bugs that only pop up in long-lived, stateful interactions.
To make this work, you just need to tell GoReplay what to look for as a session identifier. This could be:
- A specific cookie in the request header.
- A JWT token tucked into the
Authorizationheader. - A session ID embedded right in the URL path.
By keeping session integrity, you can properly test complex business logic that spans multiple API calls, guaranteeing a smooth user experience even when your system is under heavy load.
The real goal of load testing isn’t just to find the point of failure. It’s to understand how and why your system fails. Does the database become a bottleneck? Do you hit rate limits on a third-party API? Does memory usage spike uncontrollably? Answering these questions is how you build a truly resilient application.
Pinpointing Performance Bottlenecks
As you replay traffic and monitor your system’s key performance indicators (KPIs), you can pinpoint weaknesses with surgical precision. While you crank up the replay speed, keep a close eye on metrics like CPU usage, memory consumption, database query times, and API response latency.
When you see a metric suddenly degrade, you’ve likely found a bottleneck. And because you’re using real traffic, you can correlate that performance drop with the specific types of API requests being replayed at that exact moment. This direct link between a real-world usage pattern and a performance issue is something synthetic tests almost never provide, making your optimization efforts faster and way more effective.
Integrating Traffic Replay into Your CI/CD Pipeline
True automation isn’t something you run on the side; it needs to live and breathe inside your Continuous Integration and Continuous Deployment (CI/CD) pipeline. Embedding traffic replay directly into this workflow is how you graduate from occasional, manual load testing to a fully automated quality gate.
This single step transforms API automation testing from a periodic chore into an always-on defense for your user experience.
The whole point is to create a tight, rapid feedback loop. With every new build, your pipeline should automatically kick off a realistic test against your staging environment. This gives developers immediate insight into how their changes will hold up under real-world conditions. It’s the difference between finding a critical bug weeks after deployment and catching it just minutes after a code commit.
This isn’t just a “nice-to-have” anymore. The automation testing market, valued at USD 35.52 billion in 2024, is expected to hit USD 169.33 billion by 2034. That growth is being driven by industries like finance and retail where production failures are not an option. In fact, enterprises already report a 70% boost in software quality from solid automation. You can find more insights in this comprehensive automation testing market analysis.
Building Your Automated Quality Gate
Whether you’re using Jenkins, GitLab CI, or GitHub Actions, the concept is the same. Your pipeline configuration needs a new stage dedicated to traffic replay. This stage runs right after the application is successfully built and deployed to a staging or pre-production environment.
A typical workflow inside the CI/CD pipeline looks something like this:
- Code Commit: A developer pushes new code.
- Build & Deploy: The pipeline builds the code and deploys the new version to the staging environment.
- Trigger Replay Test: A script in the CI/CD job fires up GoReplay, pointing a pre-captured traffic file at your staging server.
- Analyze & Report: The pipeline watches the results. Did the error rate jump? Did latency climb past your threshold?
- Pass or Fail: Based on your rules, the pipeline either lets the build proceed toward production or fails it, instantly notifying the team.
This automated process ensures that no code that tanks performance or reintroduces old bugs ever reaches your users.
Integrating traffic replay into your CI/CD isn’t just about running tests automatically. It’s about making realistic, production-level performance validation a mandatory step for every single change, enforcing a culture of quality and resilience.
A Sample Pipeline Configuration
Let’s look at a simplified stage in a GitLab CI (.gitlab-ci.yml) file. This job would run after your deploy_staging job finishes.
replay_test: stage: test script: - echo “Starting API traffic replay test…” - gor —input-file “production-traffic.gor” —output-http “http://staging.myapp.com” —exit-after-process-ended - # Add logic here to check logs or monitoring dashboards for errors - # For example, use ‘curl’ to hit a metrics endpoint - # If error count > threshold, exit with a non-zero code to fail the pipeline needs: [“deploy_staging”]
This snippet shows the core command. A real-world setup would add more robust logic for checking the results. For instance, you could use an API to query a Prometheus or Datadog dashboard to validate performance metrics after the replay finishes.
Defining Success Criteria
So, how do you know if a replay test passed or failed? Your pipeline needs clear, quantitative rules. Simply finishing the replay isn’t good enough—you have to define what success actually looks like.
Your pass/fail criteria should focus on a few key indicators:
- Error Rate: The percentage of 5xx server errors should not go above a set baseline (e.g., 0.1%).
- Latency: The 95th percentile (p95) response time for critical endpoints must stay below a hard limit (e.g., 200ms).
- Resource Consumption: CPU and memory usage on the staging server shouldn’t spike beyond acceptable levels during the test.
By codifying these benchmarks into your pipeline, you create an objective and automated quality gate that shields your production environment from performance regressions. This is what makes your API automation testing strategy proactive instead of reactive.
Answering the Tough Questions on Traffic Replay
Switching from carefully scripted tests to the often-chaotic world of live traffic replay is a big jump. It’s a different way of thinking, and it’s natural for engineering teams to have some questions. Let’s tackle the ones that pop up most often when developers and QA engineers first get their hands on this approach.
Getting these concerns out of the way is the key to building real confidence in your testing strategy and unlocking what traffic replay can really do.
What About Sensitive Data Like Passwords or PII?
This is always the first question, and for good reason. It’s the most critical one. Replaying raw production traffic with real user PII into a staging environment is a massive security and compliance no-go.
This is where GoReplay’s middleware comes in. The whole idea is to intercept and transform the traffic before it ever touches your test server. You can write a simple script that acts as a gatekeeper, finding and replacing sensitive fields on the fly.
For instance, your middleware could easily:
- Spot a JSON key like
"password": "real_user_password123"and swap the value to"password": "REDACTED". - Anonymize an email from
"email": "[email protected]"to"email": "[email protected]". - Scrub credit card numbers and replace them with valid, but entirely fake, placeholder numbers.
The beauty of this is that the structure of the API request—the headers, the endpoints, the payload shape—stays identical to what happened in production. You get all the realism without any of the risk.
Can This Even Work with APIs That Need Auth Tokens?
Absolutely. In fact, this is one of the most powerful use cases. A common stumbling block with basic replay tools is authentication. A JWT or session token captured from a live user is almost guaranteed to be expired by the time you replay it, which just results in a wall of 401 Unauthorized errors. Useless.
Again, middleware is your best friend here. You can build a script that handles authentication dynamically for every single request you replay.
The workflow is surprisingly simple: your middleware intercepts a replayed request, yanks out the old, expired
Authorizationheader, and then makes a quick, fresh call to your test environment’s auth service to grab a brand new token. It injects that valid token back into the header and sends the request on its way.
This technique doesn’t just check a single endpoint; it allows you to simulate thousands of complete, authenticated user sessions at scale. You’re not only testing your application’s logic but also hammering your authentication system with a realistic load.
How Is This Different from JMeter or Postman?
This question gets right to the core philosophy. Tools like JMeter and Postman are fantastic for what they’re built for: creating scripted, predictable tests. They are indispensable for day-to-day functional testing, validating API contracts, and setting up baseline performance checks.
But they work based on prediction. You have to sit down and script out what you think your users are going to do.
GoReplay works on a totally different principle: it tests what your users actually did. It captures the messy, unpredictable, and concurrent behavior that is almost impossible to script by hand. These are the weird edge cases and complex user journeys that trigger the most subtle, hard-to-diagnose production bugs.
| Aspect | JMeter / Postman (Synthetic) | GoReplay (Traffic Replay) |
|---|---|---|
| Test Basis | Predicted user behavior (scripted) | Actual user behavior (captured) |
| Primary Use Case | Functional, contract, and baseline load testing | Realistic regression, load, and stress testing |
| Complexity | Models simple, linear flows easily | Captures complex, concurrent, multi-step journeys |
| Effort | High effort to write and maintain complex scripts | Minimal setup; effort is focused on smart middleware |
These approaches aren’t enemies; they’re partners. Use Postman for your initial functional validation, and then bring in GoReplay for pre-release regression and load testing to make sure your app is truly ready for the real world.
What If My Staging Database Doesn’t Match Production?
This is the reality for almost everyone. Having a complete, one-to-one copy of a production database in a test environment is usually impractical and a security headache. That’s okay. The goal of traffic replay isn’t to perfectly mirror the production data state, but to replicate the production behavior and load.
Your test database just needs a representative dataset. It should be structurally similar to production and contain enough variety to handle common scenarios.
When you replay traffic against this environment:
- Read operations (like
GETrequests) will validate your system’s logic and performance against this representative data. - Write operations (like
POSTorPUTrequests) will stress-test your application logic, infrastructure, and database with real-world write patterns.
The real magic happens when you uncover things like race conditions, deadlocks, and performance bottlenecks by hitting your system with the exact sequence and concurrency of calls seen in the wild. This is something you’ll almost never find with synthetically generated data, which is what makes traffic replay so effective at catching those tough, concurrency-related bugs.
Ready to stop guessing and start testing with real user traffic? GoReplay provides the tools you need to capture, replay, and analyze production traffic safely and effectively. Learn more and get started with GoReplay.