Master the apache web log: Analyze, Troubleshoot, and Optimize Your Server

An Apache web log is the official, minute-by-minute record of every single request your Apache web server handles. Think of it as the server’s personal diary, capturing a running story of every visitor interaction, content request, and potential hiccup as it happens.
Your Server’s Indispensable Diary

If your website were a busy airport, the Apache web log would be the air traffic control tower’s ledger. It meticulously records every arrival and departure—every visitor, every click, every piece of data served. This isn’t just a boring text file; it’s the raw data that tells the story of your server’s health, performance, and security.
These logs are absolutely critical for anyone managing a web property. When you learn to analyze this data, you stop guessing and start making informed decisions. It’s the difference between flying blind and having a full instrument panel.
The Core Value of Apache Logs
At its heart, an Apache web log provides a factual, chronological record of server events. This simple function is the bedrock of effective web administration, serving several vital roles. Without logs, you’d be completely in the dark about performance bottlenecks, brewing security threats, or user behavior until something catastrophic happens.
The data inside helps you answer the big questions:
- Who is visiting? IP addresses give you a sense of your audience’s origin.
- What are they accessing? You can see which pages and files are popular, which helps you decide what content to focus on.
- How is the server responding? HTTP status codes tell you if requests are successful (200 OK), hitting dead ends (404 Not Found), or causing server meltdowns (500 Internal Server Error).
- When are my peak traffic times? Timestamps reveal your busiest hours, so you can plan resources accordingly.
This kind of granular visibility is the first step toward building a resilient system. A solid logging strategy is a cornerstone of modern system monitoring and forms the foundation of strong observability best practices, allowing teams to proactively manage and improve their infrastructure.
From Data to Decisions
Ultimately, an Apache web log is more than a record—it’s a powerful diagnostic and strategic tool. Each line is a digital footprint. When you analyze them together, you uncover powerful insights that can help you optimize server performance by pinpointing slow resources or clunky scripts.
Logs are also your first line of defense in security. By watching for strange request patterns, you can spot potential threats like automated vulnerability scanners or brute-force login attacks. This transforms your logs from a passive history file into an active security sensor. In the sections ahead, we’ll dig into exactly how to read, manage, and act on this invaluable data.
How to Read Common Apache Log Formats
Trying to read an Apache log for the first time can feel a little like staring at hieroglyphics. You’re faced with a dense string of characters, numbers, and symbols that don’t immediately make sense. But once you learn the language, you’ll see it’s a perfectly organized system designed for absolute clarity.
Think of log formats like different kinds of shipping labels. A basic label tells you who sent the package and where it’s going. A more detailed one adds tracking numbers, a description of the contents, and special handling instructions. Apache uses standardized formats to make sure every “package” of data gets logged the same way, every time. The two you’ll run into most often are the Common Log Format (CLF) and the more powerful Combined Log Format.
Cracking the Code: The Common Log Format
The Common Log Format (CLF) is the original, old-school standard for Apache logs. It gives you the essentials of a request without bogging you down in extra details. It’s the foundational format that countless log analysis tools were built to understand from day one.
A standard CLF entry looks like this:
127.0.0.1 - frank [10/Oct/2023:13:55:36 -0700] "GET /apache_pb.gif HTTP/1.1" 200 2326
Let’s pull that apart, piece by piece:
127.0.0.1: This is the IP address of the client (the browser) making the request. It tells you exactly where the request came from.-: The first dash is a placeholder for the client identity (identd). This is a relic from the early internet and is almost never used today, so you’ll nearly always see a hyphen here.frank: This is the user ID of the person asking for the document, which only gets filled in if the resource is protected by HTTP authentication. If the page is public, this will also be a hyphen.[10/Oct/2023:13:55:36 -0700]: This is the timestamp, showing the exact moment the server finished handling the request, complete with the date, time, and timezone offset."GET /apache_pb.gif HTTP/1.1": This is the actual request line, and it contains three distinct parts: the HTTP method (GET), the specific resource being requested (/apache_pb.gif), and the protocol version (HTTP/1.1).200: This is the HTTP status code, and it’s one of the most important fields. A200means everything went smoothly (“OK”), while a404means the resource wasn’t found.2326: This is the size of the response sent back to the client, measured in bytes.
Getting More Context with the Combined Log Format
While the CLF is a great starting point, it’s missing some crucial pieces of the story. The Combined Log Format is an extended version that bolts on two extra fields: the referrer and the user agent. This simple addition makes it massively more useful for understanding user behavior and where your traffic is coming from.
Here’s what a Combined Log Format entry looks like:
127.0.0.1 - frank [10/Oct/2023:13:55:36 -0700] "GET /apache_pb.gif HTTP/1.1" 200 2326 "http://www.example.com/start.html" "Mozilla/5.0 (Macintosh; Intel Mac OS X 10_15_7)"
The first seven fields are exactly the same as the Common Log Format. The magic is in the two new fields at the end.
Key Takeaway: For any kind of modern web analytics, the Combined Log Format is almost always the right choice. The extra context from the referrer and user agent is priceless for figuring out how people find your site and what devices they use.
Let’s look at what’s new:
"http://www.example.com/start.html": This is the Referrer URL. It shows you the page the user was on right before they requested your resource—in other words, where they clicked the link from. If they typed your URL directly into their browser, this field will just be a hyphen."Mozilla/5.0 (Macintosh; Intel Mac OS X 10_15_7)": This is the User-Agent string. It’s a snippet of text that identifies the client’s browser, operating system, and other device details.
To help you keep track of all these moving parts, here’s a quick reference table breaking down the fields for both formats.
Apache Log Format Field Breakdown
| Field Name | LogFormat Directive | Description | Example |
|---|---|---|---|
| Client IP | %h | The IP address of the client making the request. | 127.0.0.1 |
| Client Identity | %l | The client’s identity, as reported by identd. Usually a hyphen. | - |
| User ID | %u | The authenticated user ID for the request. A hyphen if not authenticated. | frank |
| Timestamp | %t | The time the server finished processing the request. | [10/Oct/2023:13:55:36 -0700] |
| Request Line | "%r" | The request method, resource, and protocol, enclosed in quotes. | "GET /index.html HTTP/1.1" |
| Status Code | %>s | The HTTP status code returned to the client (200 for success). | 200 |
| Response Size | %b or %B | The size of the response in bytes. | 2326 |
| Referrer | "%{Referer}i" | The URL that linked to the requested resource. (Combined Format only) | "http://www.example.com/" |
| User-Agent | "%{User-agent}i" | The browser and OS identification string from the client. (Combined Format only) | "Mozilla/5.0 (Windows NT 10.0)" |
Once you understand these formats, you can stop seeing a cryptic wall of text and start seeing a story. You can tell not just what was requested, but how a visitor got there and what technology they were using—painting a much richer, more complete picture of what’s happening on your server.
Configuring and Managing Your Log Files
Left unchecked, an Apache web log is a bit like a diary that never runs out of paper—it just keeps growing. Forever. Eventually, it will eat up all your disk space and become so massive that trying to analyze it is practically impossible. Taming your logs isn’t just a good idea; it’s a core part of server administration that keeps your infrastructure healthy and your data useful.
The first step is simply knowing where to look. While the exact path can change depending on the setup, most Linux distributions stick to a predictable pattern.
- On Ubuntu/Debian systems, you’ll almost always find them in
/var/log/apache2/. - On CentOS/RHEL systems, the go-to directory is typically
/var/log/httpd/.
Of course, these are just the defaults. The real source of truth is your Apache configuration file, where the CustomLog directive lets you decide exactly where these files live.
Customizing Log Location and Format
Apache doesn’t lock you into the default settings. You can get incredibly specific about what data you capture and where you send it, all by tweaking a couple of directives in your main configuration file (usually httpd.conf or apache2.conf).
Two directives are your best friends here:
LogFormat: This lets you create a custom format string and give it a convenient nickname. Want a log that only captures the visitor’s IP and the URL they requested? You can define that here.CustomLog: This directive puts your custom format to work. You tell Apache where to write the log file and whichLogFormatnickname to use for it.
For instance, you could set up a special log format just for tracking user agents and write it to a separate file. This is perfect for specialized troubleshooting without bloating your primary access log with extra data.
This flowchart shows how the two most common built-in Apache log formats relate to each other.
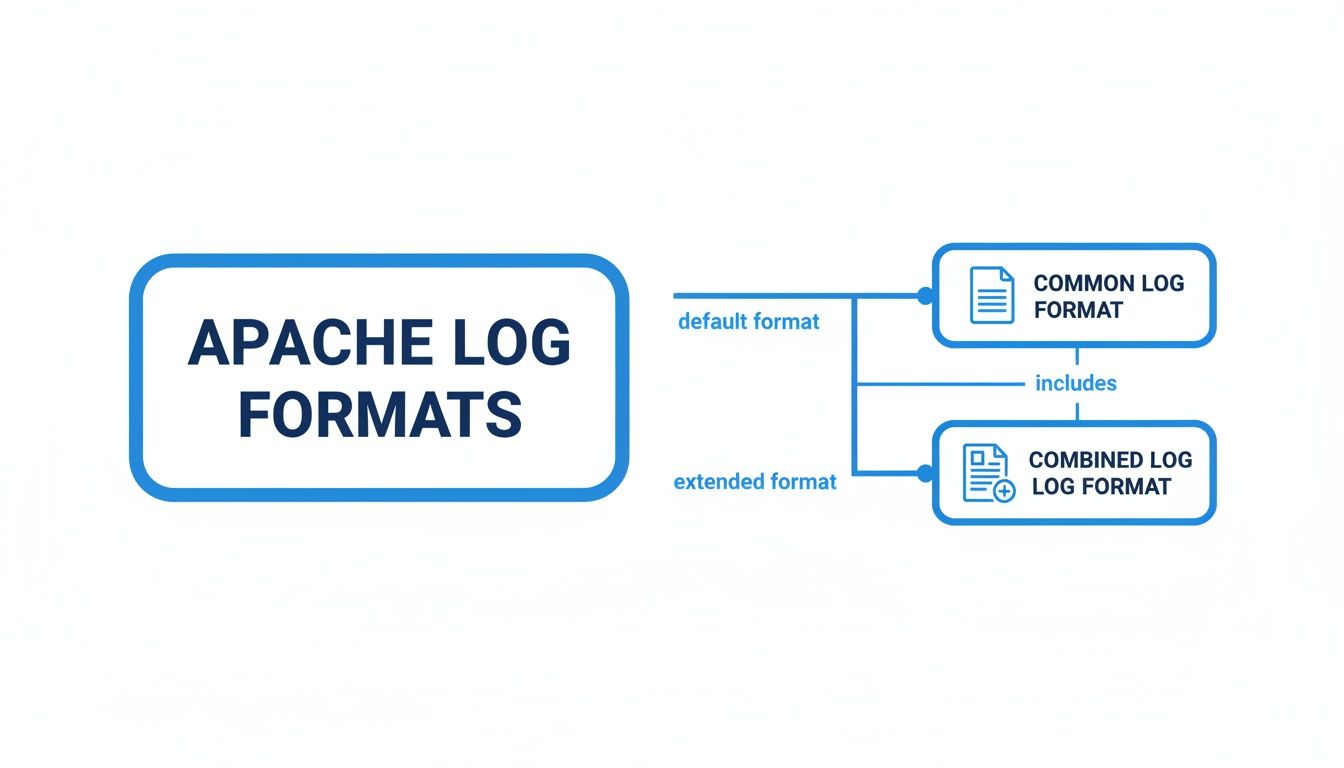 As you can see, the Combined Log Format is really just the Common Log Format with valuable referrer and user-agent information tacked on at the end.
The Critical Process of Log Rotation
If you do only one thing to manage your logs, make it rotation. Log rotation is the automated process that stops your log files from growing into monsters. Think of it as archiving old diary entries to make room for new ones.
Without rotation, a single log file will eventually fill your entire hard drive and crash your server. It’s not a matter of if, but when.
A moderately busy server can easily log 10,000 requests per megabyte. A site getting a million requests a day will spit out around 100 MB of raw log data daily. If you’re using the basic Common Log Format, that balloons to roughly 3 GB every single month. You can dive deeper into how this high-volume data source works by reading the insights on how Apache log telemetry works on learn.netdata.cloud.
Log rotation isn’t just about saving space; it’s about maintaining server health and making your data usable. A 50 GB log file is practically impossible to open or search, but fifty 1 GB files are easy to manage.
Here’s how the rotation process usually works:
- The current log file (
access.log) gets renamed (e.g., toaccess.log.1). - A new, empty
access.logfile is created in its place. - Apache gets a signal to start writing to the new file.
- Older logs (like
access.log.1) are often compressed to save even more space (becomingaccess.log.1.gz). - After a set time, the oldest log files are automatically deleted.
On most Linux systems, a handy utility called logrotate handles all of this for you. By setting up a simple logrotate configuration, you can define exactly when and how your logs are archived, keeping your server running smoothly and your data ready for analysis.
Turning Raw Log Data into Actionable Insights
Your Apache web log is a goldmine of data, but in its raw state, it’s just a wall of text. The real magic happens when you start parsing this data to paint a clear picture of your site’s performance, traffic patterns, and overall health.
Think of it like a detective’s notebook—all the clues are right there, but you need the right tools to piece them together and solve the case.
Fortunately, you don’t need a complicated setup to start digging. Simple but powerful command-line tools, likely already on your server, can give you surprisingly deep insights in seconds. They’re perfect for quick spot-checks without the overhead of a big analysis system.
Quick Analysis with Command-Line Tools
For fast answers, the command line is your best friend. These utilities are lightweight, incredibly fast, and flexible enough to filter and count log entries however you need.
grep: This is your go-to search tool. It scans log files for lines matching a specific pattern, letting you instantly find all the404 Not Founderrors in your access log.awk: Think ofawkas a smart column slicer. It breaks each log line into fields (like the IP address or status code) and lets you perform actions on them.sortanduniq: This dynamic duo helps you count things.sortputs the lines in order, anduniq -ccounts how many times each unique line shows up.
Chaining these tools together lets you answer critical questions on the fly. For instance, you can find the top 10 IP addresses hammering your server with a single command. It’s a fantastic way to spot unusually high traffic from a single source, which might point to a misbehaving bot or scraper.
Visualizing Data with Advanced Tools
While command-line tools are great for quick queries, they don’t really show you the bigger picture. When you need to spot trends over time or share insights with your team, you need something more visual. This is where dedicated log analysis platforms come in.
These tools ingest your raw Apache web log files and transform them into interactive dashboards, graphs, and charts. They do the heavy lifting of parsing and aggregating the data so you can spot anomalies and patterns at a glance.
Key Insight: Shifting from raw text files to visual dashboards is a fundamental change in how you analyze data. You move from asking specific questions (“How many 404s did we have yesterday?”) to exploring broad trends (“Is our error rate creeping up month-over-month?”).
Popular choices for this include:
- GoAccess: A fantastic open-source tool that gives you real-time web log analysis right in your terminal or as a self-contained HTML report. It’s incredibly fast and simple to get running.
- The ELK Stack (Elasticsearch, Logstash, Kibana): A powerful, enterprise-grade solution for collecting, searching, and visualizing log data. It’s highly scalable but does require more setup and management.
- Splunk: A commercial platform known for its powerful search and reporting features, often used in larger organizations for operational intelligence.
This screenshot from GoAccess shows how it can instantly turn your raw log data into a clean, easy-to-digest dashboard.
The dashboard gives you an immediate summary of key metrics like unique visitors, requested files, and HTTP status codes, making it simple to get a pulse on your server’s activity. To dive deeper into different tools and strategies, check out this guide on how to analyze web traffic.
By picking the right tool for the job—whether it’s a quick command-line search or a comprehensive dashboard—you can turn the abstract data points from your Apache web log into a clear narrative. This story tells you who your visitors are, how they behave, and how your server is performing, giving you the insights needed to make meaningful improvements.
When your website starts to act up, or worse, goes down entirely, your Apache web logs are the first place you should be looking. They’re the digital crime scene, holding every clue you need to piece together what went wrong. Instead of guessing, you can use the logs to trace a direct, data-driven path from the first symptom straight to the root cause.
Think of yourself as a detective. Every log entry is a clue, and the HTTP status codes are your first and most important lead. See a sudden flood of 404 Not Found errors? That’s a dead giveaway you’ve got broken links somewhere. By filtering your logs for those entries, you can see exactly which pages users were trying to reach and, more importantly, which referring pages sent them down that broken path.
Diagnosing Common Error Codes
Different status codes point to completely different problems. While 404 errors are about missing content, the far more critical 5xx series means something is broken on the server itself. These are the errors that can take your entire site offline.
500 Internal Server Error: This is the classic, generic “something broke” message. Your error log is absolutely essential here. It will often contain the exact script, database query, or configuration line that failed, giving your development team a smoking gun.503 Service Unavailable: This usually means your server is either overloaded with traffic or down for maintenance. A quick look at the access log can tell you if a massive traffic spike from a single IP is the culprit, which could point to a denial-of-service attack.403 Forbidden: This one’s simple: a user tried to access something they don’t have permission for. A spike in these could signal misconfigured file permissions or, more nefariously, a bot trying to probe for restricted directories.
By isolating and understanding these codes, you can stop saying “the site is broken” and start delivering specific, actionable diagnoses.
A sudden increase in error rates is a powerful early-warning signal. A site that normally has a 0.1% error rate (1 error per 1,000 requests) that suddenly jumps to 2% has experienced a 20x increase—a clear indicator of a significant problem that requires immediate attention.
Spotting Patterns Beyond Status Codes
Truly effective troubleshooting goes beyond just looking at individual error codes; it’s about spotting patterns. Your Apache web log lets you connect the dots and see the bigger picture. For instance, are all your 500 errors coming from requests to a single PHP script? That’s a strong sign the problem is inside that script, not the entire server.
This is exactly why monitoring error rates over time is a standard operational practice. A gradual creep in 4xx and 5xx responses per hour can tip you off to degrading performance or a subtle misconfiguration long before a full-blown outage hits. This kind of proactive analysis, all based on the hard data in your logs, is what separates a reactive admin from a proactive one. You can find more insights on using logs as an early warning system on last9.io.
Ultimately, your logs tell the story of your server’s health. When you learn to read that story, you gain the ability to diagnose issues with speed and precision, keeping downtime to a minimum and your users happy.
Finding Security Threats Hidden in Your Logs

Beyond just debugging and performance tuning, your Apache web log is a frontline security sensor. It captures the digital fingerprints of every request, including malicious ones. When you learn to read these logs with a security mindset, they transform from a passive record into an active threat detection tool.
Think of it like a security camera feed for your server. Most of the time, it’s just showing you the usual, everyday traffic. But once you know what to look for, you can spot suspicious behavior before it turns into a real incident. This is all about shifting your focus from performance metrics to patterns that scream “attack.”
Spotting Common Attack Signatures
Attackers almost always leave a trail. Many of the most common web attacks have predictable signatures that, once you start filtering for them, become glaringly obvious in your logs. Learning to recognize these patterns is the first real step toward hardening your defenses against both automated bots and manual hacking attempts.
You’ll want to focus your analysis on a few classic attack vectors:
- SQL Injection Attempts: Keep an eye out for requests containing SQL keywords like
UNION,SELECT, or the classic' OR 1=1 --right in the URL parameters. These are dead giveaways that someone is trying to mess with your database. - Cross-Site Scripting (XSS): Search your logs for entries where
<script>tags or JavaScript event handlers (likeonload=) are crammed into the request strings. This is a clear sign of an attempt to inject malicious code into your pages. - Vulnerability Scanning: Notice a single IP address making rapid-fire requests for a long list of non-existent files or well-known vulnerable paths like
/wp-admin/or/phpmyadmin/? That’s the signature of an automated scanner probing your site for weak points.
By actively watching for these signatures, you can identify and block malicious IPs before they ever find a real vulnerability. It’s a proactive stance that’s absolutely essential for maintaining a strong security posture.
Identifying Malicious Traffic Patterns
A single log entry tells you one thing, but analyzing broader traffic patterns can reveal much more sophisticated threats. Some attacks aren’t about a single malicious request but a flood of seemingly normal ones designed to completely overwhelm your server’s resources.
This is where your Apache web log really shines. It’s one of the best data sources for spotting large-scale exploitation and scanning, feeding directly into your incident response workflow. Automated scanners can generate millions of requests a day, and log analysis tools can chew through that data to pinpoint the worst offenders. For more details on hardening your server, you can check out resources like the Apache server security bulletins on ampcuscyber.com.
Look for these common patterns:
- Denial-of-Service (DoS) Attacks: This usually looks like an impossibly high number of requests coming from one or just a few IP addresses in a very short period. The goal is simple: exhaust your server’s resources and take it offline.
- Brute-Force Login Attempts: Filter for repeated POST requests to your login pages that keep resulting in error or redirect status codes. A high frequency from a single IP is a classic sign of a brute-force attack trying to guess passwords.
- Aggressive Web Scraping: While not always malicious, aggressive scraping can kill your site’s performance. You can spot it by finding a single user-agent downloading content at an inhuman speed, often completely ignoring your
robots.txtrules.
Apache Logs: Your Questions Answered
When you start digging into Apache web logs, a few practical questions always come up, especially around performance and just managing the sheer volume of data. Let’s tackle the big ones.
What’s the Real Difference Between Access and Error Logs?
Think of your access log as the friendly front-desk clerk of your website. It notes every single person who comes through the door, whether they just peeked in or stayed for a while. It’s a complete record of every HTTP request, successful or not, giving you the full story of your traffic.
The error log, on the other hand, is the security guard’s incident report. It only gets an entry when something goes wrong—a script bombs out, a configuration file is broken, or a file permission stops a request dead in its tracks. When you’re troubleshooting, the error log is the first place you should look.
My Log Files Are Huge! What Do I Do?
This is a classic problem. Sooner or later, log files grow so massive they eat up disk space and bring any analysis tool to its knees. The answer is simple and universal: log rotation.
Log rotation is just an automated cleanup process that keeps your logs from growing forever. Here’s how it usually works:
- The current log file (say,
access.log) gets renamed to something likeaccess.log.1. - Apache starts fresh with a new, empty
access.log. - The old file,
access.log.1, gets compressed to save space (becomingaccess.log.1.gz). - After a certain amount of time, the oldest compressed logs are automatically deleted.
On nearly every modern system, a tool like logrotate handles this for you. You just set it and forget it.
Does Logging Everything Slow Down My Server?
Yes, but usually not by much. Every bit of information you write for each request takes a little more disk I/O and a few more CPU cycles.
For most servers, the standard Combined Log Format has a tiny, almost unnoticeable impact. It’s only when you get into creating hyper-detailed custom logs with dozens of fields per request that you might see a performance hit, especially on a site with massive traffic.
The insights you get from the Combined format are almost always worth the minuscule performance cost. My advice is always to log what you need first and only scale it back if you can prove logging is the bottleneck. It’s all about finding that sweet spot between having enough data to solve problems and keeping things running smoothly.
Ready to make sure your applications are truly production-ready? With GoReplay, you can capture and replay real user traffic to test your system’s stability and performance before you deploy. Eliminate the risks and guarantee a flawless user experience. Find out how to secure your updates at https://goreplay.org.