
What Is Throttling and How to Test It

You deploy a change, traffic rises, and the server doesn’t crash. Instead, requests begin taking longer, queues grow, clients retry, and a few users report that the application appears to hang. The dashboards show elevated latency rather than an obvious outage, while downstream services start returning errors.
That behavior often leads teams to ask, what is throttling, and whether it signals a broken system or a deliberate protection mechanism. In production, the answer depends on where the limit is applied, what triggered it, and whether the system delays work, rejects it, reduces processing speed, or shuts down to prevent damage.
Understanding Throttling as a System Defense Mechanism
A sudden traffic spike doesn’t always produce an immediate failure. A service may continue accepting connections while its worker pool, queue, database, or dependency reaches a safe operating boundary. Requests then wait longer, retries add more work, and the system starts looking unhealthy even though its processes remain alive.
Throttling is a traffic-control technique that smooths demand by slowing or queuing requests instead of rejecting them outright. That makes it different from a hard request cap. Rate limiting sets a maximum number of requests within a time window, while throttling manages the speed at which work is processed when demand exceeds what the service can safely handle. The distinction is described in this comparison of API rate limiting and throttling.
Why a controlled slowdown can be safer
A service that accepts every request at full speed can push saturation into a shared database, a remote API, or a message broker. Once that dependency slows, callers often retry, creating a retry storm. Fan-out operations can multiply the pressure because one incoming request may trigger several downstream calls.
Microsoft describes throttling as a control loop that uses low-latency signals from infrastructure, applications, and individual principals. Those signals help a service cap resource use while continuing to meet its service-level objectives under sudden or sustained load. The implementation may reject or delay work, but the decision should be based on current capacity and health rather than a static guess. See the Microsoft throttling pattern guidance for the distributed-systems perspective.
The most useful design is usually selective. If one tenant, user, queue, or dependency is consuming the available capacity, throttle that principal or path rather than slowing every customer. Precise counters and health signals make that possible.
Practical rule: A controlled delay is useful only when clients understand it. Expose meaningful telemetry, honor retry guidance, and prevent waiting requests from consuming unlimited resources.
Throttling also has a planning cost. It can preserve continuity when capacity can’t expand quickly enough, but it may increase latency and complicate user expectations. Reliability managers responsible for these trade-offs can use actionable content for reliability managers when defining operational policies and failure responses.
The Different Faces of Throttling Across Environments
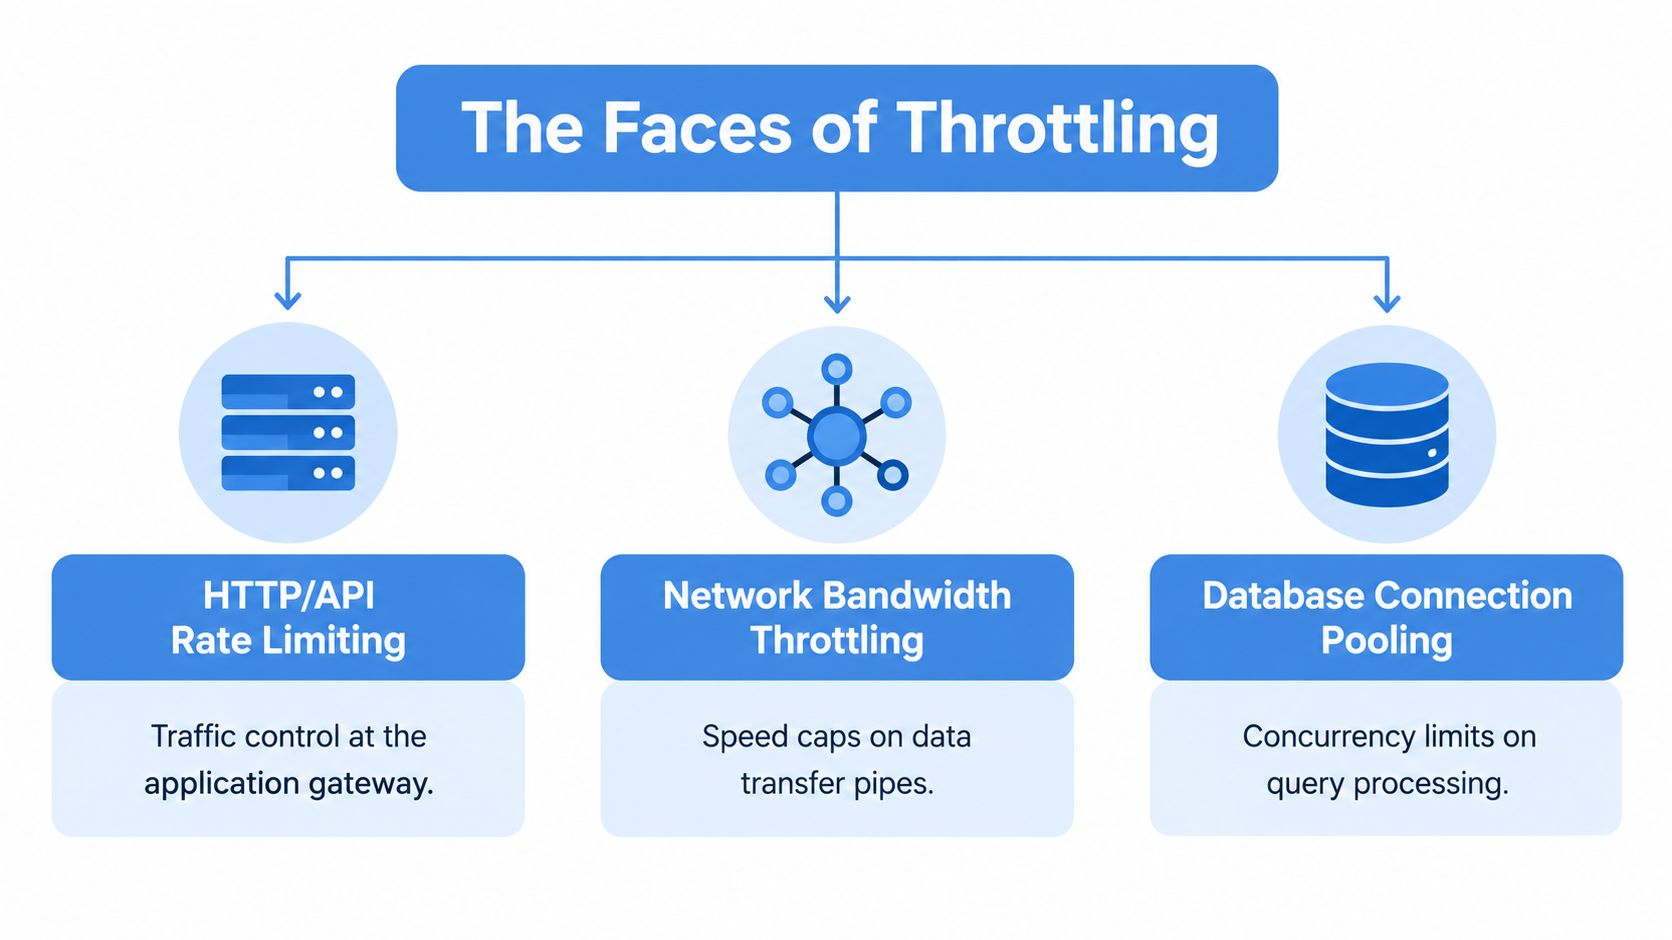
The word throttling describes several mechanisms that behave differently at different layers. An API gateway may delay requests, an ISP may restrict transfer speed, and a CPU may reduce its clock to stay within a thermal budget. Treating these as the same incident leads engineers toward the wrong diagnostic tools.
HTTP and API traffic
At the application edge, throttling controls how quickly the service admits or completes work. An API gateway can pace requests, constrain concurrency, or place excess work into a queue. The goal is to protect request handlers and downstream dependencies from a burst they can’t safely absorb.
This layer produces application and network evidence. You might see queue depth rising, response latency increasing, or requests delayed without an immediate increase in process failures. A hard rate limit, by contrast, commonly produces HTTP 429 Too Many Requests after a defined request limit is crossed, as described in the rate limiting and throttling reference.
Database connection pools are another form of concurrency control. They prevent every incoming request from opening work against the database at once. The visible symptom may be slow queries or waiting application threads, so you need pool occupancy, wait time, and query latency to separate database contention from an upstream gateway policy.
Network bandwidth policies
Network throttling limits how quickly data moves through a connection or service path. An ISP may apply a policy to differentiate subscriptions, enforce data caps, or manage fair usage. In that context, throttling can be intentional policy rather than a hardware fault, although customers often experience it only as slower service.
The diagnostic question is whether the restriction follows a policy boundary. Compare affected traffic with an unaffected path, examine transfer behavior over time, and check whether only a particular subscriber, destination, or traffic class changes. Network shaping needs network telemetry, not CPU temperature tools.
Hardware thermal protection
Thermal throttling occurs inside CPUs and GPUs when temperature reaches a protection limit. Intel’s processor documentation and MSI’s thermal-throttling guidance explain that the processor reduces clock speed or power when temperature rises above TJ Max or Tcase. MSI reports typical CPU limits around 95–100°C and GPU limits around 90°C.
The signature is different from API congestion. A sustained workload continues, temperature approaches the limit, and effective clock speed falls over time. The processor is protecting itself, not waiting for an application queue to drain.
Distinguishing Throttling From Rate Limiting and Hardware Faults
Performance investigations become expensive when engineers label every slowdown “throttling.” Start with the system response, then work backward to the trigger. A delayed API response, an HTTP 429, a falling CPU clock, and an automatic shutdown are separate events even if users describe all of them as “the system slowing down.”
| Mechanism | Primary Trigger | System Response | User Impact |
|---|---|---|---|
| API throttling | Demand exceeds safe processing capacity | Delays, queues, or selectively rejects work | Higher latency, possible timeouts |
| Rate limiting | A hard request allowance is crossed | Rejects requests, commonly with HTTP 429 | Immediate request failures |
| Thermal throttling | Temperature rises above TJ Max or Tcase | Reduces clock speed or power | Lower compute performance |
| Power-limit control | The processor reaches a configured power boundary | Restricts sustained power or performance | Reduced throughput under long workloads |
| Automatic shutdown | Protection conditions become unsafe | Stops the system | Service or device becomes unavailable |
The distinction between thermal throttling, automatic shutdown, and power-limit indicators matters. Intel’s thermal-throttling guidance separates these mechanisms and points to signals such as PROCHOT and PerfCap Reason. Those indicators help determine whether temperature, power policy, or another hardware condition is limiting performance.
Use the symptom as the first filter
If latency rises while requests remain accepted, inspect queues, concurrency, dependency health, and retry behavior. If responses fail immediately with HTTP 429, investigate the configured rate limit and the identity or route that crossed it. If a benchmark shows falling effective clocks while the workload remains constant, inspect temperature, cooling, power configuration, and thermal indicators.
A fault can also imitate intentional control. A blocked fan, poor heatsink contact, or inadequate cooling can force thermal protection even though no software policy changed. Conversely, an ISP or gateway may intentionally slow traffic without any damaged component. This overview of thermal throttling and adjacent limiters is useful because it frames throttling as a term that spans device protection, network management, and service-tier enforcement.
Don’t apply a retry policy to a thermally constrained processor, and don’t replace cooling hardware when an API gateway is returning a deliberate policy response.
Diagnosing Hidden Throttling in Production Systems
Throttling often appears first as a change in shape rather than a clear error. Averages can remain acceptable while tail latency expands, queues fluctuate, and a subset of tenants experiences degradation. The investigation should follow the request path and correlate application behavior with infrastructure signals.
Start with request and queue evidence
Check these signals together:
- Queue depth: Look for sustained growth, long wait times, or a queue that drains only after traffic falls.
- Latency distribution: Compare normal and degraded periods across request paths, with attention to tail behavior rather than one average.
- Retry volume: Identify clients that retry quickly or repeatedly, especially after delayed responses.
- Fan-out completion: Check whether downstream calls finish in order or whether one dependency causes entire request trees to stall.
- Principal-level usage: Break traffic down by tenant, user, route, or dependency so a local overload doesn’t appear to be a global failure.
A retry storm can hide the original trigger. The first request may have been delayed by a constrained backend, while the retries consume the remaining capacity and make the queue look like the root cause. Log correlation identifiers and attempt numbers so operators can distinguish original work from client-generated amplification.
Check hardware and network signals separately
For compute workloads, compare requested clock speed with effective clock speed across a sustained run. A falling effective clock under a constant workload points toward thermal or power constraints, especially when temperature rises at the same time. Inspect PROCHOT, PerfCap Reason, temperature, fan behavior, and power readings rather than relying on a single benchmark score. Intel identifies temperature protection around TJ Max or Tcase, while the thermal-throttling reference discusses the need to separate those indicators from automatic shutdown and power-limit behavior.
For network issues, compare throughput, transfer latency, packet loss, and affected traffic classes. A policy-based restriction may follow a subscriber, route, or service tier. Congestion can affect many flows without a formal policy, so you need timing and scope to tell the difference.
Treat throttling as a hypothesis. Correlate the limiter’s signal with the moment performance changes, then test whether removing that condition restores the previous behavior.
Designing Resilient Services and Mitigation Best Practices
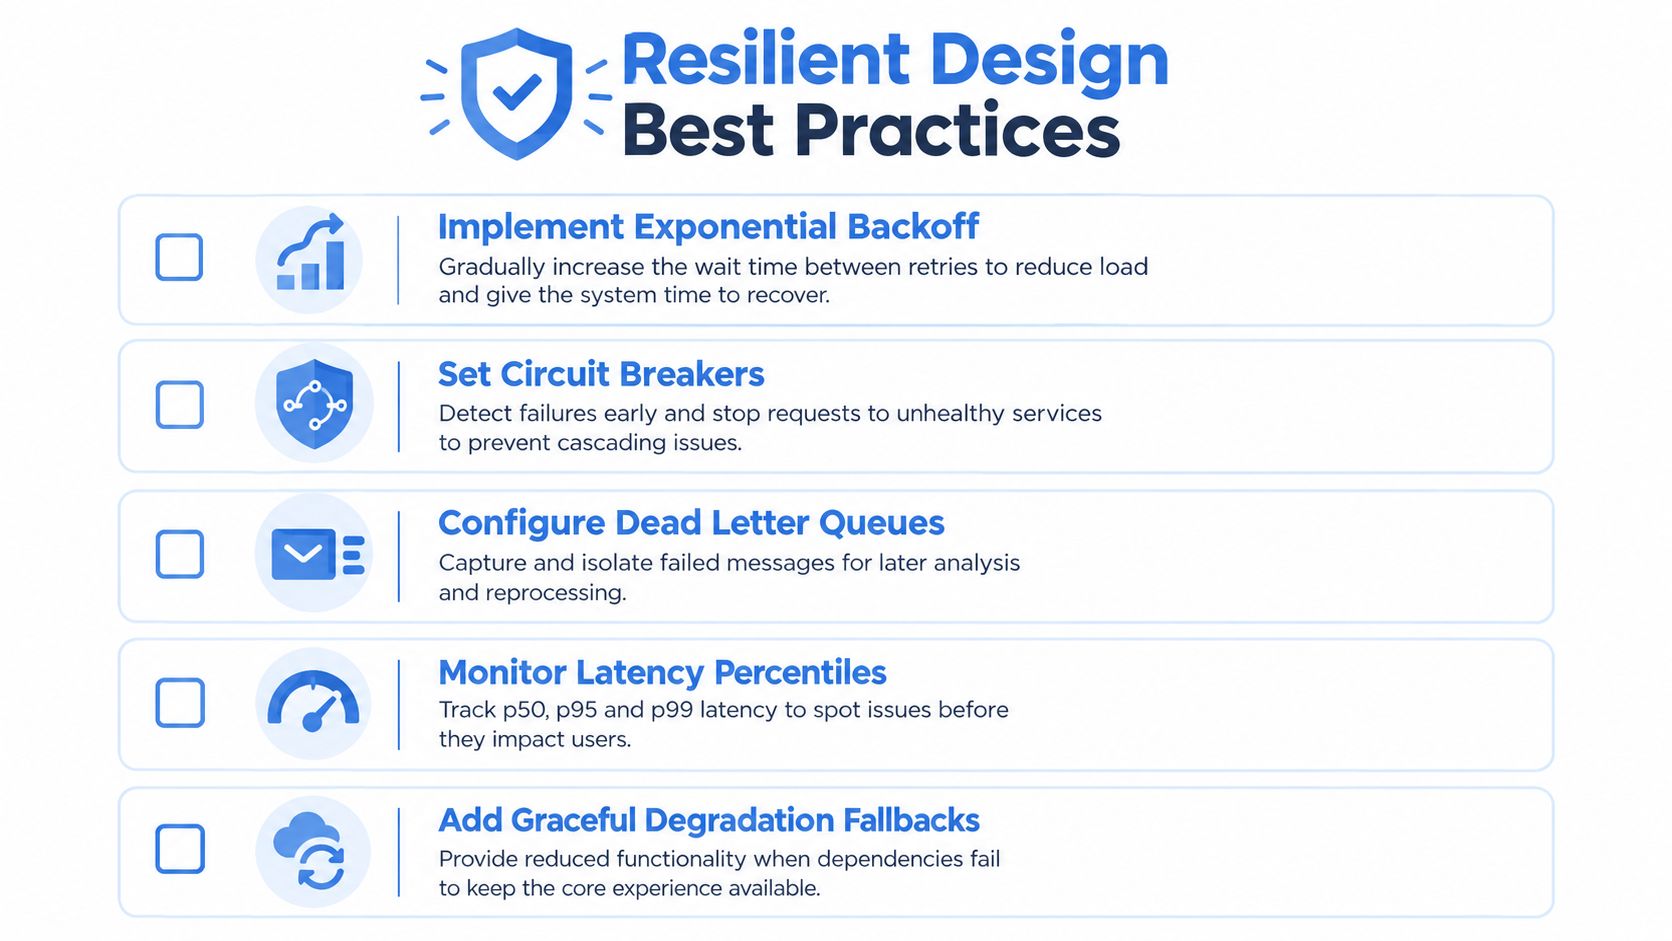
A resilient service doesn’t pretend throttling won’t happen. It makes the behavior bounded, visible, and safe for callers. The design objective is graceful degradation, not unlimited throughput at the cost of a shared backend.
Make the control selective
Measure usage at the level where overload occurs. A global limiter may protect the service but unfairly penalize unaffected tenants. Per-tenant, per-user, per-route, and per-dependency counters let operators isolate the noisy path and preserve capacity for other work.
Health signals should include queue occupancy, dependency response time, worker availability, and rejection or delay counts. Microsoft’s throttling pattern guidance emphasizes low-latency signals across infrastructure, application, and principal levels. Without those signals, a limiter becomes a blunt instrument that can conceal the actual bottleneck.
Make clients cooperate
Client behavior determines whether throttling stabilizes the system or causes a second incident.
- Use exponential backoff: Increase the delay between retries, add jitter, and respect server-provided retry guidance where available.
- Bound waiting: Set timeouts for queues, connections, and total request duration. A request that waits indefinitely still consumes operational capacity.
- Stop retrying permanent failures: Validation errors and authorization failures need different handling from temporary capacity pressure.
- Add circuit breakers: Open the circuit when a dependency repeatedly fails or times out, then probe cautiously instead of continuing full fan-out.
- Provide fallbacks: Serve cached, partial, deferred, or reduced-cost responses when the primary path is constrained.
Teams building these patterns can consult this guide to designing resilient systems for implementation ideas.
Hardware needs a different mitigation path. Improve airflow, verify heatsink contact, reduce sustained load, or tune power settings so the processor doesn’t remain at its thermal boundary during long runs. Software retries won’t fix a CPU that’s reducing its clock to stay safe.
Simulating and Validating Throttling Scenarios with GoReplay
Synthetic scripts are useful for targeted unit and integration tests, but they often miss the sequence that makes production throttling difficult. Real users authenticate, browse, submit forms, poll for results, and trigger dependent operations in an order your script may not reproduce.
Capture traffic carefully, remove sensitive data, and replay it against an isolated environment. The test should preserve realistic request relationships while allowing you to vary capacity, dependency latency, queue limits, and client retry behavior.
A practical replay workflow
-
Define the failure question. Decide whether you’re testing gateway throttling, a constrained dependency, a connection pool, or client behavior after delayed responses. Choose the signals that will confirm or reject that hypothesis.
-
Capture representative HTTP traffic. Record the routes and interactions needed for the scenario, while applying masking and filtering rules for credentials, tokens, personal data, and destructive operations. Don’t send unmodified production secrets into a test target.
-
Prepare a safe target. Point replay traffic at a staging or isolated service revision. Match relevant schemas, feature flags, authentication behavior, and dependency contracts so the test exercises application behavior rather than a missing fixture.
-
Preserve session relationships. Session-aware replay matters when one request creates state needed by the next. Keep dependent operations in the required order, or use middleware to transform identifiers and route requests to the correct test session.
-
Introduce the constraint deliberately. Reduce worker capacity, constrain a dependency, limit queue admission, or add controlled latency. Change one major condition at a time so you can attribute the response to the scenario being tested.
-
Observe the response. Record queue depth, latency, errors, retries, downstream completion, and resource saturation. A successful test is not just “the server stayed up.” It should show whether the service delayed work predictably, protected unaffected tenants, and recovered after pressure fell.
-
Compare mitigation variants. Test bounded retries against immediate retries, selective throttling against global throttling, and graceful fallback against a full dependency failure. Keep the traffic pattern constant while changing the mitigation.
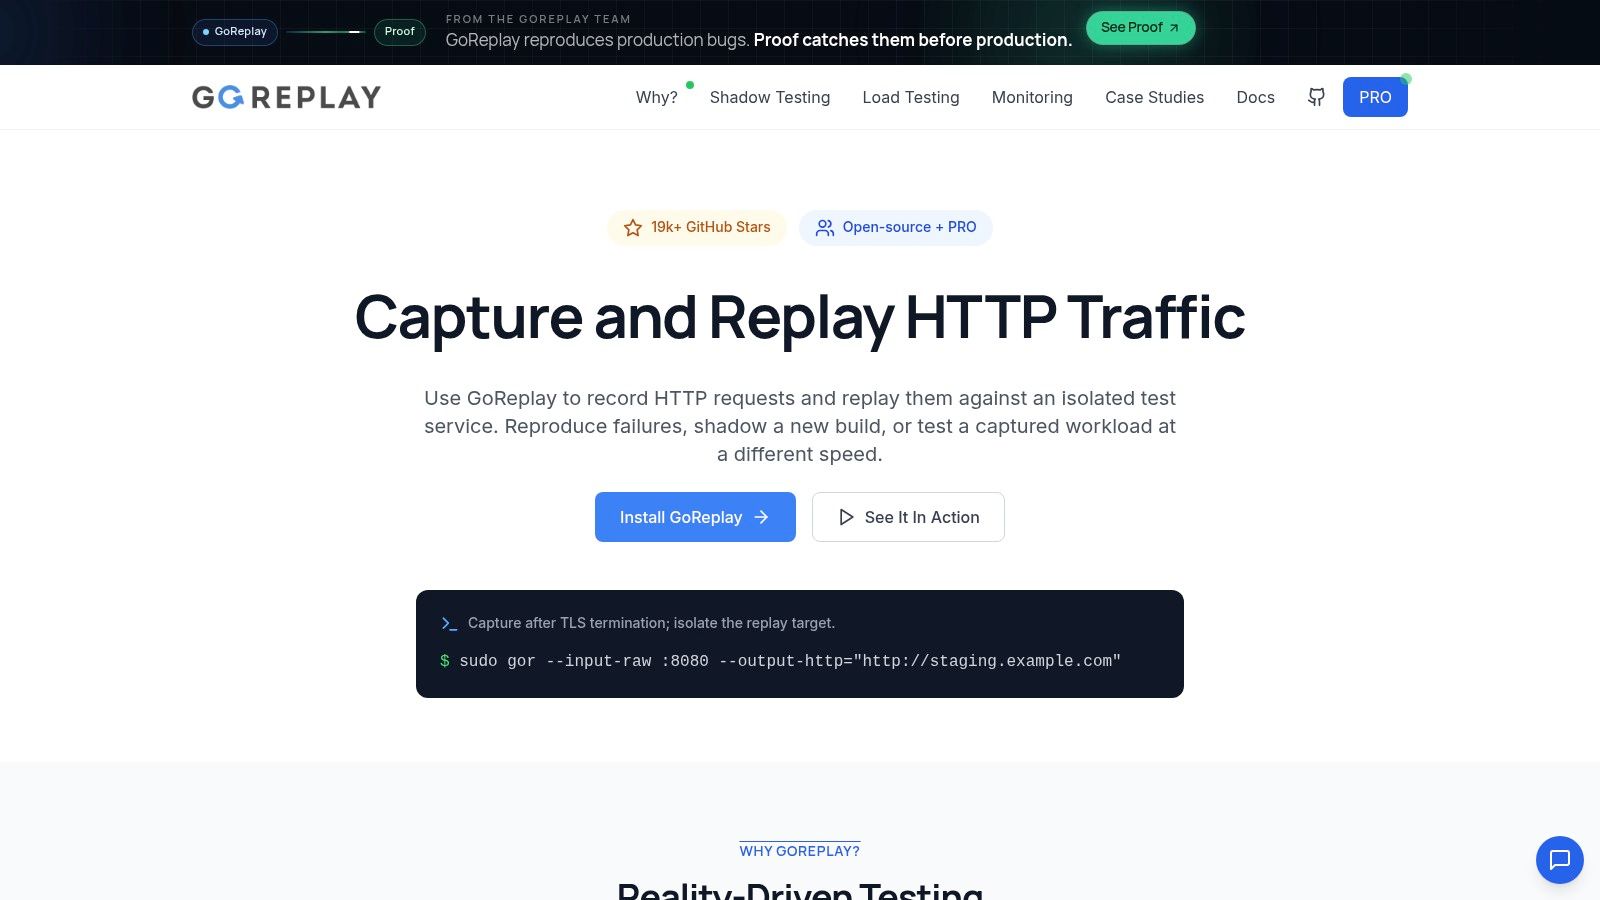
GoReplay captures and replays live HTTP traffic into testing environments, and its replaying documentation covers the mechanics for directing captured requests toward a target. It also supports session-aware replay and middleware, which are useful when request order and state matter.
A replay tool can reproduce application demand, but it won’t automatically reproduce every external condition. Network shaping, thermal behavior, and ISP policy need their own controls. Combine traffic replay with infrastructure fault injection and hardware telemetry when the question crosses layers.
Review the video below after you’ve mapped the replay workflow to your own test environment.
Final Verification and Key Takeaways
The answer to what is throttling depends on the mechanism, not the symptom alone. Intentional API throttling manages processing speed and may delay work. Rate limiting imposes a hard cap and commonly returns HTTP 429. Thermal throttling reduces processor speed or power when temperature reaches a protection boundary, while automatic shutdown removes the system from service.
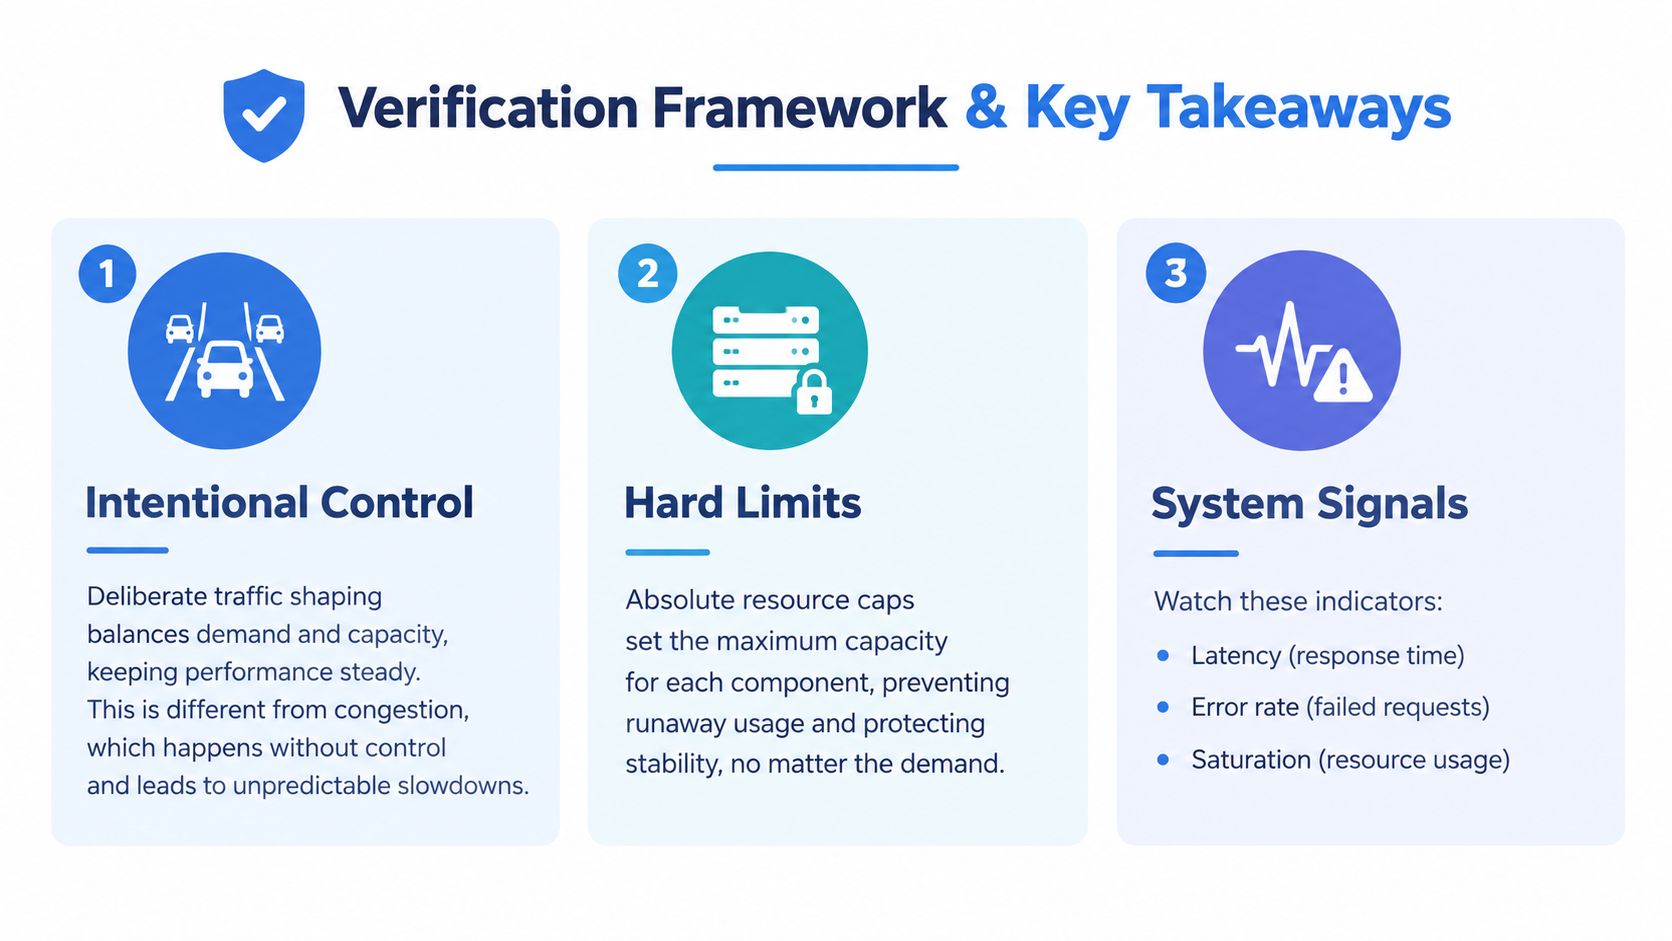
Use this verification checklist before changing configuration:
- Identify the response: Is the system delaying, queuing, rejecting, slowing clock speed, or shutting down?
- Locate the trigger: Check request volume, principal usage, dependency health, temperature, power, and network scope.
- Check selectivity: Determine whether one tenant, route, subscriber, dependency, or device is affected.
- Correlate signals: Pair latency and queue data with retry volume, HTTP errors, effective clocks, temperature, and hardware indicators.
- Replay realistic traffic: Validate mitigation against captured interaction patterns, not only isolated synthetic requests.
- Test recovery: Confirm that queues drain, retries settle, unaffected users retain capacity, and performance returns after the constraint is removed.
The most reliable systems make throttling observable and predictable. They don’t hide capacity boundaries behind indefinite waits, and they don’t treat every limiter as a software bug.
GoReplay captures and replays live HTTP traffic so you can validate throttling behavior with realistic request sequences before deployment. Use GoReplay to reproduce production interaction patterns in an isolated environment, apply controlled capacity constraints, and verify that your service degrades and recovers safely.