What is software performance testing? Key Insights and Best Practices

Software performance testing isn’t just a box to tick in your QA process. It’s about making sure your application is fast, stable, and scalable enough to handle real-world user loads. Without it, you’re flying blind—and risking a crash landing.
Why Performance Is The Bedrock Of User Experience
Imagine getting the keys to a brand-new, high-end sports car. It looks incredible, the interior is pure luxury, and it’s packed with the latest tech. But when you hit the accelerator, it sputters and shakes, struggling to even hit 30 miles per hour. All those amazing features are suddenly worthless because the car failed at its one core job: to perform.

Your software is no different. You can pour resources into building a beautiful UI and revolutionary features, but if it’s slow, buggy, or crashes under a little pressure, users won’t stick around. This is where performance testing comes in. It’s not a technical afterthought; it’s the process that guarantees your application actually delivers on its promise.
Defining The Core Purpose
So, what is software performance testing? Think of it as a series of controlled stress tests for your application. It’s a discipline focused entirely on understanding how your system behaves—its responsiveness and stability—when a specific workload is thrown at it. The goal is to find and fix performance bottlenecks before your users do.
Before a new bridge opens to the public, engineers test it relentlessly to make sure it can handle the weight of thousands of cars, day in and day out. Performance testing does the exact same thing for your software, simulating user traffic to see what happens when things get busy.
The primary goals are to:
- Validate Speed: Does the app respond quickly when a user clicks a button?
- Confirm Stability: Does it fall over when traffic spikes, or does it remain solid?
- Assess Scalability: Can the application grow with your user base and data, or will it hit a wall?
The High Cost Of Poor Performance
Skipping performance testing is a massive gamble, and the consequences directly hit your bottom line. A slow or unreliable application drives users away. We’ve all been there—if a page takes more than a few seconds to load, we’re gone.
Poor performance is not a technical issue; it’s a business problem. A one-second delay in page response can result in a 7% reduction in conversions, hitting revenue and damaging your brand’s reputation.
This isn’t an abstract number. For an e-commerce site, that means abandoned carts and lost revenue. For a SaaS platform, it means frustrated customers hitting the “cancel subscription” button. The damage goes beyond the immediate financial hit; it erodes trust and tarnishes your brand.
Ultimately, performance isn’t a feature—it’s the foundation every other feature is built on. Without it, even the most brilliant software will fail.
Exploring The Different Types Of Performance Tests
Software performance testing isn’t a single, one-size-fits-all action. It’s more like a detective’s toolkit, filled with specialized instruments, each designed to uncover a different clue about your application’s resilience and stability.
Think of it like a comprehensive medical exam—you wouldn’t use a stethoscope to check your vision. In the same way, each type of performance test applies a unique pressure to your system, revealing specific weaknesses and ensuring you’re ready for whatever the real world throws at you.
Load Testing: Can You Handle a Normal Busy Day?
Load testing is your bread and butter. Its goal is refreshingly simple: see how the system behaves under a normal, expected amount of user traffic. It’s not about breaking things; it’s about confirming that your application can handle its day-to-day business without slowing to a crawl.
Imagine you run an e-commerce store. You know that on a typical Saturday afternoon, you’ll have around 5,000 users browsing, adding items to their carts, and checking out. A load test simulates exactly that—5,000 virtual users performing those very actions to make sure the experience stays snappy for everyone. It’s all about validating performance under your expected peak load.
Stress Testing: Finding the Breaking Point
While load testing checks for the expected, stress testing is about discovering the absolute limit. This test intentionally shoves your system way past its normal capacity to find out where—and how—it breaks. The goal isn’t just to see it fail, but to understand what that failure looks like.
Back to our e-commerce store. What happens if a flash sale goes viral and your traffic instantly doubles from 5,000 users to 10,000? A stress test answers that question by ramping up the load until the system finally gives out. Does it crash and burn completely? Or does it start throwing errors but remain partially functional, allowing some users to finish their purchases?
By finding the breaking point in a controlled environment, stress testing helps you plan for graceful degradation. It’s the difference between a system that fails catastrophically and one that handles an unexpected surge with resilience.
Endurance Testing: Running the Marathon
Endurance testing, often called soak testing, is designed to see how your application holds up over a long period under a sustained, moderate load. It’s a marathon, not a sprint. This type of test is brilliant at uncovering sneaky, slow-burning issues that only surface after hours or even days of continuous operation.
An application might run perfectly for an hour, but what about after 24 hours? Endurance tests are your go-to for catching problems like:
- Memory Leaks: Where the application slowly gobbles up more memory over time, eventually leading to a crash.
- Performance Degradation: The slow, creeping increase in response times the longer the system is running.
- Database Connection Issues: Problems that only appear after thousands of connections have been opened and closed.
Spike and Volume Testing: Preparing for Sudden Surges and Big Data
Finally, we have two highly specialized but crucial tests for specific scenarios.
Spike testing is all about sudden, massive, and short-lived bursts of traffic. Think of a celebrity tweeting a link to your site. A spike test models this by instantly flooding your system with an overwhelming number of users to see how it reacts and, more importantly, how it recovers once the surge subsides.
Volume testing, on the other hand, isn’t about users—it’s about data. It checks how your application behaves when its database gets huge. For example, will your reporting dashboard, which is lightning-fast with 10,000 records, grind to a halt when it has to chew through 10 million? Volume testing ensures your system can scale as your data grows.
Choosing The Right Performance Test For Your Goal
With so many options, how do you pick the right one? This quick guide maps each test type to a clear goal and a real-world scenario, helping you decide which tool to pull from your toolkit.
| Test Type | Primary Goal | Real-World Scenario Example |
|---|---|---|
| Load Test | Validate performance under expected peak traffic. | Simulating 5,000 concurrent users during a typical holiday shopping day on an e-commerce site. |
| Stress Test | Find the system’s breaking point and observe failure behavior. | Ramping up traffic far beyond peak levels to see when the payment gateway starts failing during a flash sale. |
| Endurance Test | Identify issues that appear over long periods of sustained use. | Running a moderate, steady load on a SaaS application for 48 hours to detect memory leaks. |
| Spike Test | Measure the system’s ability to handle and recover from sudden, extreme traffic bursts. | Simulating the moment a viral news article links to your blog, causing an instant 10x traffic increase. |
| Volume Test | Assess performance when dealing with very large amounts of data. | Testing how long it takes to generate a complex financial report on a database with millions of transactions. |
Each of these tests answers a different, critical question about your application. By understanding their unique purpose, you can move from just “testing” to strategically building a truly robust and reliable system.
Understanding The Key Performance Metrics That Matter
Once you’ve run a battery of performance tests, you’re left with a mountain of data. But raw data on its own is just noise. The real magic happens when you understand what those numbers are trying to tell you about your application’s health and, more importantly, the user’s experience. Key performance metrics are the language your system uses to communicate its condition under pressure.
Think of these metrics like the vital signs a doctor checks. A patient’s heart rate, blood pressure, and temperature each tell a specific part of a much larger story. In the same way, metrics like response time, throughput, and error rate paint a clear picture of your system’s stability and speed, helping you diagnose problems before they become critical.
Response Time: The User’s Perception Of Speed
Response time, often called latency, is arguably the most user-centric metric of them all. It measures the total time from the moment a user makes a request—like clicking the “Add to Cart” button—to the moment they receive a complete response. This is the “wait time” your users actually feel.
Even tiny delays can have a massive impact. Studies consistently show that as response time creeps up, user frustration boils over and conversion rates plummet. A response time of 100 milliseconds feels instantaneous, but a delay of just one second is often long enough for a user’s mind to wander, completely breaking their engagement with your app.
Throughput: How Much Work Can Your System Actually Handle?
If response time is all about speed, throughput is all about capacity. It measures how many transactions or requests your system can successfully process in a given amount of time, usually per second. Think of it as how many customers a cashier can check out per minute.
High throughput is a clear sign of an efficient and well-oiled machine. If you run a load test with 1,000 virtual users and your system achieves a throughput of 500 transactions per second, you know it’s handling the load well. But if throughput flatlines or even drops as you add more users, you’ve almost certainly found a bottleneck that’s capping your system’s potential.
The infographic below breaks down how different types of performance tests are designed to push your system in unique ways to reveal these crucial metrics.
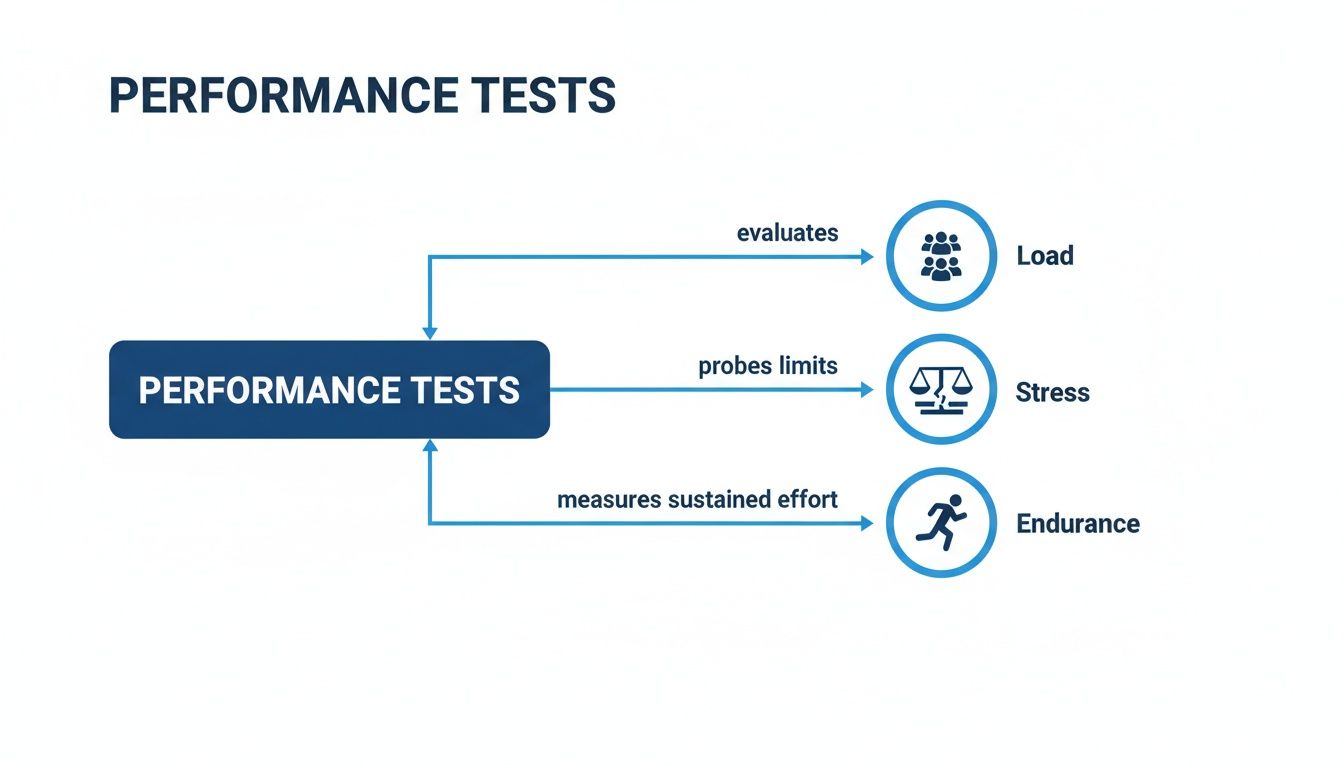
This visual shows how load, stress, and endurance tests apply different pressures—from expected daily traffic to absolute breaking-point loads—to uncover how these key metrics behave under various conditions.
Error Rate: The Measure Of Stability
The error rate, expressed as a percentage, tells you just how often users are running into problems. It’s simply the ratio of failed requests to the total number of requests. An error could be anything from a server timeout to a “404 Not Found” page or a failed database connection.
While a 0% error rate is the dream, it’s rarely achievable under heavy stress. The key is to define what’s acceptable for your application. A low, stable error rate might be fine, but a sudden spike is a serious red flag, signaling a deep-seated problem with your application’s stability.
An increasing error rate combined with high response times is a classic sign that your system is overloaded and on the verge of failure. It’s a critical warning that you’re pushing past the system’s limits.
Resource Utilization: The System’s Stamina
Finally, you have to look at the hardware’s side of the story through resource utilization metrics. These tell you how much of the server’s capacity is actually being used to get the job done.
- CPU Utilization: How busy is the server’s brain? Consistently high CPU usage, like sitting above 80%, is a sign the server is struggling to keep up with processing demands.
- Memory Usage: How much working memory is the application consuming? A gradual, unending increase in memory usage during an endurance test is a classic symptom of a memory leak.
By monitoring these four pillars—response time, throughput, error rate, and resource utilization—you can translate raw test data into actionable insights. For a deeper dive into measurement, check out our essential performance testing metrics guide measuring success, which offers a detailed look at how to interpret these numbers effectively.
Moving Beyond Scripts to Test Real User Behavior
For years, the standard approach to performance testing involved writing scripts to simulate what we thought users would do. An engineer would dutifully code a sequence: log in, search, add to cart, checkout. While it’s a decent starting point for a baseline, this method has a glaring, fundamental flaw: scripted users are not real users.
Real human behavior is messy. It’s chaotic, unpredictable, and packed with weird edge cases you could never dream up in a script. People get distracted, they hammer the “buy” button multiple times, they hit the back button at the worst possible moment, or they abandon a cart only to come back hours later from a different device.
Scripts, on the other hand, follow a clean, perfect, linear path. This chasm between synthetic simulation and real-world chaos means script-based tests leave massive blind spots. An application can sail through a scripted load test but completely fall apart under the unpredictable weight of actual production traffic. You simply don’t know how your system will hold up until it’s hit with the genuine complexity of real user interactions.
The Problem with Synthetic Traffic
Relying on scripted tests is like training for a championship basketball game by only practicing free throws. Sure, free throws are part of the game, but they do nothing to prepare you for the speed, the dynamic plays, and the sheer unpredictability of facing a real team.
This limitation leads to some common and painful problems:
- Missed Edge Cases: Scripts almost never account for the strange API call sequences or bizarre user journeys that trigger hidden bugs and performance bottlenecks.
- Unrealistic Caching Behavior: Real users request a huge variety of data, creating complex caching patterns. Scripts tend to hit the same few endpoints over and over, painting a dangerously optimistic picture of your cache performance.
- False Confidence: A “green” synthetic test can lull your team into a false sense of security, leaving you completely unprepared for the production fire that’s just around the corner.
To build truly tough, resilient applications, you need a testing methodology that doesn’t just tolerate chaos—it embraces it. That’s exactly where traffic replay comes in.
Introducing Traffic Replay for Realistic Testing
Instead of guessing what your users might do, traffic replay lets you use their actual behavior as your test script. The idea is simple but incredibly powerful: you capture real traffic from your production environment and then “replay” it against a test or staging environment.
This technique completely changes the game. All of a sudden, you’re not testing against a sterile, simplified simulation anymore. You are testing against the authentic, messy, and beautifully complex reality of how people use your application day in and day out.
By capturing and replaying live traffic, you transform your real users into your most effective performance testing tool. Every click, search, and transaction becomes part of a rich, realistic test suite that synthetic scripts simply cannot match.
Tools like GoReplay are built specifically for this. They act as a recorder for your production traffic, capturing every incoming HTTP request without affecting your live system’s performance. Once captured, this traffic can be replayed—at the original speed, slowed down, or even multiplied—against any environment you choose.
The Benefits of Replaying Production Traffic
Moving to a replay-based approach gives you immediate, tangible wins. It shifts performance testing from a predictive exercise based on assumptions to an evidence-based one grounded in real, hard data.
Here’s what you can achieve:
- Uncover Hidden Bugs: Replaying real traffic is one of the fastest ways to expose those obscure bugs and edge cases that would have otherwise waited to crash your production environment at 3 AM.
- Validate Performance with True Data: You can see exactly how your latest code changes will hold up under a genuine production load before you ever merge to main.
- Increase Deployment Confidence: When your app has already survived your actual user traffic in a test environment, you can push that deploy button with a whole lot more confidence.
- Simplify Test Creation: Forget spending weeks writing and maintaining brittle test scripts. Your “scripts” are now automatically generated from live traffic, freeing up your team to focus on analysis and improvement.
This method delivers a far more accurate picture of how your system really performs. If you’re ready to dive deeper, our guide on how to replay production traffic for realistic load testing offers a practical look at getting started. By moving beyond synthetic scripts, you ensure your performance tests finally reflect the world your users actually live in.
Putting Performance Testing Into Practice
Knowing the theory behind load tests and latency metrics is one thing. Actually putting it all into practice effectively? That’s a whole different ball game.
A truly successful performance testing culture isn’t built on running a few tests here and there. It’s about weaving these best practices directly into how you build software. This is the strategic shift that moves your team from fighting fires in production to proactively building fast, stable, and reliable applications from day one.
The journey starts by learning to sidestep the common pitfalls that trip up so many engineering teams. Once you know what not to do, you can adopt a much more intentional and impactful approach.

Establish Clear Performance Goals Early
One of the biggest mistakes teams make is diving into testing without defining what “success” even looks like. Vague goals like “the app should be fast” are completely useless because you can’t measure them. Without specific targets, your tests just become an exercise in collecting data instead of solving real problems.
The right way to do it is to define Service Level Objectives (SLOs) before you even think about writing a test. These are concrete, measurable targets tied directly to the user experience.
- Bad Goal: The checkout process needs to be faster.
- Good SLO: The P95 (95th percentile) response time for the “Submit Order” API call must be under 800 milliseconds with 2,000 concurrent users.
This level of clarity gives you a dead-simple pass/fail criterion for every test run. It gets everyone on the same page and turns performance into a tangible feature of your product, not an afterthought.
Integrate Testing into Your CI/CD Pipeline
For years, performance testing was treated as a final-gate activity, handed off to a separate QA team just before a release. This old-school approach is slow, expensive, and stressful. Finding a major bottleneck days before launch is a recipe for disaster, often leading to frantic code changes and delayed releases.
The modern solution is Shift-Left Testing. This simply means you integrate performance tests right into your Continuous Integration/Continuous Deployment (CI/CD) pipeline. By automating tests to run on every single code commit, you can catch performance regressions almost the instant they’re introduced.
Shifting left transforms performance testing from a final hurdle into an ongoing, automated quality check. It gives developers immediate feedback, making it dramatically easier and cheaper to fix issues right when they’re created.
This approach makes performance a shared responsibility for the entire team. When a developer can immediately see the performance impact of their changes, they’re empowered to write more efficient code from the get-go.
Use Realistic Workloads and Environments
Another classic mistake is testing with fake data in an environment that looks nothing like production. Sure, your app might fly when tested with a tiny dataset on a super-powered staging server, but those results are meaningless. They create a false sense of security that will evaporate the second your application meets real-world traffic.
If you want trustworthy results, your testing has to mirror reality.
- Use Production-Like Test Environments: Your test environment’s hardware, network setup, and software versions have to match production as closely as possible. This ensures the bottlenecks you uncover are real, not just quirks of a mismatched environment.
- Test with Realistic Traffic: Like we’ve said, synthetic scripts just can’t capture the chaotic nature of real users. Using a traffic replay tool like GoReplay lets you test with authentic user behavior, which is critical for uncovering those tricky edge cases that scripted tests always miss.
- Implement Continuous Monitoring: Performance testing doesn’t just stop when you go live. Continuous monitoring in production gives you a constant stream of real-world performance data. This helps you spot trends, set more accurate SLOs, and identify issues before they blow up and affect your users.
Building a Resilient Application for the Future
If there’s one thing to take away from this guide, it’s this: performance testing isn’t just a final checkbox you tick before launch. It’s an ongoing commitment, the very foundation of a resilient business. It transforms performance from a technical afterthought into a core feature that protects your user experience and builds customer loyalty.
We started by establishing that an application’s coolest features are useless if it falls over under pressure. From there, we dove into the specific tools in the testing arsenal—from load tests that simulate a busy Friday night to stress tests designed to find the absolute breaking point. This is how you prepare for anything.
A Mindset of Proactive Quality
The biggest shift you can make is cultural. Your team needs to start treating speed, stability, and scalability with the same reverence they give a shiny new feature. It’s about moving from a reactive cycle—frantically putting out production fires—to proactively engineering robust systems from the get-go.
This cultural change is powered by modern tools and practices:
- Early Integration: By “shifting left,” you embed performance tests directly into your CI/CD pipeline. This catches issues when they’re small, cheap, and easy to squash.
- Realistic Workloads: Ditching synthetic scripts in favor of replaying real user traffic gives you an unmatched level of accuracy. You’ll uncover strange edge cases that would otherwise lie dormant until it’s way too late.
- Continuous Monitoring: Performance work doesn’t stop at deployment. Watching your application live in production gives you the feedback loop needed to refine goals and see future challenges coming.
Ultimately, performance testing is about building confidence. It’s the confidence to deploy new code, to handle a sudden traffic surge from a marketing campaign, and to promise your users a fast, reliable experience every single time.
Securing Your Competitive Edge
In a market flooded with options, a flawless user experience is what makes you stand out. A solid performance testing strategy isn’t just about preventing crashes; it’s about building a reputation for being unshakably reliable. When users know your app will just work, even during peak hours, you earn their trust. And their business.
By embracing the principles we’ve covered—from defining clear metrics to using real-world test data—you’re not just testing software. You are building a faster, more stable, and more resilient future for your product. You’re ensuring it can handle the pressures of today and scale to meet the opportunities of tomorrow. That commitment is how you secure a lasting competitive advantage.
Got Questions About Performance Testing?
As you start digging into performance testing, a few common questions always seem to pop up. Let’s clear the air with some straight answers to help you build a testing strategy that actually works.
What’s The Difference Between Performance Testing and Performance Engineering?
Think of it this way: performance testing is like being a detective. Its job is to find and report problems. You run load, stress, and endurance tests to answer one key question: “Does our app hold up under pressure?” It’s the diagnostic phase—finding the weak spots.
Performance engineering, on the other hand, is the architect and the medic combined. It’s a much bigger discipline that takes those test results and proactively designs solutions. It’s about building performance into the system from the ground up through smart architecture, code optimization, and capacity planning, not just checking for it at the end.
Performance testing finds the bottlenecks. Performance engineering prevents and fixes them. Great teams do both, creating a cycle of testing, analyzing, and improving.
When Is The Best Time To Start Performance Testing?
The short answer? Yesterday. Seriously, as early as you possibly can.
The old-school approach of waiting until the very end of the development cycle to run performance tests is a recipe for disaster. It leads to expensive delays and frantic, last-minute fixes. This treats performance like an afterthought, and it almost always comes back to bite you.
A much smarter strategy is to “shift left,” integrating performance testing right into your CI/CD pipeline. By running small, automated tests on individual features as they’re being built, developers get instant feedback. This lets them catch performance regressions on the spot, long before those issues get tangled up in the codebase and become a nightmare to untangle.
How Do I Choose The Right Performance Testing Tools?
There’s no magic bullet here. The “best” tool is the one that fits your team’s specific stack, skills, and goals. You can cut through the noise by focusing on a few key factors:
- Protocol Support: Does the tool speak your application’s language? Whether it’s HTTP/S, gRPC, or WebSockets, you need a tool that understands your tech.
- Realism and Scalability: Can it generate a load that actually looks like your real users? For maximum accuracy, tools like GoReplay are a game-changer because they capture and replay actual production traffic, completely removing the guesswork of scripting user behavior.
- Integration: How easily does it slot into your existing CI/CD pipeline and monitoring tools? You want something that works with your workflow, not against it.
- Reporting and Analysis: Does it give you clear, actionable insights? A good tool won’t just tell you something is slow; it will help you figure out why.
By weighing your options against these points, you can find a tool that doesn’t just meet your technical needs but helps your whole team build a culture of performance.
Ready to test your application with the ultimate dose of reality? GoReplay lets you capture and replay real user traffic to uncover hidden issues before they hit production. Start for free on goreplay.org and build unbreakable confidence in every deployment.