What Is A Performance Testing Guide

So, what is performance testing, really?
Think of it as a stress test for your software. It’s a non-functional check designed to see how your application holds up under pressure. We’re not just asking “does it work?” but rather, “how well does it work when a specific workload is thrown at it?” The goal is to measure its speed, stability, and responsiveness to make sure it can handle real user demand without falling over.
Decoding the Purpose of Performance Testing

Imagine you’re about to launch a huge e-commerce sale. The last thing you want is to find out your servers can’t handle the traffic after thousands of customers have already arrived. That’s a recipe for disaster.
Performance testing is your dress rehearsal. It lets you simulate that intense user load in a controlled environment before you go live, moving beyond simple functional checks like “does the login button work?” to answer the big questions about reliability and user experience. It helps you see how your app behaves under all sorts of conditions—from a typical busy afternoon to a massive, unexpected traffic spike.
Why It Is a Non-Negotiable Step
Skipping this step can have some pretty severe consequences. A slow, buggy application kills user satisfaction, leading to high bounce rates, awful reviews, and—most importantly—lost revenue. In fact, studies show that even a one-second delay in page load time can cause a major drop in conversions.
Ultimately, performance testing is about protecting your brand and keeping your business running smoothly. By finding and fixing bottlenecks early on, you can:
- Protect the User Experience: Keep users happy and engaged with a fast, seamless experience.
- Prevent Costly Downtime: Sidestep system crashes during peak hours that can cost you a fortune.
- Validate Your Infrastructure: Make sure your hardware and software can actually support your user base as it grows.
- Build Stakeholder Confidence: Back up your launch plans with hard data that proves the app is ready for prime time.
What is performance testing? It’s an investment in quality and reliability. It’s the process that confirms your software is not just functional, but also robust, scalable, and ready to perform flawlessly when it matters most.
By simulating real-world scenarios—from steady traffic to sudden surges—you get invaluable insights into your system’s limits. This allows you to make smart decisions, optimize your resources, and confidently deploy an application that doesn’t just meet user expectations, but exceeds them.
Decoding the Types of Performance Tests

Knowing what performance testing is is one thing. Realizing that not all tests are created equal is what separates the pros from the amateurs.
Different problems require different tools. Think of it like a chef’s kitchen—you wouldn’t use a meat cleaver for delicate pastry work, and you wouldn’t use a blowtorch to simmer a stew. The same principle applies here. Each type of performance test is designed to ask a very specific question about how your application behaves under pressure.
Choosing the right test for the job is how you get precise, actionable insights. It’s how you make sure your system is ready for whatever the real world throws at it.
Load Testing: Simulating a Normal Day
Load testing is your bread and butter. It’s the most common type of performance test because its goal is simple: see how your app holds up under a normal, expected workload.
This isn’t about chaos; it’s about control. Imagine a busy Saturday afternoon at your e-commerce store—not Black Friday madness, just a steady, predictable stream of shoppers. That’s what load testing simulates.
Does your page load time stay under the crucial three-second mark? Can the server handle 500 concurrent users browsing products without breaking a sweat? A load test answers these questions by gradually ramping up virtual users to an expected peak, ensuring your core user experience stays smooth on any given day.
Stress Testing: Finding the Breaking Point
While load testing checks for expected behavior, stress testing is all about discovering the unexpected. It shoves your application way past its normal capacity to find out exactly where—and how—it breaks.
This is your Black Friday scenario. It’s the moment your product goes viral and the traffic firehose gets turned on full blast. The goal isn’t just to see if it fails, but how it fails.
Does it crash and burn? Or does it degrade gracefully, maybe showing an error message but keeping the core system alive? How quickly does it recover once the pressure is off? By intentionally overloading the system, you pinpoint the weakest links in your infrastructure before a real crisis does it for you.
Soak Testing: A Test of Endurance
Some of the nastiest bugs don’t show up in a quick burst. They’re slow, creeping problems that only appear over long periods. That’s where soak testing (or endurance testing) comes in.
This test applies a normal, sustained load over an extended time—often for hours, sometimes even days. It’s designed to uncover sinister issues like memory leaks, where an application slowly eats up system resources until it eventually starves itself to death. Think of it as leaving a car engine running for 48 hours straight to see if it overheats or starts sputtering.
Soak testing is absolutely critical for systems that need to run 24/7 with rock-solid reliability, like financial platforms or mission-critical APIs. It’s the only way to guarantee long-term stability.
Spike Testing: Handling Sudden Surges
What happens when your app gets a surprise shout-out from a major influencer? You get an instant, massive flood of users. Spike testing is built for this exact scenario.
Unlike a load test that ramps up traffic gently, a spike test hits your system with an enormous number of users all at once. It’s sudden. It’s violent. And it’s designed to answer two key questions: Can the system survive the initial shock? And how quickly can it recover and return to normal?
This test is a must for any business that runs flash sales, marketing campaigns, or deals with time-sensitive events. It ensures a moment of viral fame turns into a business win, not a catastrophic server outage.
Performance Testing Types at a Glance
To make these distinctions crystal clear, here’s a quick-reference table that breaks down the primary testing types.
| Testing Type | Primary Objective | Example Scenario |
|---|---|---|
| Load Testing | Validate performance under expected, normal traffic. | Simulating 1,000 users shopping on an e-commerce site during a typical weekday afternoon. |
| Stress Testing | Find the system’s breaking point and observe failure behavior. | Hitting a ticketing website with 10x the expected traffic to see when it crashes during a concert sale. |
| Soak Testing | Identify performance degradation and resource leaks over time. | Running a financial application with a steady load for 48 hours to check for memory leaks. |
| Spike Testing | Evaluate how the system handles sudden, massive traffic surges. | Simulating a viral marketing campaign that drives 50,000 users to a website in 10 minutes. |
Each of these tests gives you a different piece of the performance puzzle. When used together, they create a complete picture of your application’s strengths and weaknesses, allowing you to build a system that’s reliable for every user, under any circumstance.
Measuring Success with Key Performance Metrics
So, how do you know if your application is actually performing well, or if it just feels fast on your development machine? To really answer the question “what is performance testing,” you have to speak its language. And that language is data—specifically, a set of key performance metrics that tell the true story of your system’s health.
Think of these metrics like the dashboard in a race car. Each gauge gives you a critical piece of information about how the engine is holding up under pressure. Driving without them is like taking a corner at 100 mph with your eyes closed. You’re just waiting for a crash. Understanding these numbers helps you diagnose problems, see failures coming, and tune your application for the best possible experience.
These aren’t just gut feelings; they’re the objective, hard evidence you need to build any successful optimization strategy on.
Speed and Responsiveness Metrics
The first thing any user notices is speed. When someone clicks a button or loads a page, their entire perception of your app’s quality is defined by how quickly it responds. It’s all about that initial impression.
- Response Time: This is the big one. It’s the total time from the moment a user sends a request (like clicking “Add to Cart”) to the moment they get a complete response back from the server. Think of it as your application’s speedometer. Low response times mean a snappy, happy user; high response times lead to frustration and people leaving your site.
- Latency: People often mix this up with response time, but it’s actually just one piece of the puzzle. Latency is the delay it takes for a single packet of data to get from point A to point B. High latency is often a sign of network problems or servers that are just too far away geographically.
Keeping both of these numbers as low as possible is always a top priority. A slow app is often seen as a broken app, and that’s a quick way to lose trust.
Capacity and Stability Metrics
Speed is great, but you also need to know how much work your system can actually handle and whether it will fall over while doing it. These metrics are like your car’s fuel efficiency and engine temperature gauges—they tell you how hard you can push things before they break.
Throughput is all about capacity. It measures how many requests or transactions your system can process in a given amount of time, usually measured in requests per second (RPS). A high throughput number means you have an efficient system that can handle a lot of users at once.
On the flip side, you have the Error Rate. This is the percentage of requests that simply fail during a test. A high error rate is a massive red flag. It means your application is buckling under the load and delivering a broken experience, even if the successful requests are fast.
Finding the right balance between high throughput and a low error rate is the core of what performance testing is all about. It’s that sweet spot where you’re serving the most users possible without sacrificing stability.
Resource Utilization Metrics
Finally, it’s time to look under the hood at what’s happening on the server itself. These metrics show you just how much strain your application is putting on the hardware it runs on.
- CPU Usage: This is your system’s RPM gauge. It shows how much processing power the app is eating up. If your CPU is consistently running hot (over 80%), it could point to inefficient code or simply an underpowered server that’s about to hit a wall.
- Memory Utilization: This tracks how much RAM your application is using. Big spikes or a slow, steady increase in memory usage over time are classic signs of a memory leak—a critical bug that soak tests are fantastic at uncovering.
- Disk I/O: This measures the read and write activity on your server’s storage. If your app frequently accesses large files or a database, a bottleneck here can bring everything to a grinding halt.
By keeping an eye on these server-side metrics, you can pinpoint the resource bottlenecks that are the root cause of poor performance. To get a more detailed look at these indicators, check out our essential performance testing metrics guide for measuring success.
Executing a Successful Performance Test
A great performance test isn’t just about running a script and seeing what happens; it’s a strategic process designed to uncover meaningful insights. Just throwing a bunch of random traffic at your system won’t tell you much. If you want to understand how your application will really behave under pressure, you need a methodical approach that mirrors reality, from defining clear goals to analyzing the results with a critical eye.
This process is what turns numbers on a dashboard into actionable data that directly improves the user experience. It’s how you build confidence that your application can perform when it matters most.
Define Clear and Measurable Objectives
Before you write a single line of a test script, ask yourself a simple question: what are we trying to prove? A performance test without clear objectives is just noise. Your goals need to be specific, measurable, and tied directly to business or user outcomes.
Forget vague goals like “make the website faster.” Instead, define precise targets:
- User Experience: “The homepage must load in under 2 seconds for 95% of users during peak traffic of 5,000 concurrent sessions.”
- System Stability: “The application’s CPU usage must not exceed 80% for more than five continuous minutes during the soak test.”
- Business Transaction: “The checkout process must handle 100 transactions per minute with an error rate below 0.5%.”
Goals like these give your test a clear purpose and a definitive pass/fail benchmark for success.
Build Realistic User Scenarios
The next step is to get away from synthetic, robotic traffic. Real users are unpredictable. They browse, abandon carts, search for products, and log in at different times. For your tests to be effective, your scenarios have to reflect this chaotic, human behavior.
The most accurate performance test is one that closely simulates the actual journeys your users take. This means modeling key workflows, not just hitting random endpoints. Think about common user paths, like searching for a product, adding it to the cart, and completing the checkout.
This growing need for realism is driving huge investments in the industry. The global performance testing market is projected to jump from USD 6.5 billion in 2023 to USD 13.2 billion by 2032. This boom highlights just how critical a superior user experience is for success. You can explore more data on market trends to see this shift for yourself.
The Power of Traffic Replay
One of the most effective ways to achieve this level of realism is through traffic replay. Instead of manually scripting user behavior, tools like GoReplay capture real production traffic and replay it in your testing environment. This method gives you an unmatched level of accuracy because you’re using the exact requests, headers, and timings from your actual users.
This technique is a game-changer. It eliminates the guesswork of creating synthetic load profiles. You’re not just simulating what you think users do; you’re testing against what they actually do. This is crucial for uncovering those complex, real-world bottlenecks that scripted tests almost always miss.
The infographic below shows the key performance metrics that a well-executed test—especially one using traffic replay—will monitor to measure success.
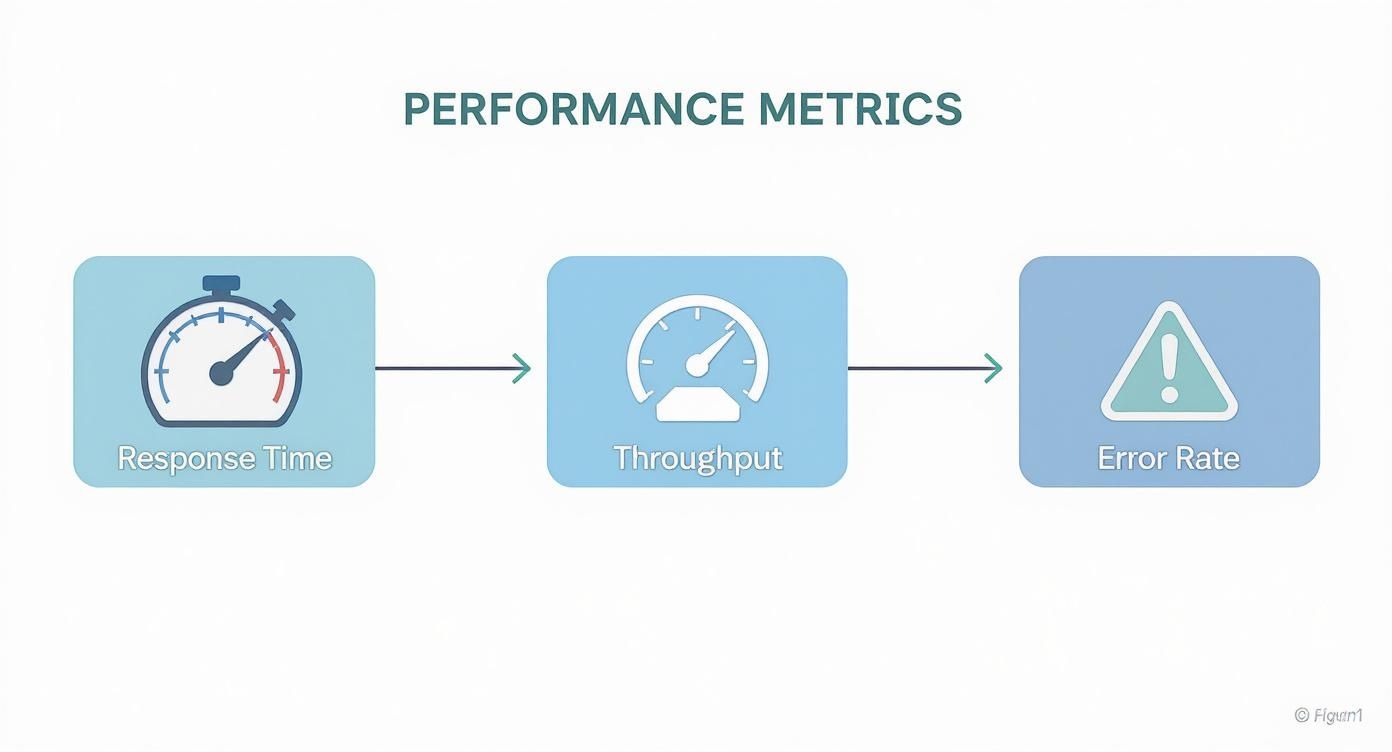
This visual flow shows how response time, throughput, and error rate are all interconnected, forming the core triad of performance measurement.
Analyze Results and Iterate
Once the test is done, the real work begins: analysis. This is where you dig into the data and compare it against your initial objectives. Did you hit your response time goals? Did the error rate stay within acceptable limits?
Your analysis needs to answer a few critical questions:
- Identify Bottlenecks: Where did the system slow down? Was it the database, a specific API endpoint, or the web server?
- Correlate Data: How did CPU spikes line up with high response times? Did memory usage climb steadily throughout the test?
- Plan for Action: What are the specific, actionable steps the development team needs to take to fix these issues?
Performance testing isn’t a one-and-done event. It’s a continuous cycle of testing, analyzing, optimizing, and re-testing. Each iteration gets you one step closer to a faster, more stable, and more reliable application.
Choosing the Right Performance Testing Tools
Picking a performance testing tool is a lot like a chef choosing their favorite knife. The right one feels like an extension of your hand, making the work effortless and precise. The wrong one just makes everything clumsy and ineffective. Your choice here will define everything from how you write tests to how you analyze the results, so it’s critical to find a tool that fits your team’s skills, budget, and specific technical headaches.
The market for these tools is booming for a reason. It’s expected to jump from USD 7.29 billion in 2024 to USD 11.86 billion by 2031. That’s not just corporate fluff; it’s a direct response to the massive demand for fast, reliable applications everywhere. You can discover more insights about the performance testing market to see just how fast things are moving.
Making a smart decision starts with understanding the two main camps: open-source and commercial.
Open-Source vs Commercial Solutions
Open-source tools are the go-to starting point for countless teams, and for good reason. They’re free and backed by huge, active communities.
- Apache JMeter: A true veteran in the space, JMeter is a Java-based workhorse known for its incredible flexibility. It speaks a ton of different protocols and has a massive library of plugins, making it a Swiss Army knife for almost any testing scenario.
- Gatling: Built for performance and loved by developers, Gatling takes a code-first approach using Scala. It’s known for producing beautiful, insightful reports right out of the box, which is a huge win for teams comfortable with a bit of scripting.
Commercial tools, on the other hand, usually offer a more polished experience, dedicated customer support, and powerful features that work from day one. Platforms like LoadRunner or NeoLoad are built for the enterprise but come with a price tag to match. The decision really boils down to whether you value a free, community-driven tool over the immediate, comprehensive support and features of a paid product.
A Modern Approach with Traffic Replay
Here’s the thing about traditional load generators: they’re great at creating clean, predictable, synthetic traffic. But real users are anything but clean and predictable. They are chaotic. This is where a modern tool like GoReplay completely changes the game.
Instead of trying to script out every possible user journey, GoReplay captures your actual production traffic and replays it against a test environment. This isn’t a simulation—it’s a perfect mirror of real user interactions, giving you unparalleled accuracy in finding those tricky, real-world bottlenecks.
Using a tool like GoReplay doesn’t mean you throw your old tools away. In fact, they work brilliantly together. You can use JMeter or Gatling to spin up a massive baseline load, then layer GoReplay traffic on top to inject the messy, unpredictable reality of your actual users. This hybrid approach gives you the best of both worlds: massive scale and true-to-life authenticity.
Ultimately, picking the right tool is a balancing act. You need to ask yourself a few key questions:
- Technical Skills: Is your team more comfortable with a GUI like JMeter, or are they developers who would rather write tests as code with Gatling?
- Project Budget: Can you justify a commercial license, or does an open-source solution make more sense for your bottom line?
- Testing Needs: Are you just hitting a few simple API endpoints, or do you need the hardcore realism that comes from replaying actual user sessions?
By thinking through these points, you can put together a toolset that truly empowers your team to ship reliable, high-performance applications.
Best Practices and Common Pitfalls to Avoid
Knowing what performance testing is and actually doing it well are two very different things. A winning strategy isn’t about just running tests; it’s about building a proactive culture around performance and steering clear of common, costly mistakes.
Simply checking a box isn’t enough. The real value comes from a disciplined approach that weaves performance awareness into your team’s DNA. This means you stop treating it as a last-minute chore and start seeing it as a continuous cycle of improvement.
When done right, performance testing catches problems early, saves you from expensive fixes down the road, and ensures your application delivers a killer user experience. The global performance testing market was valued at around USD 926.6 million in 2024 and is expected to hit USD 1,394.61 million by 2033. Those numbers tell a story—this isn’t just a “nice-to-have” anymore. You can dig into these performance testing market trends to see for yourself.
Essential Best Practices for Success
Adopting a few key habits can make a world of difference in the quality and impact of your testing. Think of these as the foundation for getting reliable, repeatable, and genuinely useful results.
- Shift Left and Test Early: Don’t wait until you’re about to deploy to think about performance. The smart move is to integrate smaller, focused tests at the component and API level from the get-go. This helps you find bottlenecks before they become tangled messes that are a nightmare to fix.
- Establish a Performance Baseline: You can’t improve what you don’t measure. Run initial tests to figure out your baseline for critical metrics like response time and throughput. This benchmark is your source of truth for every change you make later.
- Maintain a Production-Like Environment: Your test results are only as good as your test environment. You need to mirror your production setup as closely as possible—hardware, software, network settings, and data volume. Anything less, and you’re just guessing.
The goal is to make performance everyone’s job, not just something QA handles. When developers, DevOps, and QA are all on the same page, the whole application wins.
For a deeper dive, our guide on performance testing best practices has you covered.
Common Pitfalls That Derail Testing
Even with the best intentions, it’s easy to fall into traps that tank your testing efforts. Knowing what these mistakes are is the first step to avoiding them.
One of the biggest mistakes is using unrealistic test data and user scenarios. Testing with a few generic accounts and simple workflows won’t show you what happens when real users start doing unpredictable things. The real world is chaotic, and your tests should reflect that.
Another classic blunder is ignoring network variables. Simulating users on a perfect, lightning-fast local network is a recipe for disaster. Your actual users are on choppy Wi-Fi and slow mobile connections, and that latency has a massive impact. Finally, failing to analyze results properly makes the whole exercise pointless. Don’t just run the test—dig into the data, find the root cause of bottlenecks, and create actionable tickets for your developers.
Performance Testing FAQs
As we’ve unpacked the world of performance testing, some practical questions always come up. Let’s get straight to the answers for the most common ones.
How Is Performance Testing Different From Functional Testing?
This is a classic. Think of it like this: functional testing asks, “Does the feature work?” Performance testing asks, “How well does it work under pressure?”
Functional testing is about correctness. Does clicking the login button take you to the dashboard? Great, it passes. But performance testing worries about what happens when 1,000 users click that button at the same time. How fast is the response? Does the server stay stable? One verifies the what, the other validates the how well.
When Should I Start Performance Testing?
The short answer? As early as humanly possible. This whole “shift-left” idea isn’t just a buzzword; it’s about weaving small-scale performance checks into your daily development workflow.
Sure, the big, pre-release load tests are critical. But catching a performance bottleneck on a single component is way easier—and cheaper—than finding a major architectural flaw right before launch. Making performance a regular habit separates the good engineering teams from the great ones.
Waiting until you’re ready to deploy to run your first performance test is like waiting until you’re merging onto the highway to see if the engine can handle it. You want to find out in the garage, not at 70 mph.
Should I Test In a Staging or Production Environment?
The gold standard is a dedicated staging environment that’s an identical twin of production.
This isn’t just about having similar software; it needs to mirror your live hardware, network setup, and even the volume of data. Testing directly on production is a recipe for disaster. You risk slowing things down for actual users or, even worse, causing a full-blown outage. A high-fidelity staging environment gives you the best of both worlds: realistic results without the real-world risk.
Ready to test your application with traffic that’s actually real? GoReplay captures and replays live user sessions, giving you the most authentic load tests you can run. Get started for free and see the difference.