Web Stress Test: Master a web stress test for stable apps

Ever heard of a web stress test? It’s a specific kind of performance testing where you intentionally push a website or application way beyond its normal limits just to see where it breaks. The whole point is to understand how the system fails, how it recovers, and what its absolute performance ceiling is under extreme pressure.
Pushing Your Website to the Breaking Point on Purpose

Think about how engineers test a new bridge. They don’t just check if it can handle rush hour. They need to know its absolute limit. So, they line up truck after heavy truck, adding more and more weight until the structure finally shows signs of strain. It’s a destructive process, but it’s the only way to find out the bridge’s true strength.
That’s exactly what a web stress test does for your digital infrastructure. This isn’t about making sure things run smoothly under a predictable heavy load—that’s a different beast called load testing. Stress testing is all about finding out what happens in a full-blown crisis. When that unexpected flood of users hits your site, what’s the first thing to snap?
Why Embrace the Breakage
It sounds a little crazy to purposefully crash your own system, right? But the insights you get are gold when it comes to building a truly resilient application. Without a proper web stress test, you’re just flying blind and hoping for the best when things get chaotic.
This kind of proactive failure analysis helps you answer the hard questions—the ones that can make or break your business when the stakes are high:
- Failure Point Identification: At what exact number of users does the app start to buckle? Does it slow to a crawl, or does it just fall over and die?
- System Recoverability: Once the crushing load is gone, does the system pick itself back up, or does it need a manual reboot?
- Data Integrity: Does the system lose or corrupt data when it’s under duress? This is a massive deal for any site handling transactions.
- Security Loopholes: Do extreme conditions expose security flaws that you’d never see during normal operation?
A proper web stress test forces you to confront your system’s weaknesses in a controlled environment. It’s the difference between running a fire drill and having a real fire—one prepares you, while the other causes catastrophic damage.
Stress Testing Versus Other Performance Tests
People often throw these terms around interchangeably, but different performance tests have very different goals. Nailing down these distinctions is the key to a smart testing strategy.
Load Testing (Endurance): This is your bread-and-butter performance test. You simulate a specific, expected number of users over time to make sure your system can handle its anticipated peak load without grinding to a halt. Think of it as making sure the bridge can handle a busy holiday weekend.
Spike Testing (Sudden Surge): This test mimics a sudden, massive jump in traffic. It’s what happens when a marketing campaign goes viral or a celebrity gives you a shout-out. The goal is to see if your system can absorb the shock and get back on its feet quickly.
Stress Testing (Breaking Point): This is the most aggressive of them all. You just keep ramping up the load—far beyond any sane prediction—until the system breaks. It’s not about a simple “pass” or “fail.” It’s about discovering the how and why of failure so you can build a tougher, more reliable application for your users.
Understanding Key Metrics in Stress Testing
 Running a web stress test without knowing what to look for is like driving with a blindfold on. You’re generating a mountain of data, but none of it means anything without context. These charts and numbers aren’t just abstract figures; they are the vital signs of your application under pressure. Learning to read them is how you find weaknesses before your users do.
Think of it this way: your application is a runner on a treadmill. The stress test is you cranking up the speed and incline. Your job is to watch the runner’s heart rate, breathing, and form to see exactly when they start to struggle and where the failure points emerge.
Those vital signs map directly to a core set of performance metrics that, together, tell a clear story about your system’s health.
The Four Pillars of Performance Monitoring
During a stress test, four crucial metrics work in tandem to show you what’s really happening. A problem rarely appears in just one metric. Instead, you’ll see a domino effect as one struggling component drags others down with it.
- Response Time: This is simply how long it takes for your application to answer a user’s request. A healthy system keeps this low and stable. If response times start creeping up as you add more users, that’s your first red flag—our runner is starting to get tired.
- Throughput: This measures how many requests your application can successfully handle each second. More is better, but what you’re really looking for is the breaking point—the moment it flattens out or even drops, despite you adding more load. That’s your system’s max capacity.
- Error Rate: This is the percentage of requests that fail. In a stress test, you actually want this to go up eventually. The key is knowing at what load the errors begin and what kind they are (like 500-level server errors).
- CPU and Memory Utilization: These metrics tell you how hard your server hardware is working. High usage isn’t always bad, but if your CPU hits 100% and response times go through the roof, you’ve just found a classic processing bottleneck.
By watching these four metrics together, you go from knowing that your application broke to understanding the exact sequence of events that caused it. For example, you might see that at 5,000 users, CPU usage maxes out, causing response times to triple and the error rate to jump from 0.1% to 15%. That’s a story you can act on.
Choosing the Right Kind of Stress
Not all stress is created equal. The way you apply the load completely changes the kinds of weaknesses you’ll uncover. Different test types are designed to simulate specific, real-world failure scenarios, helping you prepare for anything from a gradual increase in traffic to a sudden, catastrophic surge.
Here’s a quick look at the most common approaches.
Comparing Web Stress Test Types
Choosing the right test depends entirely on what you’re trying to find. A test designed to catch memory leaks looks very different from one preparing you for a flash sale. This table breaks down the main types.
| Test Type | Primary Goal | Traffic Pattern | Best Used For |
|---|---|---|---|
| Incremental Test | Find the system’s breaking point and performance degradation curve. | Starts low and gradually increases load over time. | Identifying the exact user count where performance starts to decline and establishing a clear capacity ceiling. |
| Spike Test | Determine if the system can handle a sudden, massive surge in traffic. | A sudden, extreme increase in load for a short period. | Preparing for viral marketing campaigns, flash sales, or unexpected media mentions that cause instant traffic floods. |
| Soak Test | Uncover issues that only appear over long periods, like memory leaks. | A moderate, sustained load applied for an extended duration (hours or days). | Ensuring long-term stability and identifying resource consumption issues that aren’t visible in short tests. |
Ultimately, a truly solid web stress test strategy will likely use a mix of these methods. By understanding the core metrics and knowing which type of test to run, you can design experiments that reveal not just if your system will break, but precisely how, where, and when.
How to Design Your First Web Stress Test
Alright, let’s move from theory to action. Designing an effective web stress test isn’t about just throwing a bunch of random traffic at your site and hoping for the best. It’s a calculated process, a lot like an architect drafting a detailed blueprint before a single brick is laid.
A well-designed test gives you clear, actionable insights. A poorly designed one? It just creates a lot of noise and leaves you more confused than when you started.
The foundation of any good stress test is a set of clear, measurable goals. Vague objectives like “see if the site can handle traffic” are basically useless. You need specific, quantifiable targets that define what success and failure look like before you even start.
Define Your Performance Goals
Your goals have to be tied directly to real business outcomes. For an e-commerce site, a critical goal might be ensuring the checkout process stays lightning-fast and totally reliable during a massive flash sale. That’s something you can translate into a concrete, testable objective.
Example Goal: Our checkout process must support 5,000 concurrent users starting a purchase, with an average response time under 2 seconds and an error rate below 1%.
See? That simple statement gives your test a crystal-clear purpose. It defines the load (5,000 users), the expected performance (<2 seconds), and the acceptable failure threshold (<1%). Without that kind of clarity, you have no way of knowing if you’ve passed or failed.
Identify and Isolate Critical User Journeys
Let’s be honest—not all parts of your application are created equal. A slowdown on your “About Us” page is a minor inconvenience. A failure during the payment process is a full-blown disaster. The next step is to pinpoint the critical user journeys that are absolutely essential to your business.
These almost always include:
- User Authentication: The login and registration flows.
- Core Functionality: The search feature, product browsing, or the main user dashboard.
- Conversion Paths: The “add to cart,” checkout, and payment submission steps.
By focusing your stress test on these high-stakes pathways, you make sure your most valuable user interactions are bulletproof. It’s far more effective to hammer a few critical flows than to lightly tap your entire application at once.
Why Real Traffic Replay Beats Synthetic Scripts
Once you know what to test, you have to decide how you’re going to simulate the traffic. The traditional method is writing synthetic scripts—clean, predictable bots that follow a perfect, predefined path. The problem is, real users are anything but clean and predictable.
Real users are messy. They click erratically, abandon carts, refresh pages for no reason, and interact in ways you’d never think to script. This chaotic, unpredictable behavior is precisely what uncovers the hidden bottlenecks that synthetic tests miss.
This is where traffic replay tools like GoReplay completely change the game. Instead of inventing user behavior, you capture and replay the real thing.
The importance of preparing for these real-world scenarios has never been more obvious. The global lockdowns during the COVID-19 era drove unprecedented traffic surges, with internet usage jumping by 50-100% in sectors like e-commerce and streaming. This sudden strain threatened widespread crashes, propelling stress testing from a best practice to a defensive necessity. Businesses that use real-traffic simulation to prepare for these extremes report up to 2.5x faster issue resolution, securing their deployments against the unexpected. You can discover more insights about the stress testing solutions market on Allied Market Research.
Prepare Your Test Environment
With your goals and user journeys defined, the final step is setting up the stage. It is absolutely crucial that your test environment mirrors your production environment as closely as possible. Using a vastly underpowered server for testing is a recipe for misleading results.
Your pre-test checklist should include these three things:
- Establish a Baseline: Before you unleash the stress, run a small test to measure performance under a normal load. This baseline is your “control” data, the standard you’ll measure against.
- Isolate the Environment: Make sure your test doesn’t impact your live users. Use a dedicated staging server or a carefully sandboxed environment. No exceptions.
- Set Up Monitoring: Have your monitoring tools (like your APM and server dashboards) ready to capture key metrics—response time, error rate, CPU, and memory—in real time. You need to see what’s happening as it happens.
By meticulously planning your goals, focusing on what really matters, and using realistic traffic, you transform the web stress test from a simple “let’s see what breaks” exercise into a powerful diagnostic tool that builds true system resilience.
Simulating Real Traffic Using GoReplay
While scripted tests have their place, they often fall short when you need a genuine web stress test. Scripts are predictable, following neat, linear paths. Real users are the exact opposite—they’re chaotic, unpredictable, and their combined actions create complex load patterns that a simple script just can’t mimic.
This is where traffic replay tools like GoReplay change the game entirely. Instead of guessing what your users might do, GoReplay lets you capture actual production traffic and replay it against your test environment. This gives you the most realistic simulation possible, exposing bottlenecks that only show up under the pressure of real human behavior.
Capturing Live Traffic From Production
The first step is grabbing the raw, live traffic from your production server. The process is surprisingly simple and designed to have a minimal performance hit, so you can safely run it on your live system without slowing things down.
Think of it like setting a net in a river to see what kind of fish are swimming by. You don’t stop the river; you just get a perfect sample of what’s flowing through it. GoReplay’s listener works the same way, passively capturing HTTP requests without getting in the way of your users.
It all starts with a single command on your production server. This command tells GoReplay to listen to network traffic on a specific port (usually port 80 for HTTP) and save every request it sees to a file.
sudo ./gor --input-raw :80 --output-file traffic.gor
This command just runs in the background, quietly collecting a perfect copy of your user traffic. You can let it run for an hour during your busiest time or even a full day to capture a wide mix of user interactions. The result is one file (traffic.gor) packed with every request, ready for the next step.
Replaying Traffic to Stress Your System
Once you have that traffic.gor file, you can move it over to your test environment. Now the real web stress test begins. GoReplay can unleash this captured traffic against your staging or test application, and you’re in complete control of the chaos.
The real magic here is the ability to control the replay speed. You can start by replaying traffic at its original speed (1x) just to make sure your test environment is working correctly. Think of this first run as your baseline, confirming that the requests are being processed just as you’d expect.
Then, you start turning up the heat. By increasing the replay speed, you’re simulating a massive, sudden surge in users.
A core principle of stress testing is to incrementally increase the load until something breaks. With GoReplay, this is as easy as changing a single number. You can replay traffic at 2x, 5x, or even 10x the original speed to find your application’s true breaking point.
This simple but powerful process—defining goals, identifying traffic, and replaying it—is the key to finding your system’s limits.
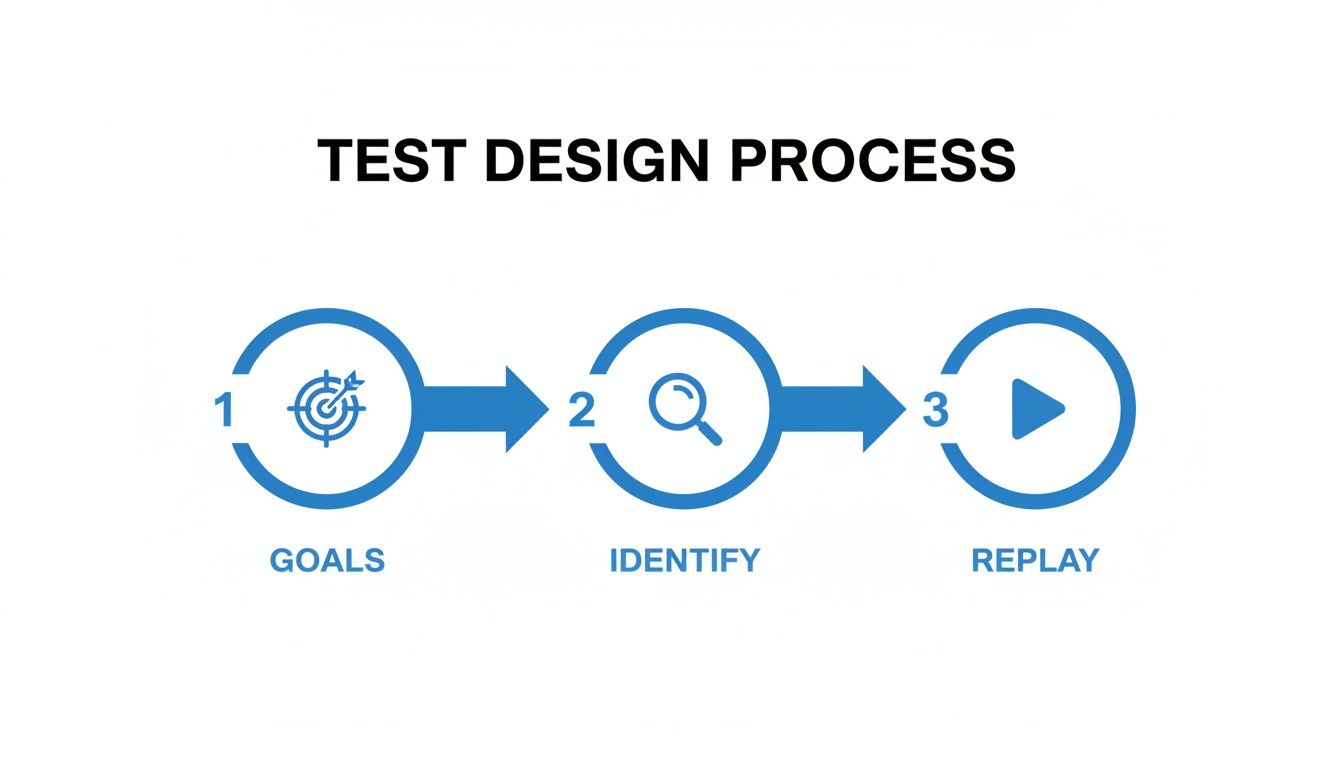
This workflow visualizes the strategy: set clear performance goals, capture real user journeys, and then replay them at a higher intensity to see where things start to wobble.
Executing the Test and Analyzing Results
With your traffic file in hand, running the replay is just another simple command. You point GoReplay to your captured file and tell it where to send the traffic—your test app’s address.
./gor --input-file "traffic.gor|500%" --output-http "http://staging-server-address"
That |500% part is what tells GoReplay to replay everything at five times its original speed. As this command runs, you’ll be glued to your monitoring dashboards, watching those four key metrics: response time, throughput, error rate, and resource utilization.
As you ramp up the speed, you’ll see a story unfold in your metrics. Maybe at 5x speed, response times start to creep up. At 8x, the error rate begins to spike. And by 10x, the server might become totally unresponsive. These data points are gold because they tell you the precise performance ceiling of your application.
For more advanced simulations, especially if you need to get around IP-based rate limiting or test geo-distributed systems, using tools like proxy IP rotators) can be incredibly effective. This helps create an even more realistic test that looks like it’s coming from a global user base.
What really makes GoReplay stand out is its ability to maintain user sessions. It knows that a user’s journey is a sequence of related requests, not just a bunch of random hits. By preserving these sessions during the replay, it simulates complete user workflows—from login to checkout—uncovering complex, state-dependent bugs that you’d otherwise miss.
If you want to dive deeper into what the tool can do, you can find more on the official GoReplay website. By using this powerful open-source tool, you can turn a complex testing process into a straightforward task, making sure your application is tough enough to handle anything the real world throws at it.
How to Interpret Test Results and Find Bottlenecks

So, your web stress test is done. Now you’re staring at a mountain of graphs, logs, and metrics. This raw data is where the gold is, but only if you know how to read the story it’s telling. Knowing your system broke isn’t the point—the real goal is to find out precisely why and where it failed.
Think of it like being a detective at a crime scene. You have to connect the dots. A sudden spike in response time is a clue. But when you see that it happened at the exact moment the CPU maxed out, you’re no longer guessing. You’ve got a prime suspect: an inefficient process or a serious computational bottleneck.
Your system’s performance is a lot like a highway during rush hour. All it takes is one bottleneck—a single slow off-ramp or a stalled car—to grind traffic to a halt for miles. In your application, that “stalled car” could be anything from a sluggish database query to a third-party API that just can’t keep up.
Connecting Metrics to Root Causes
Your first job is to correlate the performance metrics from the test with your server-side monitoring. What was happening inside the system at the exact moment things went south? Did the error rate shoot up as soon as memory usage hit its limit? Did throughput completely flatten out when all the database connections were exhausted?
This is how you move from symptoms to a real diagnosis. Here are a few common patterns to watch for:
- High CPU Usage: This almost always points to inefficient code, unoptimized algorithms, or complex data processing that just can’t scale under heavy load.
- High Memory Consumption: You could be looking at memory leaks, where the application forgets to release memory it no longer needs. It might also signal problems with your caching strategy or how you’re handling large datasets.
- Disk I/O Bottlenecks: If your disk’s read/write speed can’t keep pace, it will slow down everything that depends on data access, from database queries to file uploads.
- Network Saturation: Sometimes the problem isn’t your code, but the pipe it’s running through. If you’ve maxed out your bandwidth, no amount of optimization will fix it.
Your Application Performance Monitoring (APM) tool is your best friend here. It gives you the deep, code-level visibility you need to trace a symptom like “slow response time” all the way down to the specific function or database query causing the jam.
The need for these skills is exploding. The global stress testing market is expected to grow by USD 4.91 billion between 2023 and 2028, with an impressive 17.53% CAGR. Why? Because businesses can’t afford downtime. Enterprises that get this right report up to 40% fewer production incidents. You can read more about the market’s growth on Technavio.
Digging Deeper with Diagnostic Tools
Once you have a theory, you need to prove it. This is where you bring in more specialized tools to hunt down the root cause with absolute precision. A proper web stress test analysis means looking beyond the high-level dashboards.
1. Analyze Application Logs Your logs are a play-by-play of everything that happened during the test. Filter them for errors, warnings, and unusually long transaction times that cropped up right when performance tanked. These logs often hold the exact error messages or stack traces needed to pinpoint the broken code.
2. Use Code Profilers A profiler is an incredibly powerful tool that analyzes your code while it runs, showing you exactly how much time and memory each function is eating up. Running a profiler during a stress test will shine a spotlight on the “hot spots”—the few lines of code responsible for most of the CPU or memory usage.
3. Examine Database Queries Slow database queries are one of the most common culprits behind performance issues. Use your database’s own query analyzer to inspect what was running during the test. You’re looking for long-running queries, inefficient joins, or missing indexes that are dragging everything down.
By combining these techniques, you move from a vague problem to a specific, actionable task for your dev team. If you want to learn more, you might find our guide on how to identify performance bottlenecks with GoReplay helpful. This is how you turn a simple pass/fail exercise into a strategic tool for building a faster, more resilient application.
Common Mistakes to Avoid in Stress Testing
Running a solid web stress test is as much about dodging common pitfalls as it is about following a perfect plan. Even a well-designed test can spit out misleading results if you fall into a few frequent traps. Steering clear of these mistakes is the only way to ensure your efforts produce reliable, actionable insights that actually make your application more resilient.
One of the most common errors I see is testing in an unrealistic environment. It’s a classic mistake. If your staging server has only a fraction of the power of your production setup, your test results are basically meaningless. You’ll either chase down bottlenecks that don’t exist in the real world or, even worse, miss critical failures that will absolutely pop up during a real high-traffic event.
Ignoring How Real People Behave
Another major blunder is relying only on clean, predictable synthetic traffic. Real users are chaotic. They abandon carts, mash the refresh button, and click on things in weird, unexpected orders. A test that misses this chaos won’t find the complex, state-dependent bugs that bring down real-world systems. This is precisely why simulating real user journeys is so critical.
Stopping a test at the first sign of trouble is just a wasted opportunity. The whole point of a web stress test isn’t just to see if it breaks, but to understand how it breaks. Pushing past that initial failure helps you see how the system recovers—or doesn’t—and find those nasty cascading failure points.
Overlooking the Outside World
Finally, teams often completely forget about network conditions and third-party dependencies. Ignoring things like network latency can hide major performance issues that only show up for users who are geographically far from your servers. A few key mistakes to avoid include:
- Testing Too Late: Stress testing should be part of your regular routine, not a frantic, last-minute check before a big launch.
- Poor Communication: Forgetting to tell stakeholders about test schedules and potential impacts can cause a lot of unnecessary panic.
- Misinterpreting Results: Just noting when the system broke without digging into why it broke is missing the whole point.
The pressure to guarantee uptime is especially intense in competitive markets. For instance, North America is projected to account for 31% of the stress testing market’s growth through 2028, mostly driven by large companies with complex systems. One major US retailer used realistic stress testing to uncover bottlenecks at 500,000 concurrent users, which prevented a massive outage during Cyber Monday—exactly the kind of scenario tools like GoReplay are built to simulate. Explore more data on the stress testing software market.
Common Questions About Web Stress Testing
Even with a solid plan, a few questions always pop up before running a web stress test. Let’s clear up the common ones so you can move forward with confidence.
What’s the Real Difference Between a Stress Test and a Load Test?
Think of it like testing a bridge. A load test makes sure the bridge can handle its expected, everyday traffic—the normal flow of cars and trucks. It’s all about confirming stability under a known workload.
A web stress test, on the other hand, is about finding the breaking point. We keep adding more and more trucks until the bridge starts to buckle. The goal isn’t just to see if it works; it’s to discover when it fails and how it fails. Load testing is about stability; stress testing is about discovery.
How Much Load Is Enough for a Stress Test?
There’s no magic number here, because the entire point is to find your system’s breaking point. You need to keep increasing the load until you see serious performance degradation or an outright failure.
A great starting point is to take your current peak traffic and multiply it. Start with 2x, then push to 5x, 10x, or even higher. Keep going until something gives.
The “right” amount of load is whatever it takes to reveal your system’s true capacity. That number becomes a critical benchmark for planning your scaling strategy.
Why Is Real Traffic Replay So Much Better Than Scripted Tests?
Simple: scripted tests are neat and tidy, but real users are anything but. Scripts follow predictable paths, completely missing the chaotic, unpredictable behavior that causes most real-world failures. They can’t simulate a user who frantically refreshes a page, abandons a cart midway, or clicks on everything at once.
Real traffic replay with a tool like GoReplay captures all of that authentic chaos. It replays every weird click, every unexpected request sequence, and every abandoned session exactly as it happened. This approach uncovers the hidden bottlenecks and tricky edge cases that a clean script would never find, giving you a far more honest picture of how your application holds up under pressure.
Ready to stop guessing and find your application’s true limits? With GoReplay, you can use real user traffic to run the most realistic stress test possible. Capture and replay your live traffic to find and fix bottlenecks before they ever affect your users.