Supercharge Your Web App Performance
Slow web applications frustrate users and impact your bottom line. This listicle presents ten powerful web application performance testing tools to help identify and eliminate performance bottlenecks before they affect your users. Discover the best tool for your needs, whether you’re a startup or an enterprise, using this curated list of top solutions, including GoReplay, Apache JMeter, LoadRunner, k6, Gatling, BlazeMeter, NeoLoad, Artillery, WebLOAD, and Locust. Learn about each tool’s key features and strengths to optimize your web application performance testing strategy.
1. GoReplay
GoReplay stands out as a powerful and versatile open-source tool specifically designed for capturing and replaying real HTTP traffic, making it an invaluable asset for web application performance testing. Unlike synthetic testing tools that rely on simulated user behavior, GoReplay leverages actual production traffic, providing a highly realistic testing environment that mirrors the complexities of real-world user interactions. This approach enables developers, QA engineers, DevOps professionals, and IT teams to proactively identify and address performance bottlenecks, vulnerabilities, and other potential issues before they impact end-users, ensuring a stable and reliable application experience. This ability to test against genuine user behavior is what sets GoReplay apart in the realm of web application performance testing tools.
GoReplay’s strength lies in its ability to transform live production traffic into actionable testing scenarios. Its session-aware replay capabilities, coupled with sophisticated features like session boundary preservation, connection pooling, and TLS optimization, ensure accurate replication of real user behavior, including complex interactions like user logins, shopping cart activity, and form submissions. This level of realism is crucial for identifying hidden vulnerabilities and performance issues that might be missed by traditional synthetic testing methods. Furthermore, GoReplay’s load testing features allow teams to scale tests using authentic traffic patterns, moving beyond guesswork and providing confident capacity planning and performance evaluations.
GoReplay’s real-time monitoring and analytics dashboards empower teams with proactive alerts and pattern detection. This allows for early identification of potential problems, enabling quick remediation and minimizing the risk of production disruptions. The inclusion of such comprehensive monitoring capabilities significantly streamlines the testing process and helps ensure the overall stability and performance of the application. Imagine being able to pinpoint the root cause of a performance degradation before it affects your users – that’s the power GoReplay brings to the table.
GoReplay offers both a robust free open-source version and a feature-rich Pro edition, catering to a wide range of users and organizational needs. The open-source version is ideal for individual developers and small teams looking to integrate realistic traffic replay into their testing workflows. For enterprise-level requirements, the Pro version offers advanced features such as advanced traffic storage, crucial for large-scale testing, data masking for enhanced security and compliance, priority expert support for rapid issue resolution, and WebSocket integration for testing modern web applications that rely on real-time communication.
While the open-source version is free to use, pricing for the GoReplay Pro edition is available upon request, allowing for tailored solutions to fit specific organizational budgets and requirements. This tailored approach may require some additional time for procurement compared to publicly listed pricing models. Also, while GoReplay’s command-line interface offers significant flexibility and control, it can present a learning curve for users unfamiliar with such tools. However, the comprehensive documentation and active community support provided through its extensive GitHub presence (18k+ stars and contributions from over 100 enterprise teams) make it easier to overcome this initial hurdle.
Compared to other web application performance testing tools like JMeter or Gatling, which primarily rely on scripted simulations, GoReplay distinguishes itself by leveraging real production traffic. This offers a significant advantage in terms of realism and accuracy, ensuring that tests reflect the genuine complexities of user behavior. If you’re looking for a way to test your web application under realistic conditions, using the same traffic patterns that your users generate, GoReplay is an exceptional choice. It empowers you to confidently assess performance, uncover hidden vulnerabilities, and ultimately, deliver a superior user experience. You can explore GoReplay and its documentation further on their official website: https://goreplay.org.
2. Apache JMeter
Apache JMeter is a powerful, open-source, Java-based application specifically designed for web application performance testing. While initially created for testing web applications, its capabilities have broadened to encompass a wider range of test functions, making it a versatile tool for assessing the performance of various systems. JMeter simulates real-world user loads, enabling you to analyze your application’s behavior under stress and identify potential bottlenecks before they impact your users. This makes it an essential tool for software developers, quality assurance engineers, enterprise IT teams, DevOps professionals, and tech-savvy business leaders seeking to ensure the stability and responsiveness of their web applications. It’s a key player in the arena of web application performance testing tools, providing a robust and flexible platform for comprehensive performance evaluation.
JMeter simulates heavy loads on a single server, a cluster of servers, a network, or even individual objects, allowing you to test their resilience and measure overall performance under various load types. You can configure JMeter to mimic different user scenarios, such as browsing product pages, adding items to a cart, and completing the checkout process, providing a realistic simulation of user behavior. This comprehensive approach to load testing makes JMeter invaluable for identifying performance bottlenecks and ensuring your application can handle real-world traffic demands.
One of JMeter’s standout features is its multi-protocol support. It can handle HTTP, HTTPS, FTP, JDBC, SOAP, and REST, offering flexibility for testing a wide range of applications and services. This multi-protocol capability allows you to test not just your web frontend but also backend databases and APIs, ensuring end-to-end performance. Furthermore, JMeter supports distributed testing across multiple machines, allowing you to simulate massive user loads that a single machine couldn’t generate. This is crucial for stress testing and accurately gauging your application’s performance limits. Real-time result visualization and reporting features provide immediate feedback during testing, enabling quick identification and resolution of performance issues. Learn more about Apache JMeter to delve deeper into its REST API testing capabilities.
JMeter’s extensibility is another major advantage. Its plugin architecture and support for custom components allow you to tailor the tool to your specific testing needs. You can integrate JMeter with other tools in your development pipeline, further enhancing its versatility and making it a central component of your performance testing strategy. Being completely free and open-source, JMeter eliminates licensing costs, making it accessible to organizations of all sizes. Coupled with a large and active community providing extensive documentation and support, you have access to a wealth of resources to help you get started and troubleshoot any issues you might encounter. JMeter’s cross-platform compatibility, stemming from its Java foundation, ensures it can be used on various operating systems, further adding to its flexibility.
While JMeter offers a powerful and flexible platform, it’s important to be aware of its potential drawbacks. The GUI can become resource-intensive and slow during large-scale tests, impacting the testing process. Additionally, JMeter has a steeper learning curve for beginners compared to some other web application performance testing tools. Its browser simulation capabilities are also somewhat limited, although this is often mitigated through integration with other tools. Finally, memory consumption can be high, particularly for complex test plans with large datasets.
Despite these limitations, JMeter’s robust feature set, open-source nature, and extensive community support make it a valuable tool for any team serious about web application performance testing. The tool is freely available for download from the official website: https://jmeter.apache.org/. Implementing JMeter involves downloading the Java runtime environment (if not already installed), downloading the JMeter distribution, and configuring your test plan within the JMeter GUI. While the initial setup might require some effort, the long-term benefits of having a comprehensive performance testing solution far outweigh the initial investment in learning the tool.
3. LoadRunner
LoadRunner by Micro Focus is a stalwart in the arena of web application performance testing tools, offering a comprehensive suite of features designed for simulating real-world user loads and pinpointing performance bottlenecks. Its enterprise-grade capabilities make it a popular choice among organizations seeking to rigorously test the robustness and scalability of their web applications. As one of the most established players in the market, LoadRunner has built a reputation for its ability to handle complex testing scenarios, supporting over 50 different protocols and technologies, ranging from web and mobile applications to enterprise-level systems. This versatility makes it suitable for testing a wide range of applications, ensuring that they can withstand the demands of heavy user traffic and deliver a seamless user experience. LoadRunner is a key tool for organizations looking to optimize their web application performance and avoid costly downtime. Its deep analysis capabilities and enterprise-level features justify its position as a leader in this space.
At the heart of LoadRunner lies VuGen (Virtual User Generator), its powerful scripting engine. VuGen allows developers and QA engineers to simulate realistic user interactions with the application, replicating complex workflows and user behavior patterns. These virtual users can be configured to perform a variety of actions, such as browsing pages, submitting forms, and interacting with database queries. This allows for accurate simulation of real-world usage scenarios, providing valuable insights into the application’s performance under stress. Learn more about LoadRunner to understand how load testing contributes to overall application improvement. Furthermore, LoadRunner’s real-time monitoring and analysis dashboard provide a comprehensive view of the application’s performance metrics during test execution. This allows testers to identify performance bottlenecks quickly and efficiently, enabling timely remediation and optimization. Metrics like response times, transaction rates, and resource utilization are readily available, facilitating a detailed analysis of the application’s behavior under various load conditions.
One of LoadRunner’s key strengths is its broad protocol support, covering over 50 technologies, including web, mobile, and various enterprise applications. This wide coverage ensures compatibility with a diverse range of applications, making it a versatile choice for organizations with complex IT environments. Beyond its technical capabilities, LoadRunner offers both cloud and on-premise deployment options, providing flexibility in how organizations deploy and manage their testing infrastructure. This adaptable approach allows teams to choose the deployment model that best fits their specific needs and resources. Integration with CI/CD pipelines and ALM tools further enhances LoadRunner’s utility, enabling seamless integration into existing development workflows. This streamlines the testing process and promotes a DevOps approach to software development.
While LoadRunner boasts a powerful feature set, it’s important to consider the associated costs and technical requirements. The licensing fees can be substantial, making it a significant investment, particularly for smaller organizations or those with limited testing budgets. Furthermore, the setup and configuration can be complex, requiring significant training and expertise to effectively utilize the tool’s full potential. The resource-intensive nature of the installation and maintenance also requires careful planning and dedicated resources.
Despite its complexity and cost, LoadRunner’s comprehensive features, mature toolset, excellent technical support, and extensive documentation make it a strong choice for organizations requiring robust and scalable web application performance testing. Its powerful analysis and reporting capabilities, coupled with its proven track record in enterprise environments, make it a valuable asset for ensuring application performance and reliability. If your organization requires extensive protocol support, detailed analysis, and can accommodate the cost and resource requirements, LoadRunner offers a proven solution for enterprise-grade web application performance testing. You can find more information about LoadRunner and its offerings on their website.
4. k6
k6 is a modern open-source load testing tool specifically designed for developers and DevOps teams looking to integrate performance testing seamlessly into their CI/CD pipelines. Unlike older, GUI-driven performance testing tools, k6 embraces a developer-centric approach by using JavaScript ES6 for scripting. This allows developers to leverage their existing JavaScript skills to create realistic and maintainable performance tests. k6 focuses on providing a clean, approachable scripting API and a command-line interface, making it ideal for automated testing and integration with modern development workflows. Its efficiency and flexibility make it an excellent choice for testing web application performance, ensuring reliability and scalability under stress. k6 is a powerful tool for incorporating performance testing as a core component of the software development lifecycle, promoting a culture of performance-driven development.
One of k6’s most compelling features is its use of JavaScript ES6 for test scripting. This modern language choice allows developers to write clear, concise, and maintainable performance test scripts. This eliminates the steep learning curve often associated with proprietary scripting languages found in other tools. Developers can leverage familiar JavaScript libraries and frameworks, significantly streamlining the test creation process. The built-in support for HTTP/1.1, HTTP/2, and WebSocket protocols allows k6 to simulate various real-world scenarios, providing comprehensive coverage for modern web applications that utilize these communication methods.
k6 offers both cloud-based and on-premise execution options. The cloud execution provides easy scalability and distributed load generation for large-scale performance tests, while the on-premise option gives organizations complete control over their testing infrastructure. This flexibility makes k6 adaptable to various testing environments and requirements. The tight integration with popular CI/CD platforms allows teams to automate performance testing as part of their development pipelines. By setting threshold-based pass/fail criteria, k6 can automatically evaluate test results and provide immediate feedback on performance regressions, enabling developers to catch performance issues early in the development cycle. This proactive approach helps to ensure that performance remains a priority throughout the development process.
Comparing k6 to other popular web application performance testing tools like JMeter and Gatling reveals its strengths and weaknesses. While JMeter offers a wider range of protocol support and a GUI for test creation, it can be resource-intensive and its XML-based scripting can become complex for large tests. Gatling, another popular open-source tool that uses Scala for scripting, offers excellent performance but can have a steeper learning curve for teams not familiar with Scala. k6, with its focus on JavaScript and developer experience, strikes a balance between ease of use, performance, and integration with modern development workflows.
Implementing k6 is straightforward. Developers can install k6 using package managers like npm or brew. After installation, tests can be written using JavaScript in .js files. The k6 command-line interface provides numerous options for configuring tests, setting thresholds, and specifying execution options. For example, a simple test to check the performance of a website’s homepage might look like this:
import http from ‘k6/http’; import { check, sleep } from ‘k6’;
export default function () { let res = http.get(‘https://test.k6.io’); sleep(1); check(res, { ‘status was 200’: (r) => r.status == 200 }); }
k6 offers a free tier for basic usage, including open-source features and community support. For more advanced features like cloud execution, distributed testing, and advanced analytics, k6 offers various paid plans tailored for different team sizes and requirements. Specific pricing details are available on the k6 website.
While k6 offers many advantages, it’s crucial to be aware of its limitations. Compared to established enterprise tools like LoadRunner, k6 has limited protocol support. While it excels at HTTP-based testing, it may not be suitable for applications relying on less common protocols. The lack of a GUI for test creation might be a drawback for some users accustomed to visual test builders. However, the script-based approach allows for greater flexibility and control over test scenarios.
Overall, k6 stands out as a powerful and developer-friendly web application performance testing tool. Its JavaScript-based scripting, excellent CI/CD integration, and focus on modern development workflows make it an ideal choice for teams looking to incorporate performance testing into their agile processes. While it might not have all the features of enterprise-grade solutions, its ease of use, performance, and strong community support make it a valuable addition to any web application performance testing toolkit. You can find more information and download k6 from their official website: https://k6.io/
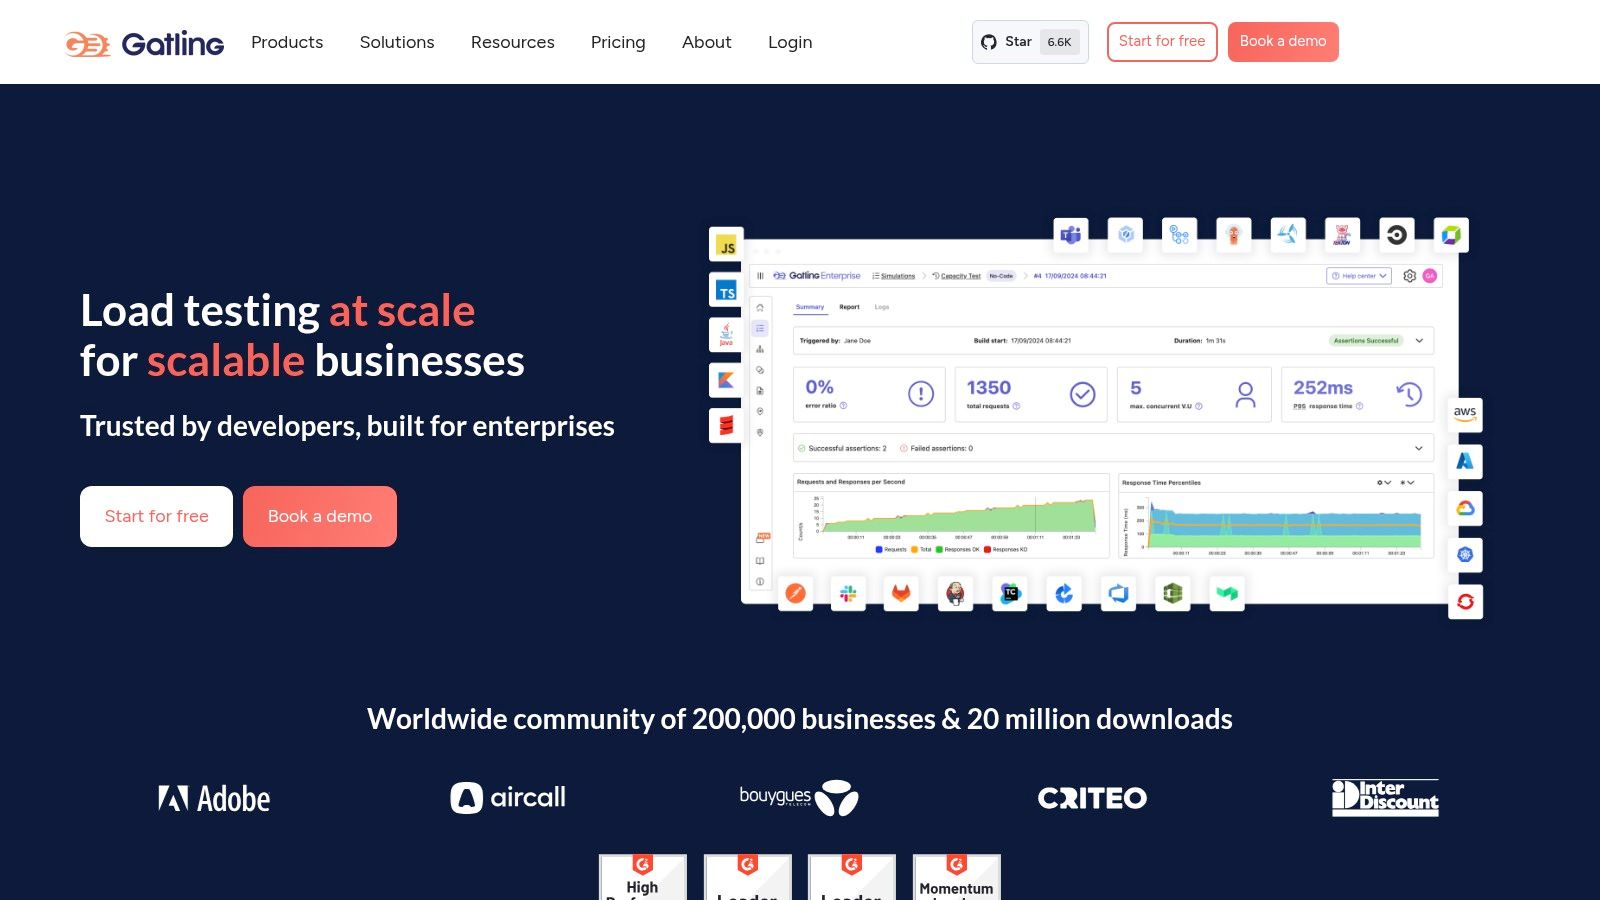
5. Gatling: High-Performance Load Testing for the Modern Web
Gatling is a powerful open-source load testing framework built for high performance and ease of use. Leveraging Scala, Akka, and Netty, it provides a robust platform for simulating thousands of concurrent users interacting with your web application. This allows developers and QA engineers to identify performance bottlenecks and ensure their applications can handle real-world traffic loads. Its detailed reports, minimal resource consumption, and focus on continuous load testing make it a top choice for modern web application performance testing. Gatling earns its place on this list due to its performance capabilities, sophisticated reporting, and elegant DSL for crafting complex test scenarios. This makes it ideal for teams striving for high performance and reliability in their web applications.
Gatling’s architecture is designed around asynchronous processing, enabling it to simulate vast user loads with minimal overhead. This asynchronous nature allows Gatling to efficiently manage resources and provide accurate performance metrics, even under extreme stress. Unlike traditional thread-based load testing tools, Gatling uses a message-passing architecture, which allows it to handle thousands of concurrent users on a single machine.
One of Gatling’s standout features is its Scala-based Domain Specific Language (DSL). This DSL offers a concise and expressive way to define complex user scenarios, including loops, conditional logic, and data-driven testing. While requiring some Scala knowledge for advanced scripting, the DSL is surprisingly readable and allows developers to create sophisticated test cases that accurately mimic real-world user behavior. The recorder further simplifies test creation by capturing user interactions and automatically generating Gatling scripts. This is a significant time-saver, especially for complex user journeys.
Real-time monitoring is another key strength of Gatling. During test execution, Gatling provides a live dashboard that displays key performance indicators like response times, requests per second, and error rates. This real-time feedback allows teams to quickly identify and address performance bottlenecks. Post-test, Gatling generates detailed HTML reports that visualize performance metrics and provide deep insights into application behavior under load. These reports are highly customizable and can be easily shared with stakeholders.
Gatling seamlessly integrates with popular CI/CD tools like Jenkins and build tools like Maven and SBT. This integration facilitates continuous load testing, enabling teams to identify and resolve performance regressions early in the development lifecycle. By incorporating Gatling into the CI/CD pipeline, organizations can proactively address performance issues and ensure a consistently positive user experience.
Comparing Gatling with similar tools like JMeter and Locust:
While JMeter offers a more comprehensive GUI and wider plugin support, Gatling’s performance and elegant DSL are often preferred for complex load testing scenarios. Locust, being Python-based, is easier to learn for Python developers, but may lack the performance capabilities of Gatling for very high loads. The choice depends on the specific needs of the project and the team’s expertise.
Implementation and Setup Tips:
- Start with the Recorder: Use the Gatling recorder to capture user journeys and generate basic scripts.
- Familiarize yourself with the Scala DSL: Even basic Scala knowledge greatly enhances your ability to create customized and realistic test scenarios.
- Leverage feeders for data-driven testing: Gatling provides powerful feeders for injecting realistic data into your tests.
- Integrate with your CI/CD pipeline: Automate your load testing by integrating Gatling with Jenkins or other CI/CD tools.
Pricing and Technical Requirements:
Gatling is open-source and free to use. The Gatling Enterprise edition offers advanced features like real-time monitoring, distributed load testing, and integration with enterprise monitoring tools. Pricing for the Enterprise edition is available on request. Gatling requires Java 8 or later to run.
Pros:
- Excellent performance with low resource consumption.
- Beautiful and detailed HTML reports.
- Strong support for modern web technologies.
- Active open-source community.
Cons:
- Requires Scala knowledge for advanced scripting.
- Learning curve for developers unfamiliar with functional programming.
- Limited GUI compared to some commercial tools.
- Enterprise features require a commercial license.
Website: https://gatling.io/
Gatling is a valuable tool for any team serious about web application performance. Its focus on performance, combined with a powerful DSL and detailed reporting, makes it an excellent choice for simulating complex user scenarios and identifying performance bottlenecks. While the learning curve might be slightly steeper compared to some other tools, the benefits in terms of performance and accuracy make it a worthwhile investment.
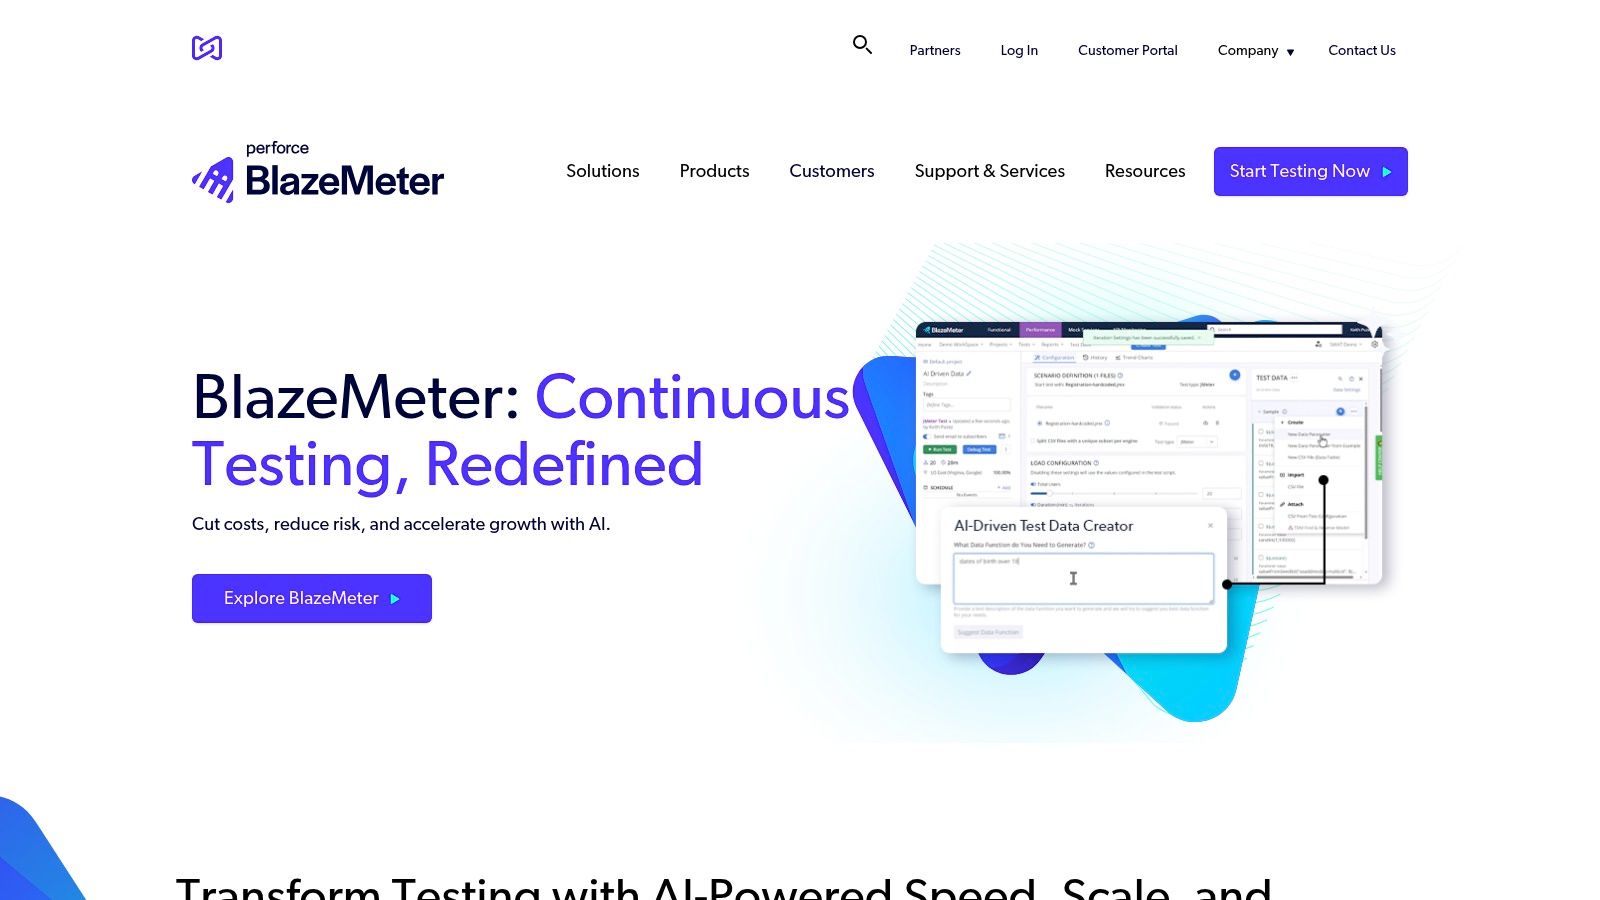
6. BlazeMeter
BlazeMeter is a robust, cloud-based performance testing platform that significantly extends the capabilities of the popular open-source tool, JMeter, by bringing it to the cloud. It offers a comprehensive solution for web application performance testing, enabling DevOps teams to conduct continuous testing and execute large-scale load tests from multiple geographic locations around the world. BlazeMeter caters to a wide range of users, offering both self-service options for smaller teams and more tailored enterprise solutions for larger organizations with complex testing needs. Its position on this list is well-deserved due to its scalability, ease of use, and deep integration with existing DevOps workflows, making it a powerful choice for ensuring web application performance under pressure.
One of BlazeMeter’s key strengths lies in its ability to simplify load testing. Instead of requiring users to manage their own testing infrastructure, BlazeMeter handles the complexities of provisioning and scaling servers in the cloud. This allows teams to focus on test design and analysis, rather than infrastructure management. The platform’s compatibility with JMeter means existing JMeter scripts can be readily used within BlazeMeter, minimizing the learning curve and allowing teams to leverage their prior investments in test script development. BlazeMeter enhances these capabilities by providing additional enterprise-grade features like advanced reporting, real-time monitoring, and distributed testing.
Practical applications of BlazeMeter are numerous and span various industries. E-commerce businesses, for instance, can use BlazeMeter to simulate Black Friday or Cyber Monday traffic loads, ensuring their websites can handle the surge in user activity without performance degradation. Gaming companies can leverage the platform to stress test their game servers before launching a new game or expansion, identifying potential bottlenecks and ensuring a smooth gaming experience for players. Financial institutions can use BlazeMeter to test the resilience of their online banking platforms, ensuring they remain available and performant under heavy load. These are just a few examples of how BlazeMeter helps businesses ensure their web applications are capable of handling real-world traffic scenarios.
BlazeMeter offers various pricing tiers based on virtual user hours, test duration, and included features. While specific pricing details are available on their website, it’s worth noting that subscription-based pricing can be a significant investment, especially for large-scale testing needs. This cost, however, must be weighed against the benefits of simplified infrastructure management, global test execution, and comprehensive reporting capabilities.
In terms of technical requirements, BlazeMeter is primarily a cloud-based service, requiring a stable internet connection for access. While JMeter expertise can be beneficial, it’s not strictly required as BlazeMeter provides a user-friendly interface for designing and executing tests.
Compared to similar web application performance testing tools like LoadRunner or Gatling, BlazeMeter stands out for its cloud-based nature and JMeter integration. While LoadRunner offers extensive features and protocol support, it can be complex to set up and manage. Gatling, on the other hand, is a powerful open-source tool but requires more coding expertise compared to BlazeMeter’s user-friendly interface. BlazeMeter strikes a balance between ease of use and powerful features, making it a strong contender in the performance testing space.
Implementing BlazeMeter is relatively straightforward. Teams can sign up for a free trial or a paid subscription on the BlazeMeter website (https://www.blazemeter.com/). Once an account is created, users can upload existing JMeter scripts or create new tests using BlazeMeter’s web interface. The platform provides detailed documentation and tutorials to guide users through the process of configuring tests, setting up virtual user distributions, and analyzing test results. One tip for successful implementation is to start with smaller-scale tests to familiarize yourself with the platform and gradually increase the load as you gain confidence. Another important aspect is to define clear performance goals and metrics before testing to ensure you’re measuring the right things and can effectively interpret the results. Finally, integrating BlazeMeter with your CI/CD pipeline allows for automated performance testing as part of your development workflow, enabling continuous performance optimization.
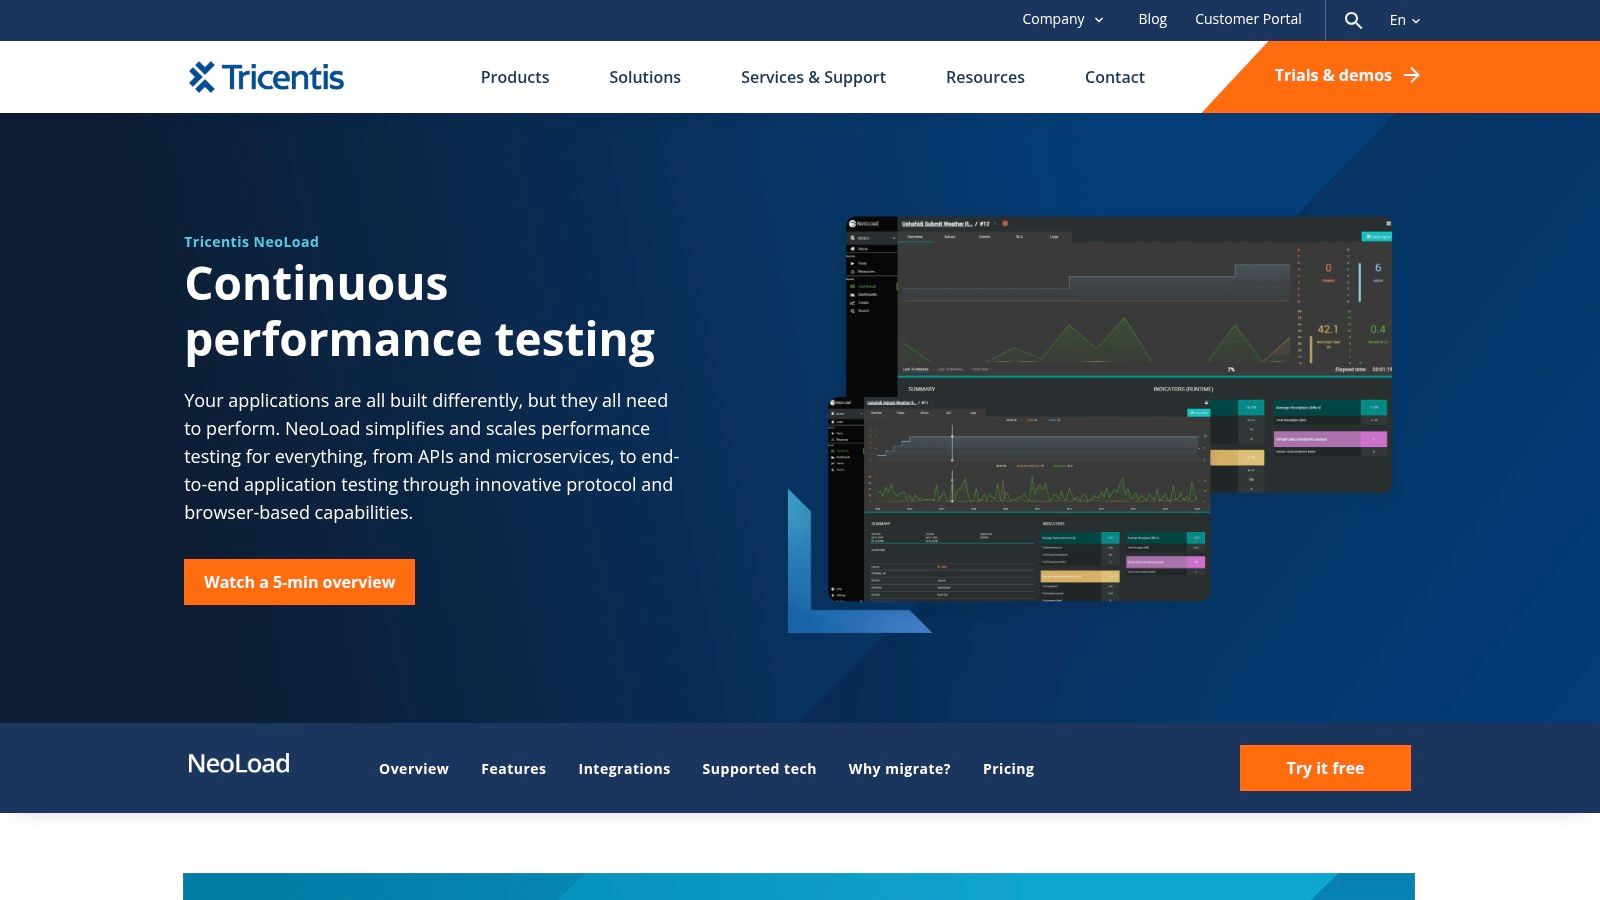
7. NeoLoad
NeoLoad is a robust enterprise-grade performance testing platform developed by Neotys, specifically designed for continuous performance testing. It empowers teams to realistically simulate user load for both web and mobile applications, providing advanced monitoring and analysis capabilities to pinpoint performance bottlenecks and ensure optimal application responsiveness. NeoLoad offers flexibility in deployment with both on-premise and cloud-based options, catering to diverse organizational needs and infrastructure preferences. Its inclusion in this list of top web application performance testing tools is warranted by its comprehensive feature set, sophisticated analysis capabilities, and focus on integrating performance testing into the continuous delivery pipeline.
NeoLoad shines in its ability to handle complex web application scenarios. Its codeless test design interface makes it accessible to testers with varying levels of scripting expertise, while still offering advanced scripting options for complex customizations using JavaScript. This flexibility makes it a versatile tool for both quick smoke tests and comprehensive performance evaluations. Real browser and mobile device simulation ensures accurate performance measurement reflecting actual user experience. NeoLoad supports a wide range of protocols, including HTTP/S, WebSocket, and various mobile protocols, broadening its application across different web application architectures.
A key strength of NeoLoad lies in its advanced correlation and parameterization features. Dynamically handling session IDs, timestamps, and other volatile data within test scripts is simplified, ensuring the accuracy and reliability of test results. The integration with infrastructure monitoring and Application Performance Monitoring (APM) tools provides a holistic view of the entire system under test, allowing teams to correlate performance bottlenecks with underlying infrastructure issues. This is particularly valuable for identifying root causes of performance degradation and optimizing resource allocation.
NeoLoad seamlessly integrates with Continuous Integration/Continuous Delivery (CI/CD) pipelines. This integration allows performance testing to become an integral part of the development lifecycle, enabling teams to detect and address performance issues early in the development process. This proactive approach to performance management significantly reduces the risk of performance regressions reaching production environments.
Practical Applications and Use Cases:
- Load Testing E-commerce Platforms: Simulating high-traffic scenarios during peak shopping seasons to ensure the platform can handle the load.
- Performance Testing Mobile Banking Applications: Validating responsiveness and stability under varying network conditions and user loads.
- Stress Testing Web APIs: Identifying breaking points and performance limitations of critical APIs.
- Monitoring Performance of SaaS Applications: Continuously monitoring performance to ensure Service Level Agreements (SLAs) are met.
Pricing and Technical Requirements:
NeoLoad offers a range of licensing options, including perpetual and subscription-based models. The pricing structure is complex and depends on the number of virtual users and the required features. Contacting Neotys directly for a customized quote is recommended. Technically, NeoLoad requires a dedicated machine for the controller and load generators. The system requirements vary depending on the scale of the performance tests being executed.
Comparison with Similar Tools:
Compared to open-source tools like JMeter, NeoLoad offers a more user-friendly interface and advanced features like real browser simulation and robust reporting. However, JMeter benefits from a larger community and free availability. Compared to other commercial tools like LoadRunner, NeoLoad offers a potentially more streamlined approach to test design and execution, though pricing should be carefully evaluated against specific needs.
Implementation/Setup Tips:
- Invest in proper training to fully utilize NeoLoad’s advanced capabilities.
- Start with smaller-scale tests and gradually increase the load to identify bottlenecks systematically.
- Leverage the integration with monitoring tools to gain a comprehensive view of system performance.
- Utilize the scripting capabilities to customize test scenarios and handle complex application logic.
Pros:
- User-friendly interface with powerful capabilities.
- Excellent real browser and mobile simulation.
- Strong monitoring and analysis features.
- Good technical support and training resources.
Cons:
- Expensive enterprise licensing.
- Complex pricing structure.
- Requires training for effective utilization.
- Smaller community compared to open-source alternatives.
Website: https://www.neotys.com/neoload/overview
NeoLoad is a powerful web application performance testing tool suitable for organizations requiring robust performance testing capabilities and seamless CI/CD integration. While the cost might be a factor, its comprehensive features and advanced capabilities make it a valuable investment for businesses prioritizing application performance and user experience. For organizations seeking a user-friendly yet powerful performance testing platform for complex web applications, NeoLoad is undoubtedly a strong contender.
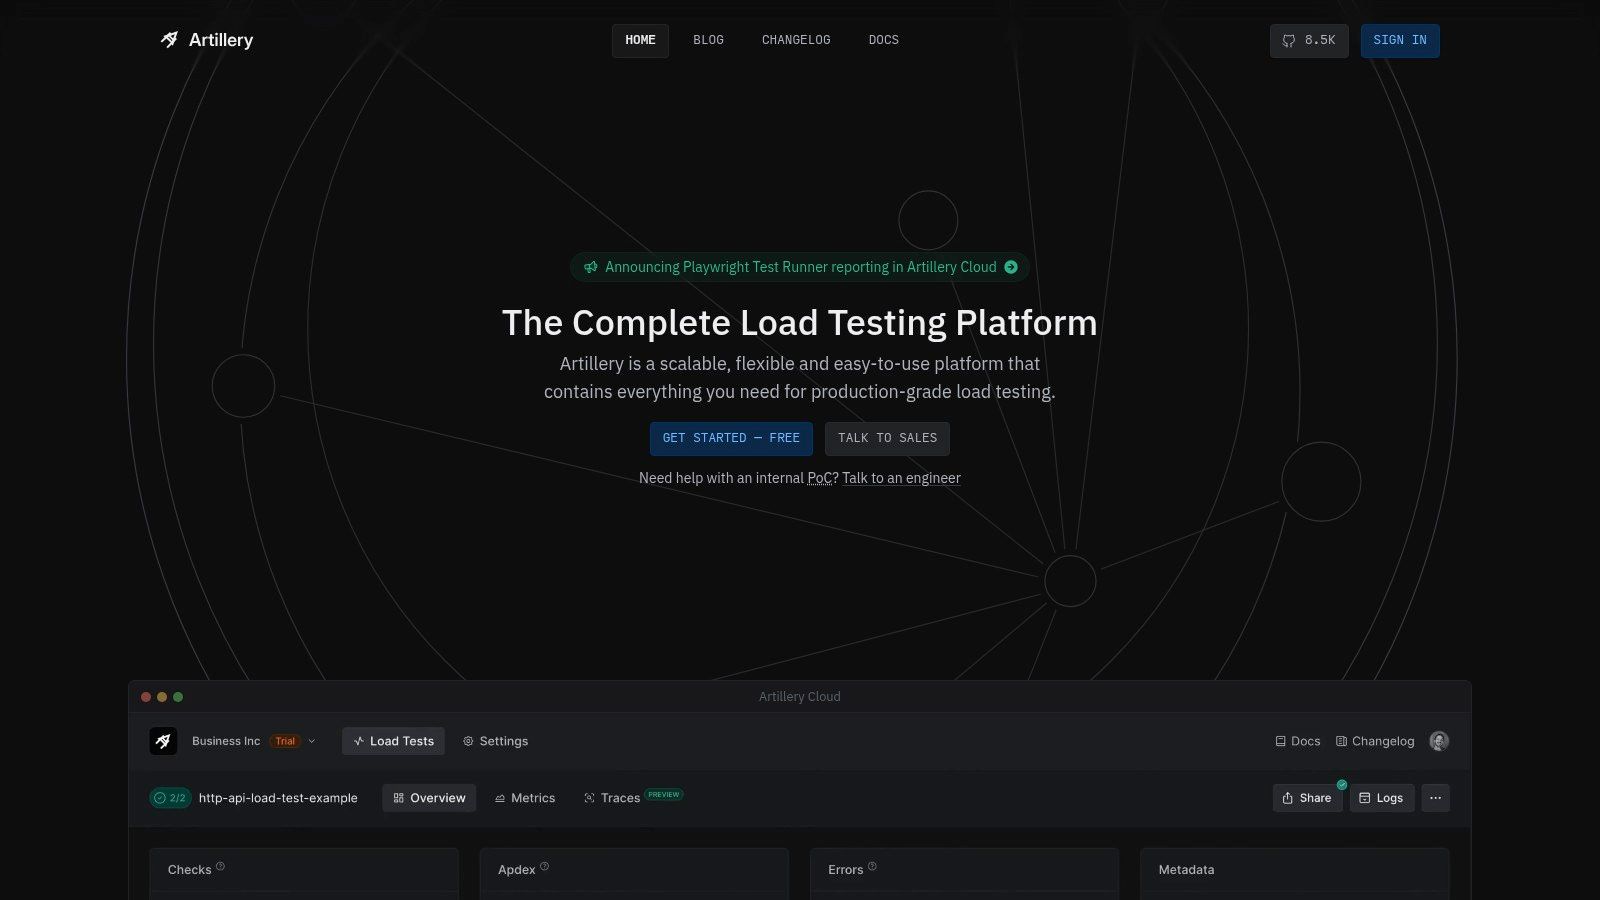
8. Artillery
Artillery is a modern, powerful, and easy-to-use load testing and functional testing toolkit built on Node.js. Specifically designed for testing HTTP services, WebSocket services, and AWS Lambda functions, it stands out for its developer-friendly approach while still offering enterprise-grade performance testing capabilities. This makes it a strong contender among web application performance testing tools for development teams and QA professionals alike.
Artillery shines in scenarios where you need to quickly create and execute load tests against various services. Its YAML-based test configuration, coupled with JavaScript hooks, provides both simplicity and flexibility. This allows developers to define complex test scenarios, including custom logic and dynamic data generation, without getting bogged down in complex scripting. If you’re dealing with HTTP APIs, WebSocket-based real-time applications, or even serverless functions deployed on AWS Lambda, Artillery offers a streamlined way to simulate heavy user traffic and analyze system performance under stress.
One of Artillery’s most compelling features is its real-time reporting and metrics. During a test run, Artillery provides a live dashboard displaying key performance indicators like response times, request throughput, concurrency, and error rates. This immediate feedback loop allows you to quickly identify bottlenecks and performance regressions. Furthermore, Artillery’s plugin system enables extending its core functionalities, offering integrations with various monitoring and reporting tools. You can, for instance, easily integrate with Datadog or InfluxDB to collect and visualize performance metrics over time. This extensibility makes Artillery adaptable to different testing environments and integrates seamlessly into existing DevOps workflows.
Compared to established enterprise web application performance testing tools like JMeter or LoadRunner, Artillery takes a more developer-centric approach. While JMeter and LoadRunner might offer a wider range of protocols and more advanced features, they often come with a steeper learning curve and more complex configuration processes. Artillery’s YAML-based configuration is significantly easier to read and write, reducing the time and effort required to create and maintain load tests. This simplicity makes Artillery a great choice for developers who need to quickly get started with performance testing without extensive prior experience.
However, it’s important to acknowledge some limitations. Artillery’s protocol support, while robust for HTTP, WebSockets, and Socket.io, is not as extensive as some enterprise tools. It might not be the ideal choice if you need to test applications using less common protocols. Additionally, while Artillery provides a solid set of core features, certain advanced features found in commercial tools, such as sophisticated scripting and scenario creation, might be less developed or require a paid subscription for Artillery Pro. The Pro version offers features like distributed load testing, advanced analytics, and dedicated support. Pricing for Artillery Pro is available on a quote basis, tailored to specific organizational needs.
Getting Started with Artillery:
Setting up Artillery is straightforward. As it’s built on Node.js, you’ll need to have Node.js and npm (Node Package Manager) installed. Installation is a simple command: npm install -g artillery. Once installed, you can define your test scenarios in YAML files and execute them using the artillery run command. The official documentation (https://artillery.io/) provides comprehensive guides and examples, making it easy to get started even for beginners.
In Summary:
Artillery finds its sweet spot in situations where developers and QA teams need a fast, flexible, and developer-friendly web application performance testing tool. Its ease of use, real-time reporting, and focus on modern protocols like WebSockets make it a compelling option. While it might not have the exhaustive feature set of some enterprise tools, its streamlined approach and active community support make it a valuable addition to any performance testing toolkit. Its lightweight nature and clear documentation also make it a great choice for smaller teams or projects where a quick and efficient performance testing solution is needed.
9. WebLOAD
WebLOAD is a robust, enterprise-grade web application performance testing tool developed by RadView. It distinguishes itself by combining performance, scalability, and integrity testing into a single process, providing a comprehensive solution for evaluating web application robustness. This makes it a valuable tool for software developers, QA engineers, and DevOps professionals seeking to ensure their applications can handle anticipated user loads and maintain functionality under stress. WebLOAD is suitable for testing a wide variety of applications, from simple web pages to complex enterprise systems and APIs.
One of WebLOAD’s strengths lies in its flexible licensing model. It offers both a free version and a professional version, catering to various needs and budgets. The free version provides ample capabilities for smaller projects and individual developers, supporting up to 50 virtual users. This allows teams to experience WebLOAD’s core functionality and determine its suitability before investing in the professional edition. The professional version unlocks the full potential of the tool, removing the virtual user limit and providing access to advanced features like distributed load generation, sophisticated analytics, and dedicated support. This tiered approach makes it a versatile option for both startups and large corporations looking for comprehensive web application performance testing tools.
WebLOAD utilizes JavaScript for scripting, which is a significant advantage for developers already familiar with the language. This reduces the learning curve and allows for faster test creation and customization. The integrated JavaScript IDE further enhances the scripting experience by offering features like code completion, debugging, and syntax highlighting. This, combined with correlation and parameterization wizards, simplifies the process of creating complex test scenarios that accurately mimic real-world user behavior. WebLOAD also boasts comprehensive protocol support, covering web, mobile, and enterprise protocols, ensuring compatibility with a wide range of applications and technologies. This broad support makes it suitable for testing everything from standard web applications to mobile backends and complex enterprise APIs.
Another key benefit of WebLOAD is its integrated performance monitoring and analysis capabilities. It provides real-time insights into various performance metrics, such as response times, throughput, error rates, and resource utilization. These metrics are crucial for identifying bottlenecks and performance issues within the application under test. Furthermore, WebLOAD’s detailed reporting features facilitate in-depth analysis of test results, enabling teams to understand performance trends, pinpoint areas for optimization, and track the impact of performance improvements over time. This rich reporting and analysis functionality empowers teams to make data-driven decisions regarding application performance and scalability.
WebLOAD supports both cloud and on-premise load generation. Cloud-based load generation offers the advantage of scalability and flexibility, allowing users to quickly spin up large-scale tests without the need to manage their own infrastructure. This is particularly beneficial for simulating peak load scenarios and stress testing applications under extreme conditions. On-premise deployment, on the other hand, provides greater control over the testing environment and is often preferred for organizations with strict security requirements or sensitive data. Offering both deployment options makes WebLOAD a highly adaptable tool, capable of fitting into various testing environments and workflows.
Compared to some of its major competitors like LoadRunner or JMeter, WebLOAD may have a smaller community and fewer readily available third-party resources. This can sometimes make troubleshooting or finding specific solutions slightly more challenging. While the free version is a great starting point, the professional version can be expensive, potentially posing a barrier for smaller organizations or individual developers. Additionally, mastering WebLOAD’s advanced features might require a steeper learning curve compared to some simpler tools. However, the comprehensive documentation and good technical support offered by RadView can help mitigate this challenge, especially for enterprise customers.
For organizations looking for comprehensive web application performance testing tools with robust scripting capabilities, excellent reporting, and flexible deployment options, WebLOAD deserves serious consideration. Its combination of powerful features, enterprise-grade capabilities, and a developer-friendly scripting environment makes it a valuable asset for ensuring web application performance and scalability. For more information or to download WebLOAD, visit https://www.radview.com/webload-download/.
10. Locust
Locust is a powerful open-source load testing tool that stands out for its developer-friendly approach and Python-centric design. Unlike many other performance testing tools that rely on cumbersome UI-based scripting or complex configuration files, Locust empowers developers to define user behavior using familiar Python code. This makes it particularly attractive to development teams already proficient in Python, allowing them to leverage their existing skills for performance testing and seamlessly integrate load tests into their development workflows. This approach also fosters greater flexibility and customization compared to tools with more rigid scripting mechanisms. Locust is an excellent choice for simulating realistic user loads and identifying performance bottlenecks in web applications, making it a valuable asset in the arsenal of web application performance testing tools.
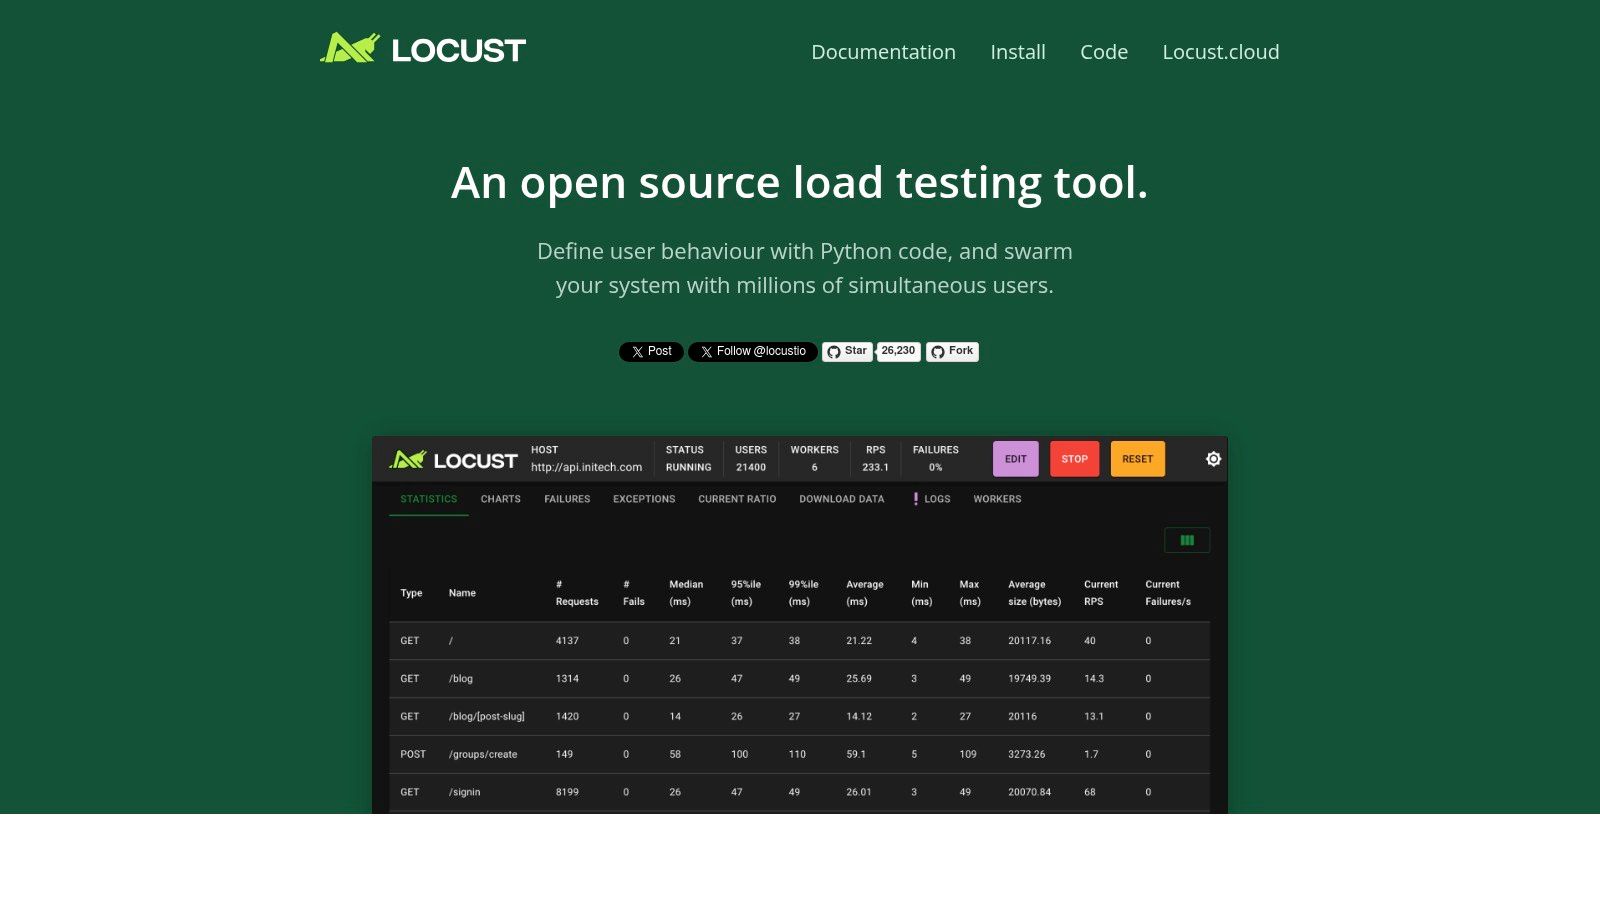
A key advantage of Locust is its distributed load generation capability. Tests can be easily distributed across multiple machines, allowing you to simulate massive user loads far exceeding the capacity of a single machine. This is crucial for accurately assessing the performance of web applications under real-world high-traffic scenarios. Locust’s web-based UI provides real-time statistics and monitoring during test execution, enabling you to observe key metrics like response times, requests per second, and error rates as the test progresses. This real-time feedback is invaluable for quickly identifying performance bottlenecks and understanding the impact of load on your application.
Locust’s extensibility is another notable strength. Its architecture allows for custom clients, which makes it suitable for testing not only HTTP-based applications but also other protocols. This flexibility extends beyond protocol support; you can customize virtually every aspect of your load tests, from the way user behavior is simulated to the metrics collected. This makes Locust an adaptable solution for a wide range of performance testing needs.
One of the most appealing aspects of Locust is its simplicity. Being lightweight and easy to set up, it minimizes the overhead associated with incorporating performance testing into your development process. Unlike some commercial tools that can be complex and require extensive training, Locust’s intuitive Python-based scripting makes it relatively straightforward to learn and use, even for developers with limited experience in performance testing.
While Locust offers numerous advantages, it’s important to consider its limitations. Its reliance on Python scripting, while a strength in terms of flexibility, means users need some level of Python programming proficiency. This might pose a barrier for teams without Python expertise. Additionally, compared to some commercial performance testing tools, Locust’s built-in reporting capabilities are less extensive. You might need to rely on external tools or custom scripts for more in-depth analysis and reporting. Its ecosystem, although growing, is smaller than that of more established tools like JMeter, which means fewer readily available plugins and integrations.
Locust is free to use, being an open-source project. It requires Python 3.7 or higher.
Comparing Locust to JMeter:
JMeter, a popular open-source performance testing tool, offers a wider range of built-in features and a larger community. However, its UI-driven scripting can be less flexible and more time-consuming than Locust’s Python-based approach, especially for complex scenarios. Locust excels in its simplicity and developer-friendliness for Python-centric teams.
Implementation Tips:
- Start small: Begin with simple test scenarios and gradually increase complexity.
- Modularize your code: Structure your Locust scripts into reusable modules for better organization and maintainability.
- Utilize the distributed load generation: Leverage multiple machines for realistic high-load simulations.
- Monitor real-time statistics: Use the web UI to identify bottlenecks and track performance trends during tests.
- Explore custom clients: Extend Locust’s capabilities to test non-HTTP protocols.
Locust deserves its place on this list because it offers a uniquely developer-centric approach to web application performance testing. Its Python-based scripting, distributed load generation, and real-time monitoring capabilities empower development teams to integrate performance testing seamlessly into their workflows and proactively address performance bottlenecks. While it might not have all the bells and whistles of some commercial tools, its simplicity, flexibility, and open-source nature make it a compelling choice, particularly for teams already comfortable with Python. You can explore Locust further on their official website: https://locust.io/.
Top 10 Web App Performance Tools Comparison
| Tool | Core Features & Capabilities | User Experience & Quality ★★★★☆ | Value & Pricing 💰 | Target Audience 👥 | Unique Selling Points ✨ |
|---|---|---|---|---|---|
| GoReplay 🏆 | Session-aware HTTP traffic replay, TLS optimization, load testing with real traffic | Real-time analytics dashboard, proactive alerts | Free OSS; Pro version with enterprise features (pricing on request) | Developers, QA, DevOps, Enterprises | Faithful traffic replay, advanced analytics, priority expert support |
| Apache JMeter | Multi-protocol support, GUI & CLI, distributed testing | Large community, extensible, cross-platform | Completely free OSS | QA engineers, testers, developers | Extensive protocol support, plugin ecosystem |
| LoadRunner | 50+ protocol support, advanced scripting, CI/CD integration | Mature, powerful analysis & reporting | Expensive commercial licensing | Large enterprises, experienced testers | Enterprise-grade with extensive protocol coverage |
| k6 | JavaScript ES6 scripting, HTTP/2 & WebSocket support | Lightweight, developer-friendly scripting | OSS base; paid cloud features | Developers, DevOps teams | Modern JS scripting, CI/CD integration |
| Gatling | High-performance async architecture, Scala DSL | Detailed HTML reports, low resource use | OSS core; commercial enterprise | Developers with Scala knowledge | High performance, detailed reports |
| BlazeMeter | Cloud test execution, JMeter compatible, global locations | Easy scaling, real-time reporting | Subscription-based pricing | DevOps teams, enterprises | Cloud-native JMeter extension |
| NeoLoad | Codeless & advanced scripting, real browser simulation | User-friendly UI, advanced monitoring | Expensive enterprise pricing | Enterprises needing realistic load tests | Real browser/mobile simulation, strong analysis |
| Artillery | YAML config, HTTP & WebSocket testing | Simple, fast, good docs | OSS core; premium paid features | Developers, small teams | Lightweight, AWS Lambda testing |
| WebLOAD | JS-based scripting, broad protocol support | Developer-friendly, comprehensive reporting | Free & professional paid versions | Enterprises, developers | Combined load & performance testing |
| Locust | Python scripting, web UI, distributed load generation | Lightweight, flexible | Free OSS | Python developers, DevOps | Python-based, extensible load generation |
Choosing the Right Web Application Performance Testing Tool
Selecting the optimal web application performance testing tools is crucial for ensuring your application can handle the demands of real-world usage. This article explored a range of options, from open-source tools like GoReplay, JMeter, and Locust to enterprise-grade platforms like LoadRunner and NeoLoad. Each tool offers unique strengths and caters to different needs and budgets. Key takeaways include understanding the importance of scripting languages, protocol support (like HTTP/2 or WebSockets), the depth and breadth of reporting capabilities, and deployment options (cloud vs. on-premise).
When evaluating web application performance testing tools, consider your project’s specific requirements. What level of load do you anticipate? Do you require advanced features like real-time monitoring or integrations with your CI/CD pipeline? Is your team comfortable with code-based scripting or do you prefer a more visual interface? For smaller projects or teams with limited budgets, open-source tools often provide a great starting point. Larger organizations with dedicated testing teams might benefit from the advanced features, robust support, and broader integrations offered by enterprise solutions.
By carefully weighing these factors, you can choose the best web application performance testing tool for your needs and ensure your application delivers a consistently positive user experience. Ready to start testing your application with real-world traffic? GoReplay is an excellent open-source option for capturing and replaying real HTTP traffic, making it a powerful tool for load testing and performance analysis. Learn more and download GoReplay at GoReplay.