Types of Performance Test: Complete Guide to Improve Your App
Ever wondered what happens if your application suddenly goes viral? Or when a marketing campaign succeeds beyond your wildest dreams? Performance testing is the critical safety net that protects your business from the chaos that comes with unexpected success.
It all boils down to answering one crucial question: “Is our system ready for the real world?”
Why Performance Testing Is Your Safety Net
Think of it like building a bridge. You wouldn’t just build it and hope for the best. You’d need to know exactly how much weight it can hold. It might look sturdy and work perfectly with a few cars, but what happens during rush hour? Without proper testing, you’re just risking a catastrophic failure when it matters most.
An untested application is exactly like that bridge—a disaster waiting to happen.
This isn’t just about preventing crashes; it’s about protecting your business’s bottom line. A slow or unavailable application directly impacts revenue, erodes the trust you’ve built with your users, and can permanently tarnish your brand’s reputation. Studies have shown that even a one-second delay in page load time can cause a 7% drop in conversions.
Performance testing is what moves your team from a state of hoping your application will work to a state of knowing it will work. It turns a risky guessing game into a strategic, data-driven advantage.
Answering Questions Before Your Customers Do
The key thing to realize is that there’s no single, one-size-fits-all “performance test.” Instead, you have various types of performance tests, and each one is designed to answer a specific question about your system’s readiness. It’s a lot like a doctor running different diagnostic tests to get a complete picture of a patient’s health.
For instance, you might need to know:
- Can our app handle the expected number of users during a Black Friday sale?
- What’s the absolute maximum traffic our servers can take before they fail?
- How does our system behave if it’s left running under a sustained, heavy load for days on end?
Each of these questions requires a different approach. The whole point is to uncover weaknesses in a controlled environment before your customers discover them in the wild. This is where modern tools become absolutely essential.
For example, a tool like GoReplay lets you capture real user traffic and replay it in your test environment, giving you a highly realistic simulation of how your application will actually behave under pressure.
By proactively simulating these real-world scenarios, you can find and fix bottlenecks, optimize how your resources are used, and guarantee a smooth, reliable experience for every single user. This process isn’t just a “nice-to-have”—it’s the foundation of building resilient, scalable, and successful software.
Load Testing Under Expected Conditions
If you think of performance testing as a general checkup for your app, then load testing is the treadmill test. It’s the most fundamental type of performance test because it answers a simple but critical question: can our system actually handle a normal, busy day?
This isn’t about pushing your app until it shatters. Instead, it’s about confirming stability under the conditions you expect it to face. Think of it as a dress rehearsal for your app’s daily rush hour. You’d never open a new restaurant without making sure the kitchen can handle the dinner service, right? Load testing does the same thing for your application, verifying it can serve users efficiently during predictable traffic peaks.
The whole process involves simulating a specific number of concurrent users interacting with your system over a set period. The goal is to see how your key metrics hold up, giving you a clear picture of what the user experience is like when your application is humming along under its typical operational pressure.
What to Watch During a Load Test
When you run a load test, you’re not just waiting for a crash. You’re gathering crucial data to understand how your system behaves. The most important metrics often reveal underlying issues long before a total failure ever happens.
Here are the key things to monitor:
- Response Time: How long does it take for the app to answer a user’s request? A slow response time is often the very first sign of trouble.
- Throughput: How many requests can the system process per second? If throughput drops as the user load climbs, you’ve likely found a bottleneck.
- Resource Utilization: How much CPU, memory, and network bandwidth are you using? High utilization can be a warning that your infrastructure is approaching its limits.
Keeping a close eye on these metrics helps you proactively manage and optimize your application. For a deeper look, check out our guide on boosting application performance with load testing, which breaks these concepts down even further.
Load testing isn’t just a pass/fail exercise. It’s a diagnostic tool that reveals how your system breathes under pressure, helping you ensure a consistently fast and reliable experience for every user, every day.
Making Load Tests Realistic and Relevant
Here’s the thing: a load test is only as valuable as it is realistic. This is where many teams get tripped up, often relying on simplistic scripts that fail to capture how real users actually behave.
It’s also why the performance testing market is projected to hit nearly USD 1.39 billion by 2033. Businesses know that simulating realistic user activity is the only way to find bottlenecks and scalability problems before they affect customers.
Tools like GoReplay solve this problem by capturing and replaying your actual production traffic. Instead of guessing how users behave, you create load tests based on what they genuinely do. This means you’re testing with authentic user flows—from someone searching for a product on an e-commerce site to another saving a document in a SaaS app—delivering results that are far more accurate and actionable.
Stress Testing to Find the Breaking Point
If load testing is your system’s dress rehearsal for a busy day, then stress testing is the part where you ask, “What happens if we push this thing until it completely snaps?” It’s one of the most intense forms of performance testing, and its entire purpose is to push your application far beyond its operational limits. On purpose.
Think of a weightlifter trying to discover their one-rep max. They aren’t just doing a regular workout; they are intentionally pushing themselves to the point of failure. Why? To find their absolute limit. Stress testing does the same for your application. The goal isn’t to “pass”—it’s to fail, but to do so in a controlled environment so you can see exactly how your system behaves under extreme pressure.
This kind of proactive failure analysis is invaluable. Does your system slow down gracefully when it’s overloaded, or does it crash and burn, taking every user session down with it? Stress testing gives you the answer before your users do.
Understanding How Your System Fails
The real goal here is to observe your system’s breaking point and, more importantly, its behavior on the way down. It’s not about finding a single number, like the maximum concurrent users. It’s about seeing how all the interconnected parts react when pushed to their absolute edge.
During a stress test, you’re on the lookout for specific failure modes:
- Memory Leaks: Does memory usage just keep climbing under heavy load without ever being released?
- Data Corruption: When things get frantic, does the system start writing garbage to your database?
- Server Crashes: Do key services or servers just give up and stop responding entirely?
- Cascading Failures: Does one small service failing trigger a domino effect that brings down the whole application?
The most critical insight from stress testing isn’t just if the system breaks, but how it breaks and—crucially—how it recovers. A system that degrades gracefully and bounces back quickly is infinitely more robust than one that just vanishes without a trace.
The Importance of Recovery
Watching the system fail is only half the story. The other, equally critical part is seeing what happens after you remove the extreme load. We call this recoverability. Does the system limp back to normal on its own, or does it need a full server restart and a team of engineers to revive it?
A system with poor recoverability can mean extended downtime, long after the traffic spike that caused the problem has passed. For a deeper dive into making sure your application can bounce back, check out our guide on stress testing in software testing to ensure application resilience.
To run these kinds of demanding tests safely, you need a way to generate extreme, worst-case traffic. This is where a tool like GoReplay shines. It can capture real production traffic and then amplify it, letting you simulate these intense events realistically without writing a single complex script. You can take your actual user behavior, multiply it, and push your system to its limits to see what happens in a crisis—all from the safety of a test environment.
6 Other Key Performance Test Types to Know
Load and stress tests are the bedrock of any solid QA strategy, but a complete diagnostic toolkit needs more specialized instruments. Think of it like a car mechanic’s garage. You have the essentials for checking pressure (load tests) and compression (stress tests), but you also need specific tools for the electrical system or the transmission.
In the world of performance testing, these specialized tests help you diagnose very specific potential problems. They go beyond expected or maximum capacity to see how your system behaves under unusual or prolonged conditions. By simulating these less common but critical scenarios, you can find weaknesses that might otherwise stay hidden until a real crisis hits.
Spike Testing
Imagine your company’s new ad runs during the Super Bowl, or a massive influencer suddenly shares a link to your site. This is where spike testing comes in. It’s designed to answer one critical question: “Can our system survive a massive, instantaneous flood of traffic?”
A spike test simulates a sudden, extreme increase in user load—far beyond what you’d see in a typical load test. The goal is to see if your system can handle the shock without crashing and then return to normal once the surge dies down. Failing a spike test means your big moment in the spotlight could turn into a very public outage.
The diagram below shows that spike testing isn’t just about one big burst. You can model it in different ways, from a single massive event to repeated, smaller spikes.
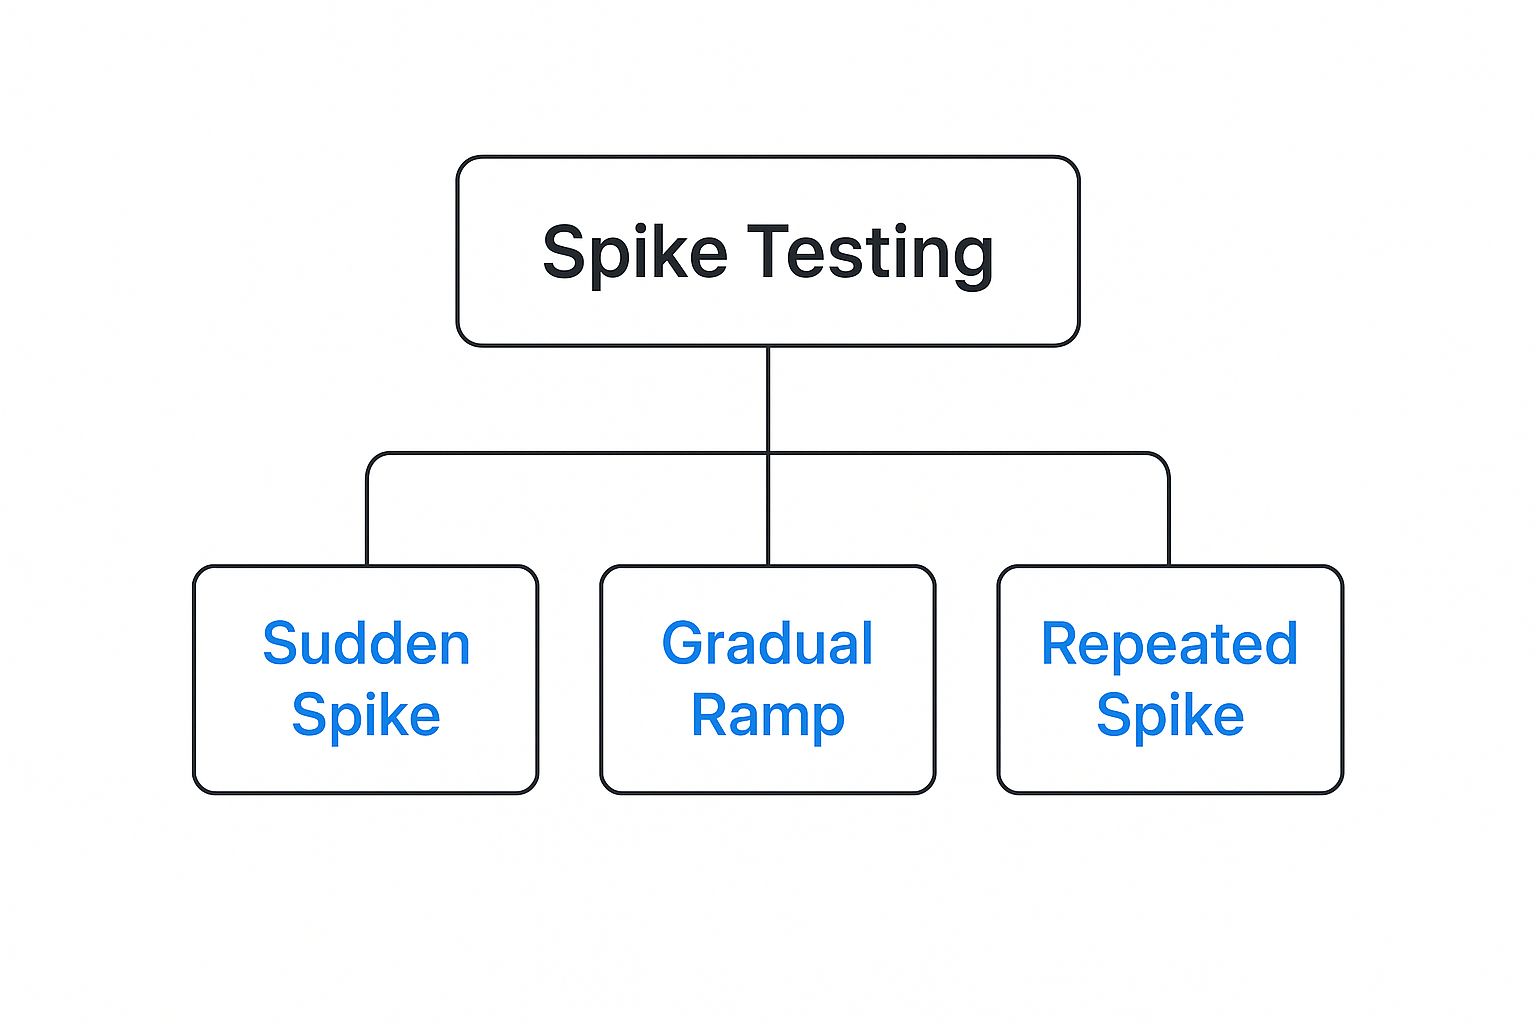
As you can see, a “spike” doesn’t have to be a one-off event. It can also be a series of intense traffic bursts that test your system’s recovery capabilities over and over again.
Endurance Testing
Next up is endurance testing, which you might also hear called soak testing. If spike testing is a sprint, endurance testing is a marathon. It asks a different but equally important question: “How does our application hold up when running under a sustained, heavy load for a very long time?”
An endurance test might run for hours or even days, applying a consistent, significant user load. Its purpose isn’t to find the breaking point but to uncover subtle issues that only appear over time.
These sneaky problems are often the toughest to debug in production. They include things like:
- Memory Leaks: A slow, steady drain on memory that eventually crashes the server.
- Database Connection Failures: Running out of available connections after hours of continuous operation.
- Performance Degradation: A gradual slowdown in response times as the system runs for an extended period.
Finding these issues in a controlled test environment saves you from slow-burning problems that could cause unexpected downtime down the road.
Scalability Testing
Finally, scalability testing is all about planning for the future. This type of test helps determine how well your application can grow. It answers the strategic question: “As our user base expands, can our system handle the increased load efficiently?”
Scalability testing measures how performance changes as you add more resources. For example, you might test whether doubling the CPU on your database server actually cuts query times in half. It helps you make smart, data-driven decisions about your infrastructure, ensuring you can grow your user base without degrading the user experience. This isn’t just about throwing more hardware at a problem; it’s about understanding how your software architecture truly supports growth.
Choosing the Right Performance Test Type
With several types of tests at your disposal, how do you pick the right one? This quick reference table can help you match the test to your goal.
| Test Type | Primary Goal | Example Scenario |
|---|---|---|
| Load Testing | Verify performance under expected, everyday traffic loads. | Checking if your e-commerce site can handle 1,000 concurrent shoppers on a typical Tuesday. |
| Stress Testing | Find the absolute breaking point of the system and see how it recovers. | Simulating a Black Friday rush to see when the payment gateway fails. |
| Spike Testing | Assess how the system handles sudden, massive surges in traffic. | A viral social media post drives 50,000 users to your site in under 5 minutes. |
| Endurance Testing | Uncover performance issues that only emerge over long periods. | Running a test for 48 hours to detect a slow memory leak in your application server. |
| Scalability Testing | Determine how well the application can grow with increased resources. | Testing if adding another web server node linearly improves response times. |
Each test provides a unique piece of the performance puzzle. By using them together, you get a complete picture of your system’s health, resilience, and readiness for whatever comes next.
Building Your Performance Testing Strategy
Knowing the different types of performance tests is one thing, but actually using them effectively is a whole different ball game. A smart testing strategy is what separates teams that are just running checks from those who are systematically making their application better. It turns testing into a cohesive plan for improving reliability and delighting your users.
The first step? You have to define the win. What does success actually look like for your application? Forget vague goals like making a “fast” website. Get specific. Set targets you can actually measure, like “page load times under two seconds for 95% of users” or “API response times below 200ms under a load of 1,000 requests per minute.”
With those goals in hand, you need to establish a performance baseline. This is just a snapshot of how your application performs right now, under its normal, everyday load. This baseline is your North Star. It’s the standard you’ll measure every future improvement or regression against. Without it, you’re just flying blind, completely unable to tell if that last code change made things better, worse, or did nothing at all.
Shifting Left for Proactive Quality
Performance testing used to be the final, terrifying hurdle before a release. This old way of doing things often led to last-minute panics and eye-wateringly expensive fixes. The modern, sane approach is to “shift left”—which just means you start performance testing much, much earlier in the development cycle.
The idea is simple: find and fix problems when they’re cheap and easy to address, which is usually right when the code is being written. This proactive mindset makes performance a shared responsibility, not just a task for the QA team to handle at the eleventh hour. When developers can run tests on their own machines, they get immediate feedback on the performance impact of their code.
Shifting left changes the culture from one of finding performance bugs to one of preventing them from ever being created. It builds quality directly into the product from day one.
This is where having the right tool becomes absolutely critical. A developer using GoReplay, for instance, can easily grab a slice of real production traffic and replay it against their local dev environment. Suddenly, they can run incredibly realistic, small-scale performance tests before their code is ever merged into the main branch.
This empowers them to answer critical questions right away:
- Did that last commit introduce a slow database query?
- How does this new feature handle a few dozen concurrent requests?
By giving developers the power to test with real-world scenarios, you eliminate the guesswork. They no longer have to depend on simplistic or artificial test scripts that miss all the weird edge cases. Instead, they can validate their changes against the messy, unpredictable reality of actual user behavior, making it far more likely that their code will perform beautifully in production. It makes robust performance an achievable, everyday practice rather than a frantic, pre-release scramble.
Finding and Fixing Common Performance Bottlenecks
 Running performance tests is just the beginning. The real value comes from playing detective with the results, digging deep to uncover why your application is slowing down. It’s not enough to know that response times are high; you need to find the root cause—the bottleneck—that’s holding your system back.
Think of bottlenecks as traffic jams inside your application. Your job is to pinpoint exactly where that congestion is happening so you can clear the road for your users.
This means translating raw test metrics into actionable insights. It’s a skill that requires looking past the surface-level numbers to understand the story they tell about your system’s behavior under pressure.
Identifying the Usual Suspects
Most performance issues boil down to a handful of common culprits. As you analyze your test data, keep an eye out for the tell-tale signs that point to one of these problem areas.
-
CPU Limitation: If your server’s CPU usage skyrockets to 90-100% during a load test while response times steadily climb, you’ve almost certainly found a CPU bottleneck. This means the server’s brain is simply overloaded and can’t process requests any faster.
-
Memory Leaks: Does your application’s memory usage creep up relentlessly during an endurance test, never returning to its baseline? That’s a classic sign of a memory leak. The app is grabbing memory it no longer needs and never letting go, eventually causing it to slow to a crawl or even crash.
-
Inefficient Database Queries: It’s a common scenario: high response times, but your application server’s CPU and memory look perfectly fine. This often points straight to a slow database. A single, poorly written query can force your entire application to wait, creating a massive bottleneck.
-
Network Issues: Sometimes, the problem isn’t your code at all. If you notice high latency between your application and an external service (like a payment gateway or a third-party API), the bottleneck is outside your walls. High latency with low server load is a strong indicator of a sluggish external dependency or network congestion.
Finding a bottleneck is like solving a puzzle. Each metric is a clue, and when you put them together, they lead you to the exact component that needs fixing, turning abstract data into real performance improvements.
Got Questions About Performance Testing?
We get it. When you first start diving into performance testing, a lot of practical questions come up. Here are some of the most common ones we hear from teams, with straightforward answers to help you build a smarter testing strategy.
How Often Should We Actually Run These Tests?
This is a big one. The best approach is to weave lightweight performance tests directly into your CI/CD pipeline. Think of it as a quick health check that runs with every significant code change. This helps you catch small regressions before they snowball.
Save the bigger, more intense stress or endurance tests for major milestones. Run them before a big release or right before you flip the switch on a major infrastructure change. The goal is to shift from one-off, pre-launch fire drills to a habit of continuous, proactive testing.
Performance Testing vs. Performance Engineering—What’s the Difference?
These two get mixed up all the time, but they’re fundamentally different mindsets.
- Performance Testing is the act of measuring your application. You’re running tests to find existing bottlenecks and see where it breaks under pressure.
- Performance Engineering is the culture of building performance into your system from day one. It’s about designing and coding in a way that prevents those problems from ever happening in the first place.
Put simply: testing finds the fires, while engineering fireproofs the building.
A scaled-down test environment is great for catching code-level bugs and logic flaws early on. But to truly know how your system will handle a real-world onslaught of traffic, your test environment needs to be a near-perfect mirror of production. Small-scale tests are a helpful piece of the puzzle, but they can’t replace full-scale validation.
Ready to stop guessing and start testing with traffic that’s actually real? GoReplay makes it simple to capture and replay your production traffic for incredibly realistic load, stress, and spike tests. Find out how you can build more resilient applications by visiting the official GoReplay website.