Why Software Problems Are Getting More Complex (And Harder to Fix)
Let’s be honest: that nagging feeling that software issues are getting trickier isn’t just in your head. The days of troubleshooting a single, self-contained application on a single server are fading fast. Today, we’re dealing with a fundamentally different beast. The nature of modern software architecture has introduced layers of complexity that make troubleshooting software problems a much bigger challenge than it was a decade ago. It’s no longer about a single piece of code malfunctioning; it’s about figuring out how dozens of interconnected services interact.
Think of it like this: fixing an old car might involve diagnosing a single part, like a bad carburetor. Fixing a modern electric vehicle, however, requires understanding a complex web of sensors, software, and batteries that all talk to each other. A problem in one area can create symptoms somewhere else entirely. This analogy is a perfect fit for the shift we’ve seen in software development.
The Rise of Distributed Architectures
The move toward microservices and cloud-native applications is a primary driver of this complexity. Instead of a monolithic application where all the code lives together, we now have distributed systems. These systems break down functions into small, independent services communicating over a network. While this is great for scalability and development speed, it opens up a new world of troubleshooting nightmares.
A seemingly simple bug can now cascade through multiple services, making the root cause incredibly difficult to find. You might see an error in the payment processing service, but the actual fault could be in the user authentication service that failed to pass the correct token. This ripple effect means traditional debugging methods, where you attach a debugger and step through code line-by-line, just don’t cut it anymore. You’re left trying to connect the dots across a dozen different log files and network traces.
The Pressure of Rapid Deployment
Another major factor is the breakneck speed of modern software delivery. With Continuous Integration and Continuous Deployment (CI/CD) pipelines, new code gets pushed to production multiple times a day. This rapid cycle is fantastic for shipping features quickly but leaves a much smaller window for catching subtle bugs.
Many developers are all too familiar with these scenarios:
- A memory leak that only shows up after running for several days under a specific load.
- A dependency conflict where a newly updated library clashes with another, but only in the production environment.
- Intermittent race conditions that happen once in every thousand requests, making them nearly impossible to reproduce in a controlled test environment.
These aren’t just hypotheticals; they are the everyday realities for teams building modern software. The growing reliance on these intricate systems has created a huge demand for better troubleshooting tools. In fact, enterprise software spending is projected to hit $1.25 trillion by 2025, a number that highlights how much companies are investing in managing this complexity. You can find more details about these software development statistics and what they mean for the industry. This massive investment points to a core challenge: as our systems grow, the tools and techniques for troubleshooting software problems must evolve right along with them.
Building Your Professional Diagnostic Arsenal
Effective troubleshooters aren’t born with a sixth sense for bugs; they’re equipped with the right tools and, more importantly, a systematic approach. When you’re facing a vague bug report, diving in without a plan is like trying to find a specific book in a library by randomly pulling volumes off shelves. Instead, a seasoned professional starts by building a strong diagnostic arsenal, knowing which tools to deploy for which scenario to avoid hours of pure guesswork.
The goal isn’t just to accumulate tools, but to develop a methodology. This means knowing how to gather the right information upfront. This initial data collection phase is crucial for efficiently troubleshooting software problems, as it prevents you from chasing symptoms instead of the root cause. A methodical approach can shrink troubleshooting time from days to a matter of hours, a reality many experienced developers can attest to.
The first step in any diagnostic process is to accurately identify the issue, which is often harder than it sounds.
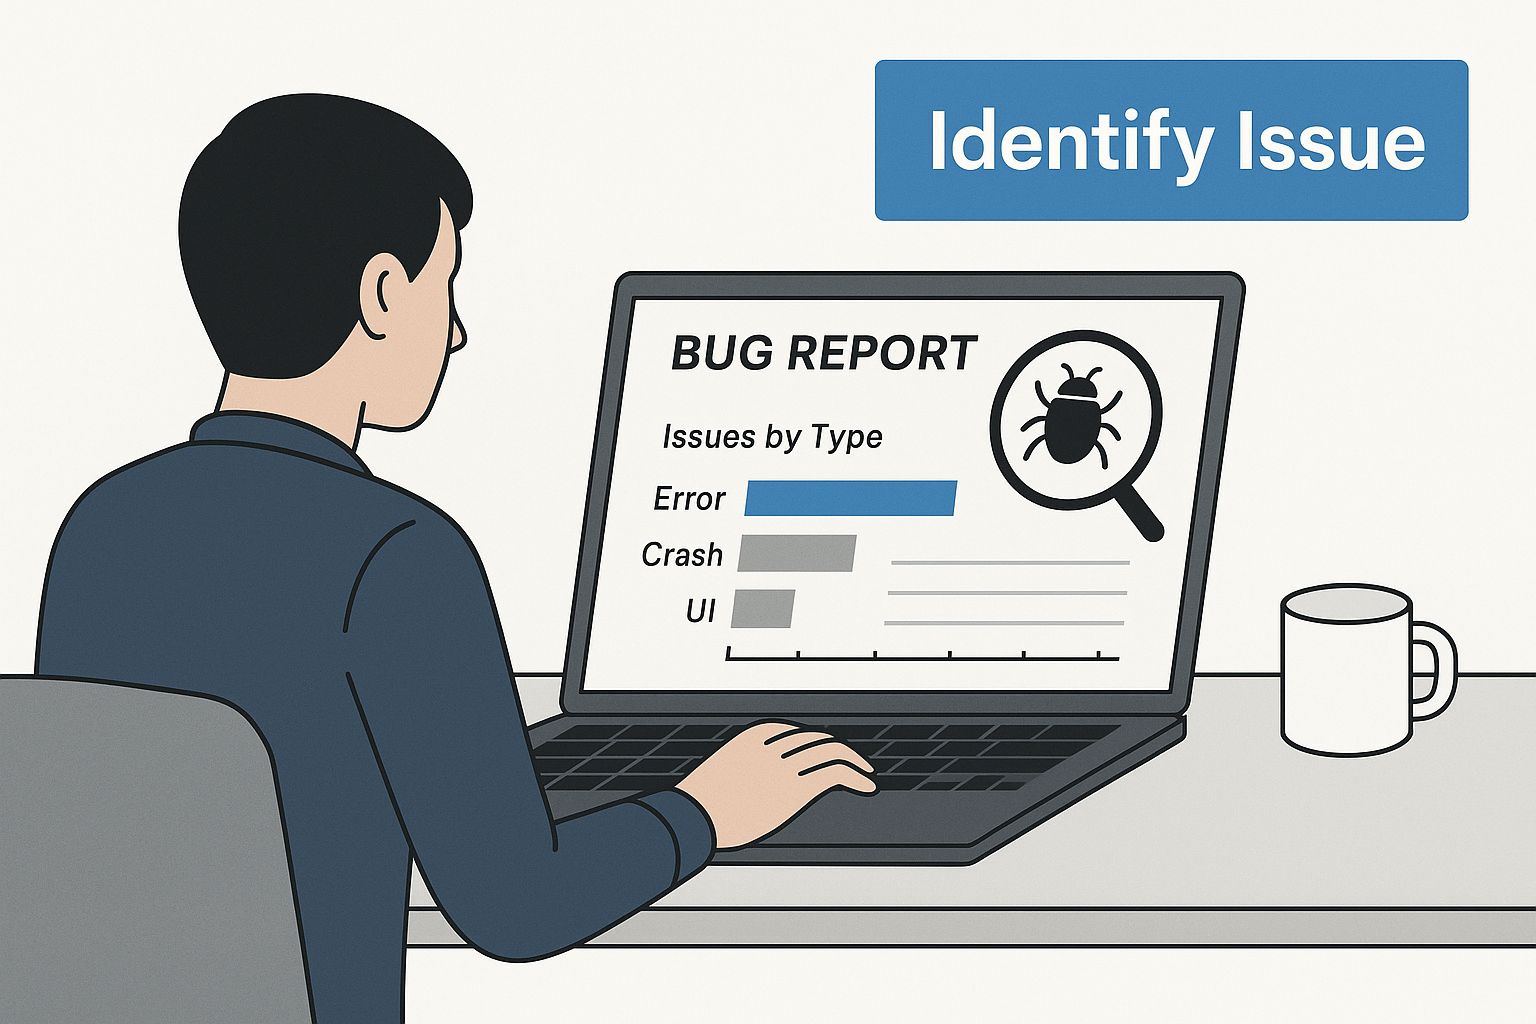
The image above shows the critical starting point: a developer methodically examining a bug report to truly understand the problem before taking action. This initial analysis phase is where many mistakes are made, especially under pressure, but getting it right lays the foundation for a swift resolution.
Essential Log Analysis and Monitoring
Your first line of defense is almost always the application’s logs. However, simply tailing a log file and waiting for an error to pop up is inefficient. Modern log analysis involves more structure. Tools that allow you to aggregate, search, and visualize log data from multiple sources are indispensable. They turn a chaotic stream of text into actionable insights, letting you correlate events across different services to pinpoint where things went wrong. For instance, an error in your API gateway might correspond to a timeout from a downstream database service, a connection that’s only obvious when you see the logs side-by-side.
Performance monitoring is the other side of this coin. While logs tell you what happened, performance metrics tell you how it happened. Monitoring tools provide a real-time view of your application’s health, tracking things like CPU usage, memory consumption, and request latency. A sudden spike in response time right after a new deployment is a classic sign of a performance regression. Having this data on hand turns “the app feels slow” into a concrete, measurable problem you can start to solve.
To help you choose the right tool for the job, here’s a quick comparison based on common problem scenarios you’ll likely face.
Essential Troubleshooting Tools by Problem Type
Comparison of diagnostic tools for different categories of software problems, including their strengths, use cases, and learning curve
| Problem Type | Primary Tools | Skill Level Required | Time to Resolution |
|---|---|---|---|
| Performance Bottlenecks | APM tools (Datadog, New Relic), Profilers | Intermediate to Advanced | Hours to Days |
| Logic Errors/Bugs | Debuggers (IDE-specific), GoReplay for traffic replay | Intermediate | Minutes to Hours |
| Intermittent Failures | Log Aggregators (Splunk, ELK Stack), GoReplay | Intermediate | Hours to Days |
| Configuration Issues | Diff tools, Infrastructure-as-Code (IaC) tools | Beginner to Intermediate | Minutes to Hours |
This table highlights how different problems call for different tools. Relying solely on one type, like only using logs for performance issues, can lead to slow and frustrating diagnostic cycles.
Common Pitfalls Even Experts Make
Even experienced developers can fall into common traps when they’re under pressure to fix a critical issue. One of the biggest mistakes is jumping to conclusions based on assumptions. You might see an error message and immediately suspect a recent code change, but the actual cause could be an expired SSL certificate or a misconfigured firewall rule that has nothing to do with your code.
Another frequent error is failing to properly isolate the problem. In complex systems, multiple factors can contribute to an issue. Without a controlled environment to test individual variables, you can spend days tweaking settings without ever finding the true culprit. This is where a robust testing process becomes invaluable. For a deeper dive into creating effective testing strategies, check out our guide on software testing best practices for modern quality assurance. Adopting these practices can dramatically improve your diagnostic process.
Ultimately, building your diagnostic arsenal is less about having the fanciest tools and more about cultivating a disciplined, evidence-based mindset. By combining powerful logging and monitoring with a methodical approach, you can systematically dismantle even the most confusing software problems.
Cracking the Code on Problem Reproduction and Smart Documentation
Every seasoned IT pro knows this truth: a bug you can’t reproduce is a bug you can’t fix. When you’re troubleshooting software problems, making an issue happen on demand is the single most important step. Without it, you’re just guessing. This skill is what separates effective troubleshooters from those who spend days chasing ghosts in the system. The real art is turning a chaotic, intermittent issue into a controlled, repeatable experiment.
This process kicks off the moment a bug report lands on your desk. Too often, these reports are vague pleas like, “The system is slow again” or “The export feature is broken.” Your job is to become part detective and guide the frustrated user toward providing the specific details you need. This isn’t about blaming them; it’s about working together. Ask targeted questions that help them retrace their steps.
From Vague Reports to Actionable Test Cases
The goal is to transform that vague complaint into a precise recipe for replication. A great test case doesn’t just describe the problem; it gives you a script to make it appear on command.
Here’s how you can gather the necessary details:
- Exact Sequence of Events: What was the very last thing they clicked before the error? What five steps came right before that?
- Specific Data Inputs: What search term did they use? What file type were they trying to upload?
- Environmental Factors: Which web browser and version are they on? Are they connected to the corporate network or a public Wi-Fi?
- Time and Frequency: Does this happen every single time, or only at certain times of the day, like during peak business hours?
This information helps you start isolating variables. For instance, if an issue only happens on a specific browser version, you’ve already narrowed your search considerably. If it only happens under heavy load, it points toward a performance bottleneck, not a simple logic error.
The Challenge of Production-Only Bugs
Of course, the most frustrating problems are those that refuse to show up in a clean test environment. They only appear in the wild, under the complex conditions of your live production system. This is where tools that capture and replay real user traffic, like GoReplay, become essential. By shadowing production traffic, you can safely replay real-world scenarios in a staging environment until the bug finally reveals itself. This approach closes the gap between the cleanroom of testing and the messy reality of production.
This ability to simulate real-world conditions is more critical than ever. The growing importance of IT security and artificial intelligence (AI) is adding new layers of complexity to software. In fact, research shows that by 2025, over 30% of global software buyers are expected to prioritize IT security and AI features. This trend highlights a future where troubleshooting software problems will increasingly involve complex, AI-driven components that are difficult to replicate by hand. You can read the full analysis on global software buyer priorities to understand this shift better.
Documentation That Actually Helps
Finally, once you’ve cracked the case and fixed the bug, don’t let that hard-won knowledge disappear. The last piece of the puzzle is smart documentation. This isn’t about writing a novel; it’s about creating a concise, searchable record for your future self and your teammates.
A useful bug resolution document should always include:
- A Clear Summary of the Problem: What were the user-facing symptoms?
- The Root Cause Analysis: What was the technical reason for the failure?
- The Exact Steps to Reproduce: This is your “recipe” for the bug.
- The Solution Implemented: What code was changed or what configuration was updated?
This repository of knowledge turns every solved problem into an asset, helping your team resolve similar issues much faster in the future. It’s the final step in transforming a one-time firefighting effort into a long-term improvement in your system’s reliability.
Solving the Problems That Show Up Everywhere
Some software issues are just universal. They pop up again and again, no matter the system or environment, becoming the familiar headaches every IT pro knows. When you’re troubleshooting software problems, recognizing these recurring patterns is more than half the battle. From applications that won’t launch to performance that mysteriously slows down, these problems require both a quick fix to get things running and a deeper solution to keep them from returning.
The real challenge is balancing the immediate need for a fix with the long-term goal of stability. Sure, a quick restart can get a crashed service back online, but it won’t address the underlying memory leak that caused the failure. Slapping on a temporary patch without finding the root cause is like putting a bucket under a leaky pipe—it catches the drips for now, but the pipe is still broken. Knowing when a “band-aid” is just creating technical debt is a vital skill.
Startup Failures and Performance Degradation
One of the most common issues is the dreaded startup failure. An application that ran smoothly yesterday suddenly refuses to launch today. This is often an environmental problem: a dependency is missing or was updated, a setting is misconfigured, or a permissions change is blocking access to a critical file. A real-world example I’ve seen is a server app failing to start after a system-wide security patch. The patch tightened file permissions, and the app could no longer read its own configuration file. The immediate fix was adjusting permissions, but the permanent solution was updating the deployment script to handle these stricter security policies from the start.
Performance degradation is another ghost in the machine. This is where an application gets progressively slower over days or weeks, often ending in a crash. Memory leaks are a classic culprit, where the app eats up memory without releasing it until system resources are exhausted. Another is database connection pool exhaustion, where a burst of activity uses up all available connections. Restarting the application gives you a temporary break, but the real work lies in finding the source of the leak or figuring out why connections aren’t closing. This is where a tool like GoReplay becomes essential, allowing you to replay production traffic to recreate the exact load that triggers the problem in a safe environment.
The Headaches of Incompatibility and Data Corruption
Compatibility issues are a constant source of frustration in modern interconnected systems. An update to one component—an OS, a browser, or a third-party library—can easily break another. For instance, a web app might suddenly look broken for users after a new browser version deprecates an old JavaScript function. A quick fix might be to roll back the browser, but that isn’t a scalable solution. The permanent fix is to update the application’s code to align with current standards.
Data corruption is probably the most alarming of these common problems. It can be sneaky, silently altering data until the damage is widespread. This could be due to a bug in the application logic, a hardware failure, or even a race condition where two processes try to write to the same file at once. The first priority is to restore from a clean backup and stop whatever is causing the corruption. The long-term solution involves careful code reviews, implementing transactional integrity checks, and improving data validation to catch bad data before it’s ever written.
To help you navigate these issues, here’s a quick-reference table that breaks down these common problems and how to approach them.
Common Software Problems and Quick Resolution Strategies
Overview of frequent software issues with estimated resolution times and recommended approaches for different scenarios
| Problem Category | Symptoms | Quick Fix | Permanent Solution | Prevention Strategy |
|---|---|---|---|---|
| Startup Failure | Service won’t launch, errors on start | Revert recent changes; check permissions | Fix configuration; update dependencies | Automated pre-deployment checks |
| Performance Degradation | Slow response times, high resource use | Restart application or service | Identify and fix memory/resource leaks | Regular performance testing and monitoring |
| Compatibility Issues | Features break after an update | Roll back the problematic update (if possible) | Update code to support new versions | Proactive testing against beta releases |
| Data Corruption | Incorrect or garbled data appears | Restore from a clean backup; halt writes | Implement data validation and integrity checks | Robust backup and recovery plan |
This table shows that every quick fix has a more robust, permanent counterpart. The key takeaway is that effective problem-solving requires this dual approach.
Ultimately, mastering the art of troubleshooting software problems means getting good at recognizing these recurring themes. By understanding their common causes and learning to apply both immediate fixes and lasting solutions, you can shift from constantly fighting fires to building more resilient and dependable systems.
Advanced Troubleshooting for Modern Distributed Systems
The old playbook for troubleshooting monolithic applications just doesn’t work for today’s software. We operate in a world of microservices, cloud dependencies, and containerized setups, where the root cause of a problem and its symptoms can be separated by multiple network hops and abstract layers. To effectively troubleshoot software problems here, we need a new approach and better tools, moving beyond debugging one app to diagnosing a whole interconnected system.
This isn’t just a technical challenge; it’s a symptom of a booming industry. The global market for application development software is set to grow at a 22.8% CAGR from 2025, reaching an estimated $195.77 billion by year’s end. This rapid growth means more services, more integrations, and more potential points of failure, making advanced troubleshooting a non-negotiable skill. You can explore more about these software development trends to see the market forces shaping our daily work as developers and DevOps professionals.
Debugging Across Interconnected Systems
When an issue ripples through multiple microservices, old-school debugging feels like trying to solve a puzzle with half the pieces missing. You might spot a timeout error in your front-end service, but the real culprit could be a sluggish database query in a downstream data service, triggered by a malformed request from an authentication service. The trick is to follow the path of a single request across every system it touches.
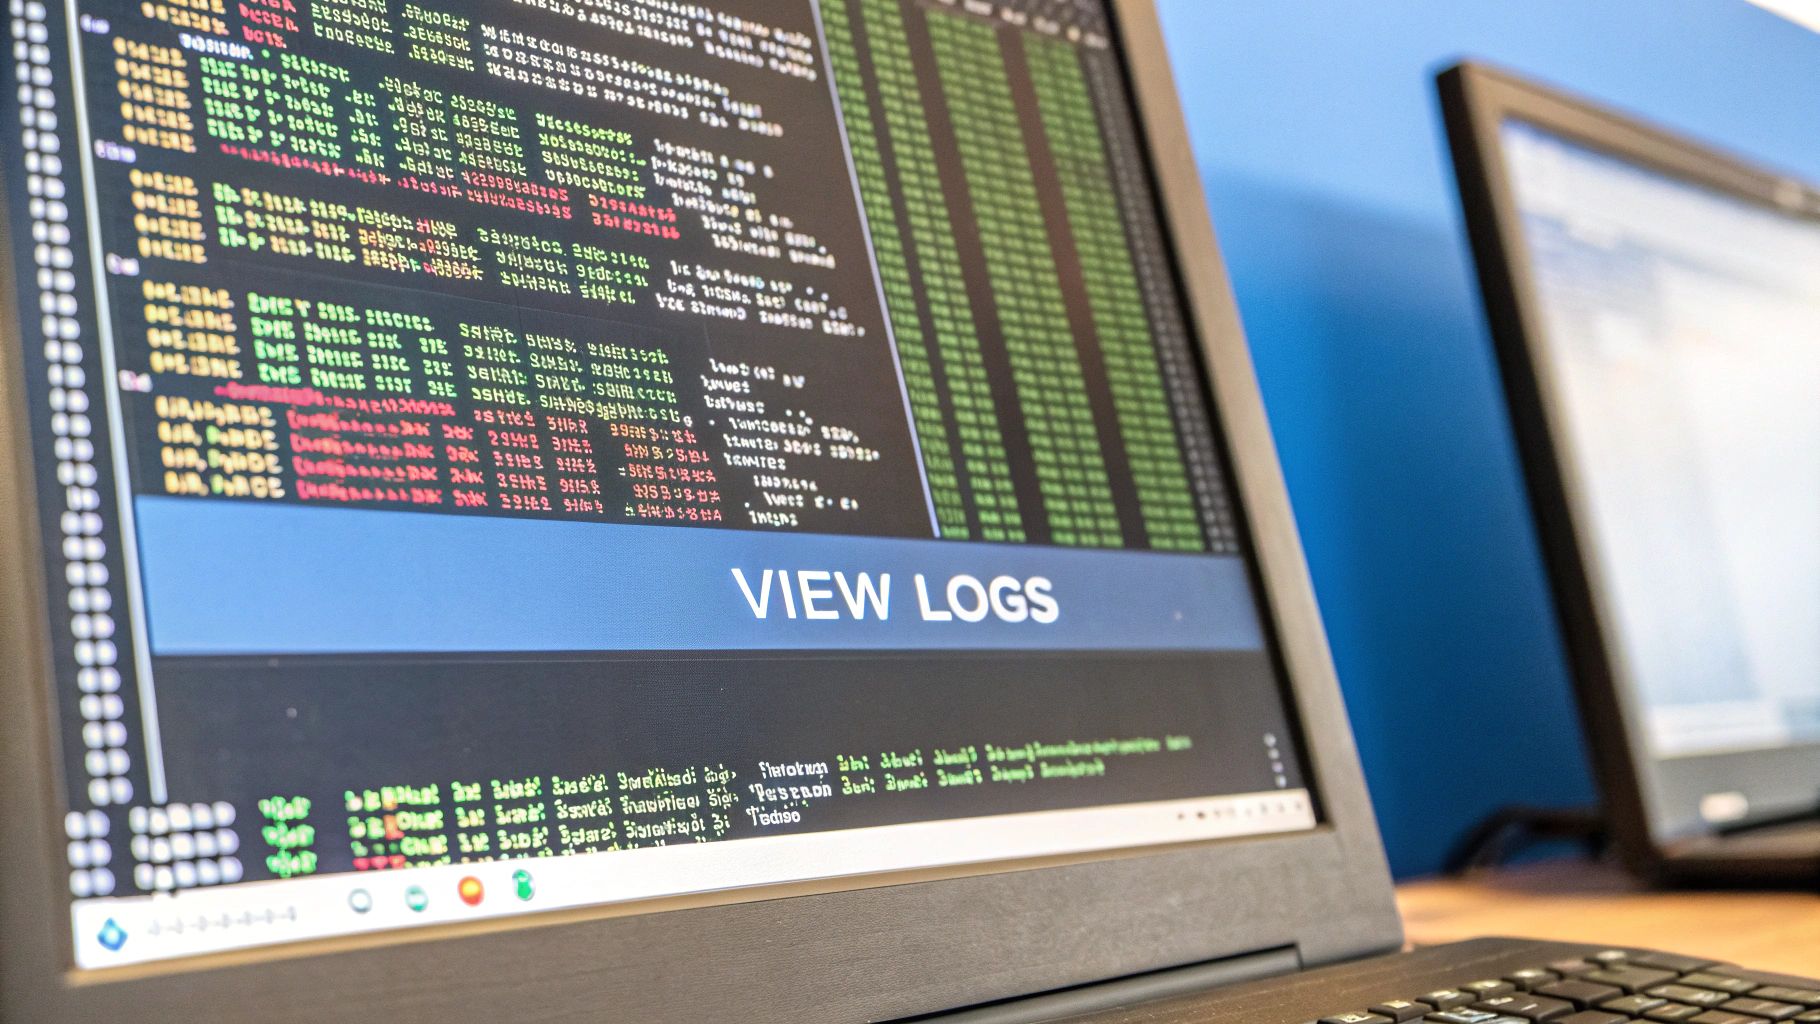
This is where traffic shadowing becomes a game-changer. By capturing and replaying production traffic, you can recreate the exact sequence of events that triggers a failure, but in a safe staging environment. Here’s a glimpse of how GoReplay listens to network traffic to make this kind of deep analysis possible.
The image shows GoReplay capturing HTTP traffic from a specific port, which is the first step in replaying real-world scenarios. This technique lets you simulate the chaotic, unpredictable nature of production traffic to reliably reproduce those tricky, intermittent bugs that never seem to appear during standard testing.
Handling Uncontrollable Third-Party Dependencies
Modern apps lean heavily on external APIs for everything from payment processing to user authentication. But what do you do when one of those services slows down or goes offline? You can’t just attach a debugger to an external API you don’t control. Your troubleshooting has to focus on what you can manage: how your application interacts with that service.
Here are a few practical ways to manage these external dependencies:
- Implement Circuit Breakers: A circuit breaker automatically stops your app from hammering a failing service. This simple pattern prevents one broken dependency from crashing your entire system.
- Use Intelligent Timeouts and Retries: Don’t let your application hang while waiting for a slow API. Set smart timeouts and use a retry strategy with exponential backoff to handle temporary network glitches without overwhelming the service.
- Mock External Services During Testing: In your test environment, use mock services that mimic the behavior of third-party APIs. This allows you to test how your application responds to various scenarios, like errors and delays, without making real calls to the external service.
Building this kind of resilience at the edges of your system helps insulate your application from problems that are completely out of your hands. Our comprehensive guide to load testing software is also a great resource, as it dives into how you can test your system’s ability to handle these pressures at scale.
Prevention Strategies That Actually Work in the Real World

The most effective way of troubleshooting software problems is to prevent them from ever occurring. While this might sound a bit idealistic, solid prevention strategies are more achievable than many teams realize. This isn’t about creating a perfect, bug-free system, but about cutting down the number and impact of issues, saving your team from late-night emergencies and stressful debugging sessions. The key is to foster a proactive culture where identifying potential problems is just part of the daily routine.
This mindset starts with a simple shift in how we approach code. It means moving past just making things work and starting to ask, “How could this break?” This single question is the foundation of any strong prevention effort.
Building Resilience from the Code Up
Often, the most powerful preventative measures are simple habits that become part of your team’s DNA. These don’t need huge budgets or specialized teams, just a shared commitment to quality.
- Meaningful Code Reviews: This is more than a quick scan for typos. A great code review is a collaborative deep dive. Does the code handle edge cases? What if an API call fails or sends back junk data? It’s an opportunity for a fresh pair of eyes to spot flawed logic or performance bottlenecks the original author might have overlooked.
- Automated Testing Pipelines: Think of a solid testing pipeline as your first line of defense. Unit tests verify individual pieces, while integration tests make sure they all play nicely together. This safety net catches regressions automatically before they ever see the light of day in production, giving you the confidence to deploy changes without fear.
- Design for Graceful Failure: Every system has its limits, and failures are inevitable. The goal is to build applications that can handle these moments gracefully. Instead of crashing, maybe a service that loses its database connection can switch to a read-only mode, fire off an alert, and serve cached data. Building systems that fail predictably turns a potential catastrophe into a manageable incident.
The Power of Proactive Monitoring and Maintenance
Once your code is live, prevention shifts to active observation and upkeep. Outdated software, for instance, is a massive and often overlooked risk. We’ve seen that organizations with a poor patching schedule are more than seven times more likely to be hit by a ransomware event. Regular maintenance is about both security and stability.
A strong prevention plan should include these practices:
- System Monitoring: Go beyond simple “is it up?” checks. Keep an eye on key application metrics like response times, error rates, and resource usage. Set up alerts for anomalies—a sudden jump in errors or a slow climb in memory consumption is a clear warning sign, letting you investigate before users even notice.
- Regular Patching: Keep everything updated, from the operating system to third-party libraries. Known vulnerabilities in old software are a welcome mat for attackers. The Log4j vulnerability was a painful reminder of this, with one federal department reporting it spent 33,000 hours on response efforts. A consistent patching schedule shuts these doors.
- Balancing Speed and Safety: The point isn’t to slow down development with red tape. It’s about finding a practical balance. Using tools like GoReplay lets you run realistic tests with actual production traffic. This ensures your preventative measures are validated against real-world conditions, not just theories. This approach connects development speed with genuine confidence in your system’s stability, making troubleshooting software problems a far less common task.
Key Takeaways
Getting good at troubleshooting software problems is a journey, not a destination. It’s about building a systematic mindset instead of just memorizing a few commands. I’ve found that effective troubleshooting really comes down to a few core principles, whether you’re tackling a minor bug or a full-blown system outage. The most important thing is to resist the urge to jump to conclusions and instead focus on methodically reproducing the problem. If you can’t make the issue happen on demand, you’re just flying blind.
Your Troubleshooting Checklist
Here’s a practical roadmap I use to guide my efforts:
- Reproduce Before You React: My first step is always to turn vague user reports into precise, repeatable test cases. By isolating variables, I can pinpoint the exact conditions that trigger the failure.
- Leverage the Right Tools: You wouldn’t use a hammer for a screw. I rely on log aggregators for those tricky intermittent issues, performance monitors for slowdowns, and traffic replay tools like GoReplay for bugs that only seem to pop up in production.
- Document Your Victories: Your future self will thank you for this. A clear summary of the problem, what caused it, and how you fixed it turns every incident into a valuable lesson for the whole team.
Prioritize and Improve
I recommend focusing on building your skills in this order:
- Systematic Diagnosis: Learn to gather concrete evidence before you even start forming a hypothesis.
- Tool Proficiency: Become an expert with your core diagnostic tools. Knowing their ins and outs saves a ton of time.
- Preventative Thinking: The ultimate goal is to shift from just fixing things that break to building more resilient systems from the start.
In the end, the best troubleshooters are proactive. They build systems designed to fail gracefully and put preventative measures in place, like automated testing and solid monitoring. By adopting these strategies, you’ll find yourself spending less time fighting fires and more time building reliable, stable software.
Ready to eliminate bugs before they impact your users? Discover how GoReplay can transform your testing process by replaying real production traffic.