Understanding Transactions Per Second
At its core, transactions per second (TPS) is the heartbeat of your system. It measures how many complete, meaningful operations your application can successfully pull off in a single second. It’s not just about raw speed—it’s the truest indicator of your system’s capacity to serve users when things get busy.
What Transactions Per Second Really Means
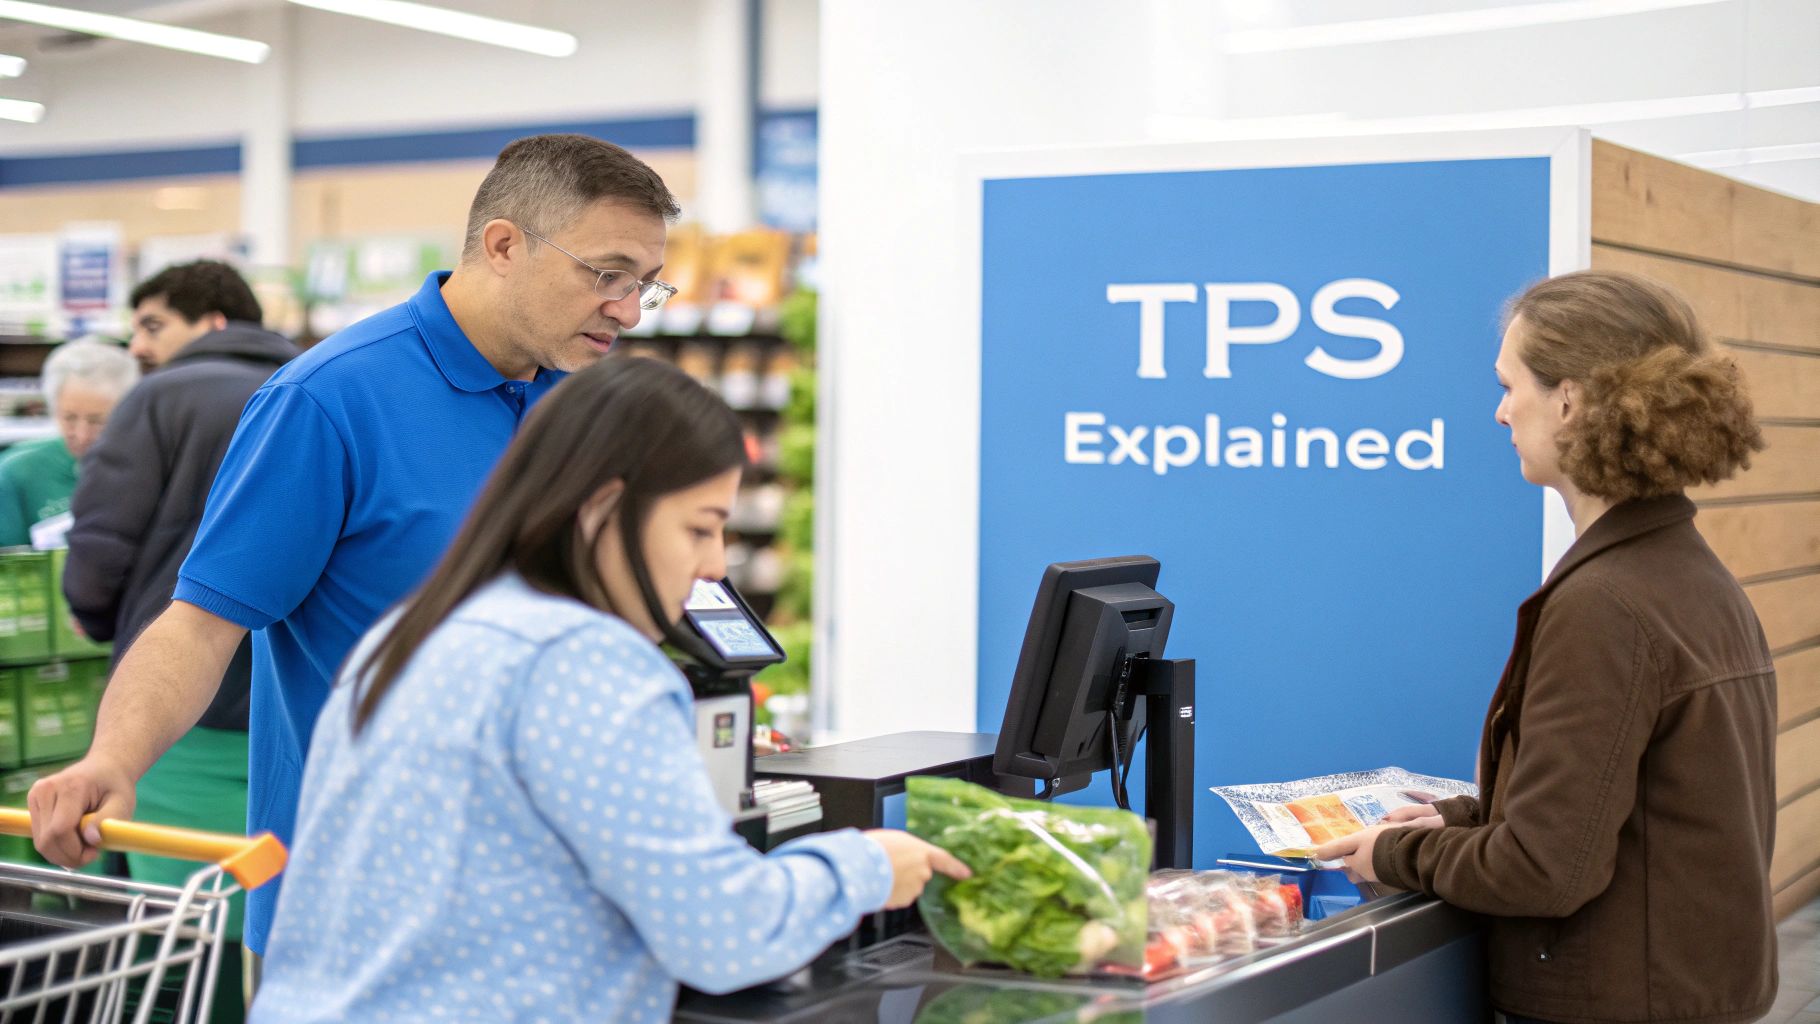
Think of your application as a supermarket checkout lane. The number of customers who successfully pay for their items and leave the store each second? That’s your transactions per second. This one number gives you a clear picture of your entire operation’s output, from scanning items to the final payment confirmation.
The power of TPS lies in measuring a complete business action. A “transaction” isn’t just a single, simple request. It’s the entire sequence of steps that actually delivers value to the user.
For example, a single transaction could be:
- E-commerce: An entire “add to cart” workflow, which might involve multiple database reads, an inventory check, and updating the user’s session.
- Financial Services: A payment process that includes authorizing the transaction, transferring the funds, and sending back a confirmation.
- Social Media: Posting a comment, which could trigger text validation, database writes, and updates to multiple user feeds.
By focusing on the full business workflow, TPS gives you a much more realistic view of your system’s performance than other, more superficial metrics.
Beyond the Buzzwords: TPS vs. RPS and Latency
To really get a handle on performance, you have to understand how TPS differs from other common terms. People often throw them around interchangeably, but they measure completely different things. Confusing them can lead to flawed tests and misguided optimization efforts.
Take Requests Per Second (RPS), for example. It just counts how many individual HTTP requests hit your server. In our supermarket analogy, RPS is like counting the items scanned at the checkout, but it doesn’t tell you how many customers actually finished their shopping. A single transaction often fires off multiple requests.
Key Insight: A high RPS with a low TPS is a major red flag. It’s a classic sign that your system is busy spinning its wheels on individual requests but failing to complete meaningful user actions, likely due to bottlenecks in a database or a slow third-party API.
Then there’s latency, which measures the time it takes for a single request to get a response. Low latency is great for user experience, but it says nothing about how many users your system can handle at once. You might have lightning-fast responses for one user, only to watch the whole system grind to a halt under a real-world load.
The table below breaks down these key distinctions to help you choose the right metric for the job.
Key Performance Metrics at a Glance
This quick comparison highlights the distinct roles of Transactions Per Second (TPS) and other common performance metrics, clarifying what each one actually tells you.
| Metric | What It Measures | Analogy | Primary Use Case |
|---|---|---|---|
| Transactions Per Second (TPS) | The number of completed business operations per second. | How many customers successfully check out from a store per second. | Measuring overall system capacity and business throughput. |
| Requests Per Second (RPS) | The number of individual network requests handled per second. | How many items are scanned by the cashier per second. | Assessing raw server load and network-level performance. |
| Latency | The time it takes for one request to get a response. | How long one customer waits in line at the checkout. | Evaluating individual user experience and response speed. |
Ultimately, while metrics like RPS and latency are useful for diagnostics, TPS is the one that truly connects performance to business outcomes and user success.
Why TPS Is More Than Just a Number
Transactions per second might sound like a dry, technical metric that only engineers care about, but its impact is felt in every corner of a business. It’s not just a measure of system speed—it’s a direct reflection of your ability to deliver a solid user experience, capture revenue, and stay ahead of the competition.
Think of it this way: a high TPS is the bedrock of user trust. When a system performs flawlessly under pressure, people feel confident. When it stumbles, that trust disappears in an instant, and getting it back is nearly impossible. That’s why optimizing for a healthy number of transactions per second is a strategic business goal, not just an IT chore.
The Financial Lifeline
In the world of finance, TPS is the digital heartbeat that keeps global commerce alive. Payment networks are the definition of a high-stakes environment where even a tiny slowdown can trigger massive financial fallout. Every swipe, tap, or click kicks off a transaction that has to be processed securely and instantly.
The sheer scale of this is mind-boggling. The global credit card industry handles billions of transactions every single day, averaging out to 25,091 transactions per second. In the United States alone, the average is a steady 1,781 transactions per second. This gives you a sense of the immense, non-stop demand these systems are under. If you want to dive deeper, you can explore more credit card transaction statistics to see the full picture.
For giants like Visa and Mastercard, which can handle peaks of over 65,000 TPS, this kind of capacity isn’t a nice-to-have. It’s a fundamental requirement for the modern economy to even function.
E-commerce and Peak Performance
Nowhere is the impact of TPS more obvious than in e-commerce, especially during a major sales event. For any online retailer, Black Friday isn’t just a big day for sales; it’s the ultimate stress test. The ability to handle a sudden, massive spike in transactions is what separates a record-breaking day from a complete catastrophe.
Just imagine thousands of customers hitting “buy now” at the exact same time. A system with a weak TPS will absolutely buckle, leading to chaos:
- Shopping cart errors: Frustrated shoppers find their carts empty or discover they can’t even complete a purchase.
- Payment failures: Transactions time out, leaving customers wondering if their order actually went through.
- Website crashes: The entire site goes down, locking out every single potential buyer.
Every one of these failures means lost revenue and angry customers heading straight to your competitors. A high TPS ensures that when it matters most, your digital doors stay open, responsive, and ready to turn visitors into happy customers.
The Blockchain Scalability Challenge
Over in the world of blockchain and crypto, TPS is one of the most important metrics for a network’s real-world usefulness and potential for adoption. The early networks were painfully slow, only able to manage a few transactions per second. This was a massive roadblock that kept them from being used for much beyond simple token transfers.
Today’s blockchain projects are in a constant race to crank up their TPS. Higher throughput is critical for supporting complex applications like decentralized finance (DeFi), gaming, and real-time digital marketplaces. A network that can process thousands of transactions per second is seen as more scalable and legitimate, which in turn attracts developers, users, and investment.
At the end of the day, whether you’re in finance, retail, or an emerging tech space, TPS is so much more than a technical benchmark. It’s a critical measure of a system’s ability to meet real-world demands, drive revenue, and thrive.
How to Measure TPS the Right Way
Knowing what transactions per second means is one thing, but actually measuring it reliably is a whole different ballgame. You can’t just run a quick script and call it a day. To move from guesswork to genuine performance improvements, you need a structured approach that shows how your system behaves under real pressure.
Different performance tests are designed to answer different questions about your system’s capabilities. Each one pushes your application in a unique way, revealing its strengths and weaknesses under various conditions. Figuring out which test to use is the first step toward getting data you can actually trust.
Choosing the Right Performance Test
To get a complete picture of your system’s health, you really need to use a few different testing strategies. The three heavy hitters are load, stress, and soak testing, and each one tells you something unique.
- Load Testing: This is your baseline. Think of it as simulating a typical Tuesday afternoon. You’re just confirming your system can handle normal, everyday traffic without breaking a sweat. The goal here is simply to verify that performance meets expectations under a standard workload.
- Stress Testing: Now it’s time to push things. You intentionally overload the system to find its breaking point. It’s the only way to find out the absolute maximum TPS your application can sustain before it gives up. It also tells you a lot about how gracefully (or not) it recovers.
- Soak Testing (Endurance Testing): This one is a marathon, not a sprint. You run a normal load but for a very long time—we’re talking hours, sometimes even days. This is how you uncover those sneaky problems like memory leaks or slow performance degradation that only show up after the system has been running for a while.
When you combine what you learn from these tests, you start to build a real, comprehensive understanding of your system’s true capacity. If you want to go deeper on this, we’ve got a comprehensive guide on how to check throughput that explores these methods in more detail.
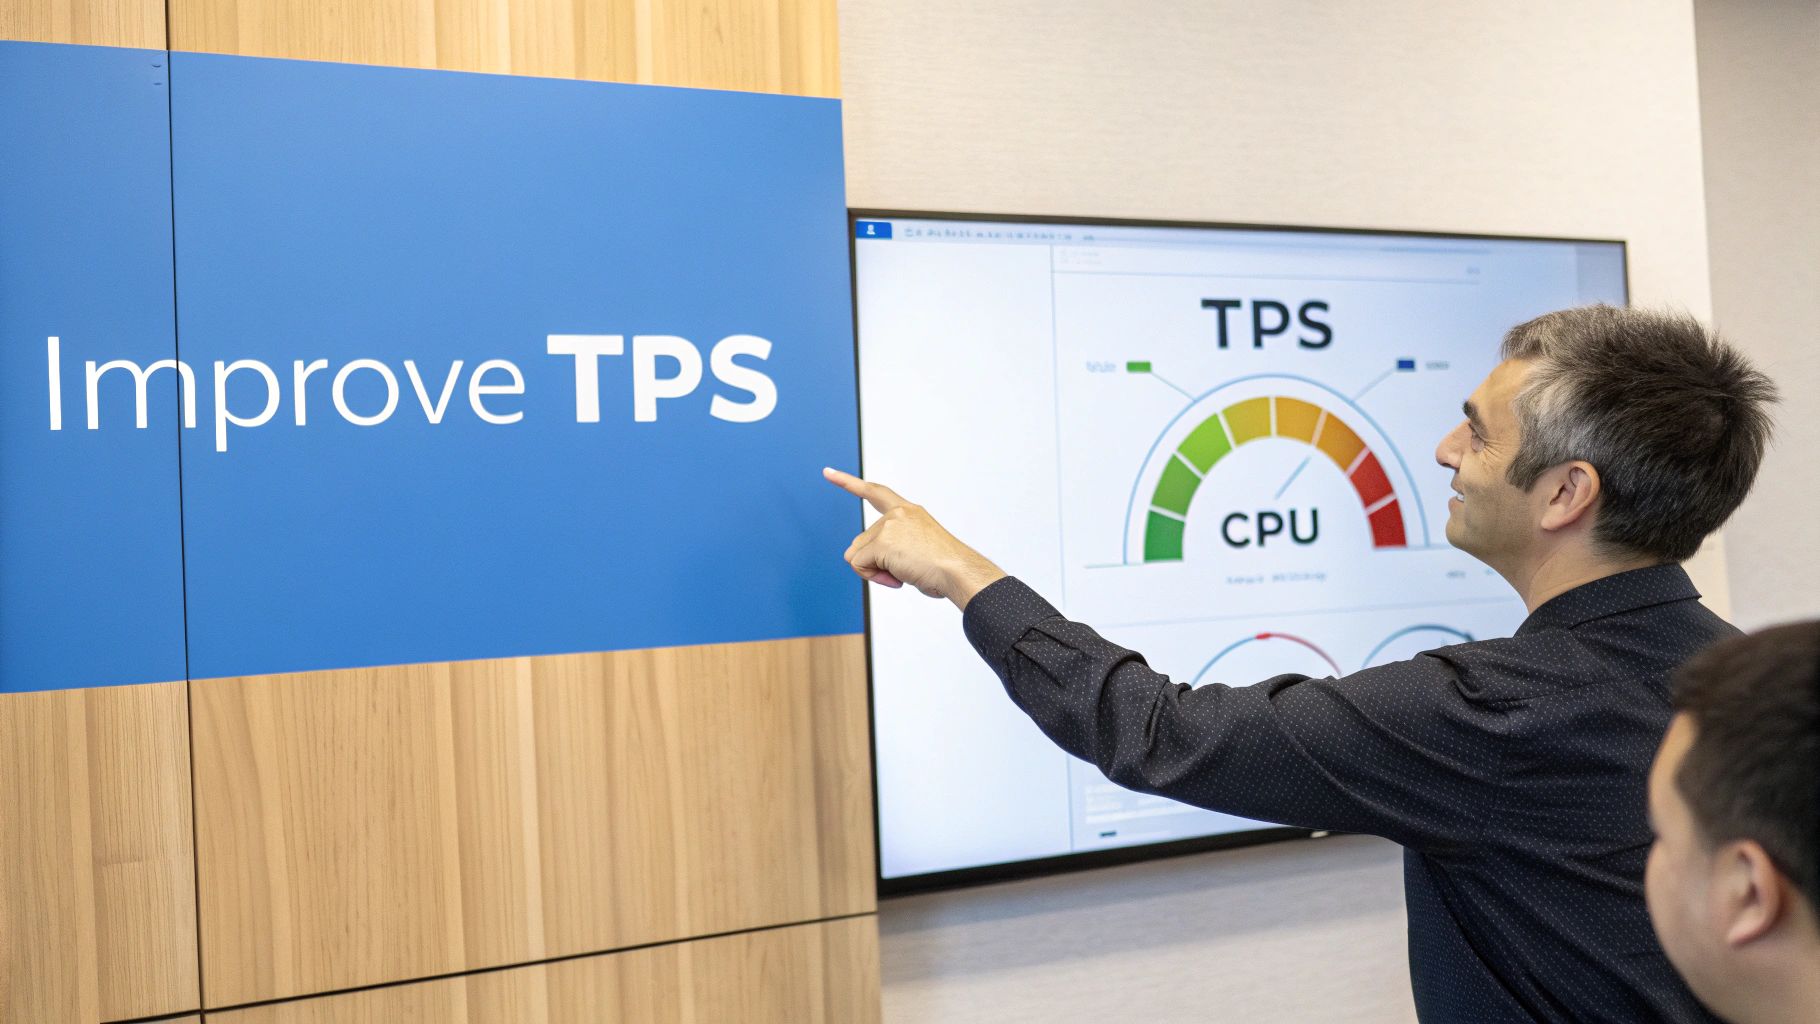
The infographic below shows exactly why this matters. A higher TPS isn’t just a technical achievement; it directly impacts your business by improving the user experience and, ultimately, driving more revenue.
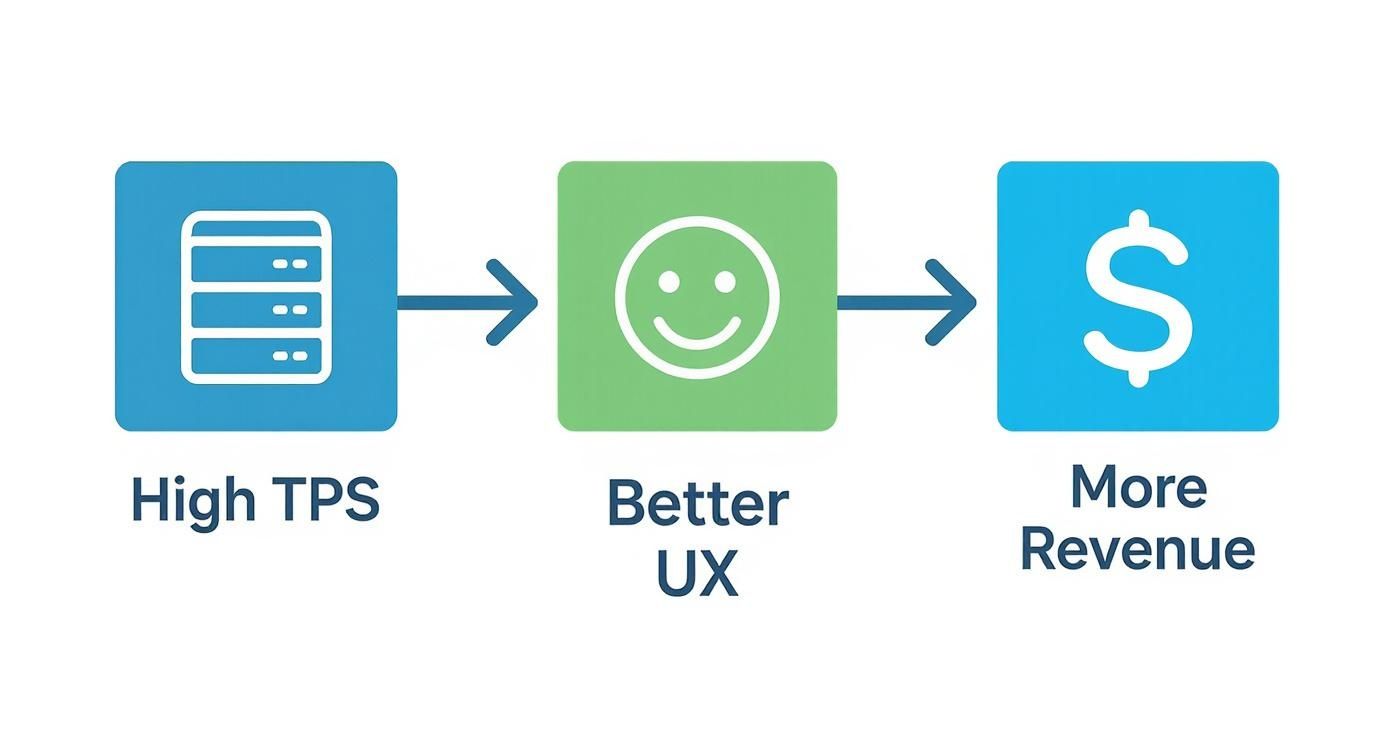
It’s a simple flow: a system that can handle more transactions per second feels faster and smoother to users. That good experience is what leads to better business outcomes.
Common Mistakes That Invalidate Your Results
Anyone can run a performance test. Running a meaningful one is much harder. I’ve seen countless teams fall into the same traps, ending up with misleading TPS numbers that create a false sense of security.
A high TPS number from a flawed test might look great in a report, but it won’t stop your system from crashing the moment real users show up. Vanity metrics are dangerous.
Make sure you sidestep these critical mistakes to get data you can actually act on:
- Ignoring Network Latency: Testing on a local machine where latency is practically zero is a classic blunder. Your users are connecting over real-world networks with all sorts of delays. That latency has a huge impact on transaction times and what your true throughput will be.
- Using Unrealistic Synthetic Data: Simple, repetitive API calls don’t even come close to mimicking the chaotic, unpredictable nature of real users. People hesitate, click around, and follow complex paths that your neat little script completely ignores.
- Testing in a Mismatched Environment: This one seems obvious, but it happens all the time. Your test environment needs to be a near-perfect clone of production—same hardware, same software versions, same network setup. A test on a developer’s laptop tells you absolutely nothing about how the system will perform live.
- Forgetting About Caching: A “cold” system with empty caches performs drastically differently than one that’s been running for hours and is fully “warmed up.” Your tests have to account for this, otherwise your performance baseline will be completely skewed.
By avoiding these pitfalls, you can be confident that the transactions per second you measure is a true reflection of your system’s capacity to serve your customers when it counts.
Simulating Realistic Traffic with GoReplay
Measuring transactions per second with synthetic scripts is a bit like testing a race car on a perfectly straight, empty track. The numbers look great, but they tell you nothing about how it handles a real-world circuit with hairpin turns, potholes, and other drivers.
Real users are chaotic. They abandon carts, hammer the refresh button, and follow bizarre, unpredictable paths that no simple load test could ever dream of replicating. So, how do you test for this messy reality without putting your production environment at risk?
This is where traffic shadowing flips the script. Instead of inventing fake traffic, you capture a live copy of your production traffic and “replay” it against a staging or test environment. It’s the highest-fidelity load test possible, showing you how your system actually holds up under the pressure of real human behavior.
Introducing GoReplay for High-Fidelity Testing
GoReplay is a powerful open-source tool built from the ground up for traffic shadowing. Think of it as a network listener that silently records HTTP traffic from your live server and forwards it to a test system. Because it operates at the network level, it doesn’t require a single change to your application code.
This approach is fundamentally better than old-school load generation for a few key reasons:
- Authentic User Behavior: It replays the exact sequence of requests from real users, complete with all their quirks and illogical patterns.
- Real-World Data: The test uses actual data payloads from production, which often uncovers bugs that clean, synthetic data would completely miss.
- Production-Safe: It shadows traffic without impacting your live application’s performance, so you can test continuously and safely.
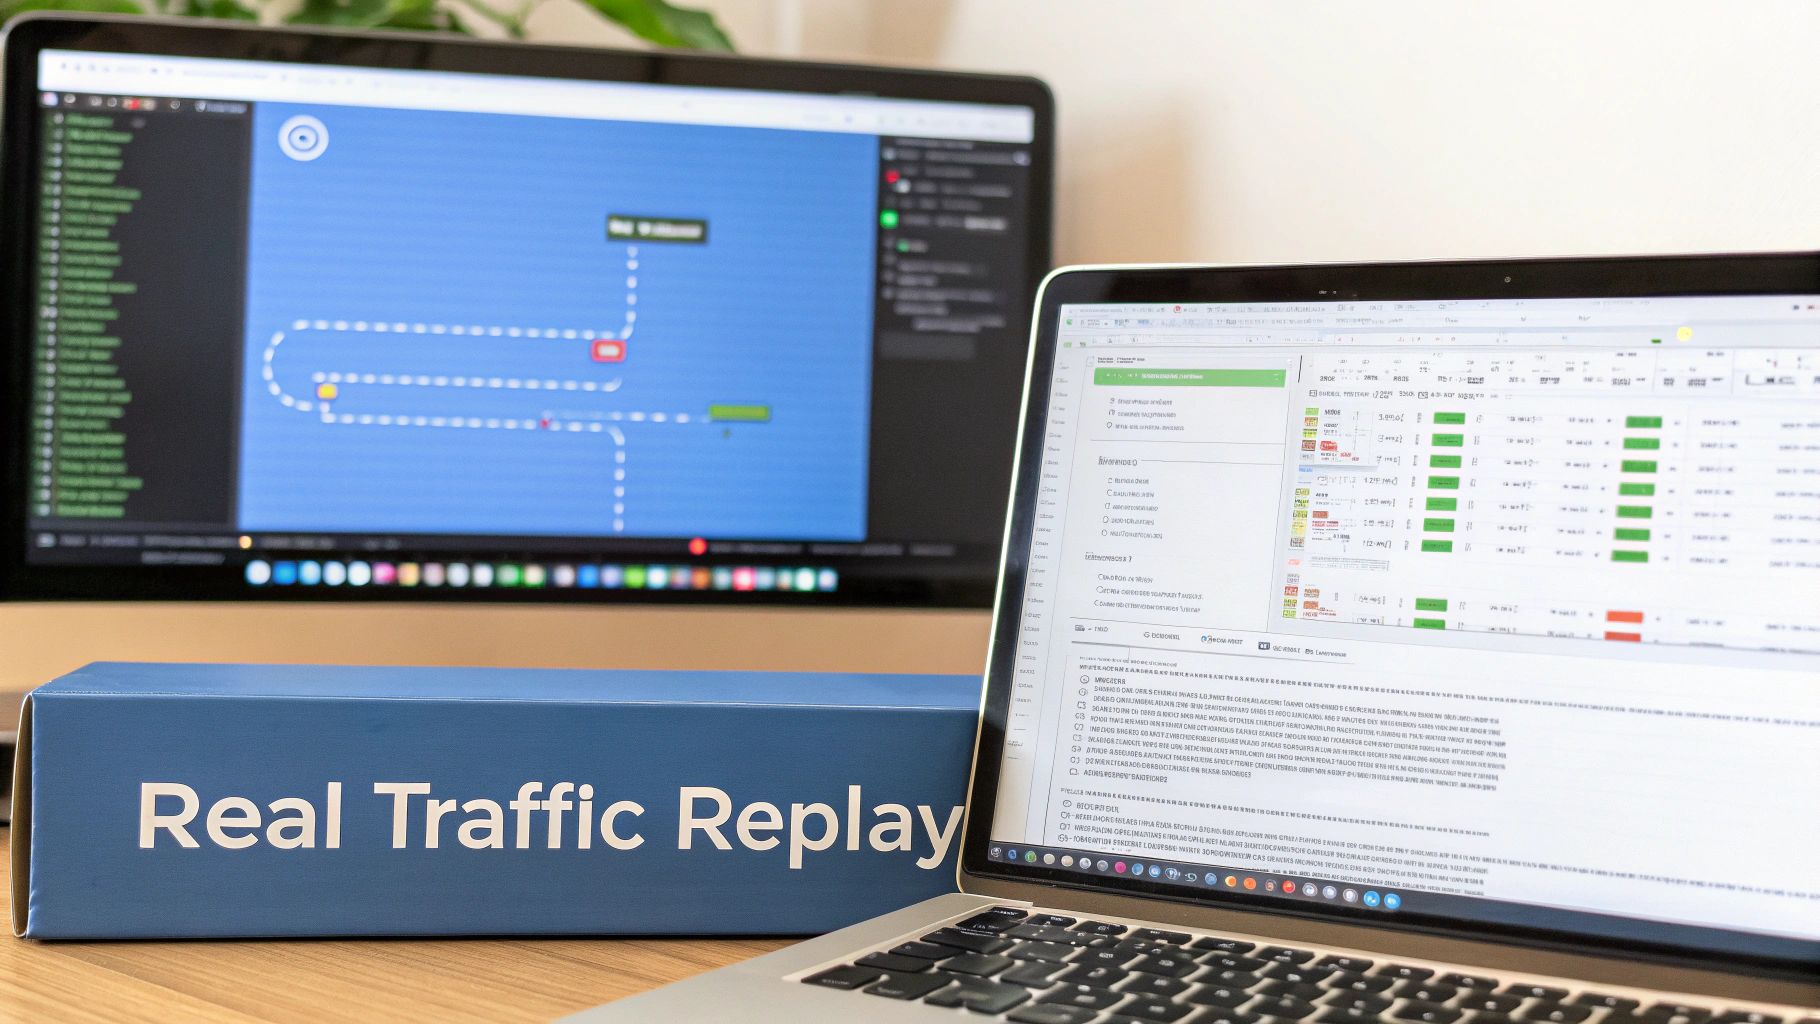
The screenshot below gives you a sense of the GoReplay interface, which provides a clear, intuitive way to manage your traffic replay sessions.
This kind of visual dashboard helps turn a flood of complex traffic data into insights you can actually act on.
Getting Started with Your First Replay
Setting up GoReplay is refreshingly straightforward. You run the gor process to listen on your production server and tell it where to forward the captured traffic—usually your staging environment’s endpoint.
Let’s walk through a basic setup.
Step 1: Installation First, you’ll need to get the GoReplay binary onto your production server. The installation is typically just a single command, with clear instructions in the official documentation.
Step 2: Capturing and Replaying Traffic
Once installed, you can start shadowing with one simple command. This tells gor to listen for traffic on port 80 and forward a copy to your staging server.
Capture traffic from port 80 and replay it to a staging server
sudo gor —input-raw :80 —output-http=“http://staging.your-app.com”
That’s it. Every request hitting your production server on port 80 is now being duplicated and sent to your staging environment in real-time. You can immediately start watching your staging server’s logs and performance metrics to see how it handles a real production load.
Key Takeaway: Traffic shadowing with GoReplay removes the guesswork from performance testing. You’re no longer simulating what you think user traffic looks like; you’re testing against what it is.
This gives you a far more accurate baseline for measuring your true transactions per second capacity. To dive deeper, check out our guide on how to replay production traffic for realistic load testing.
Basic Configuration for Accurate Results
While the basic command gets you started, you’ll want to fine-tune your setup for more controlled and repeatable tests. GoReplay has a rich set of command-line flags to customize its behavior.
Here are a few essential configurations to know:
- Rate Limiting: Don’t want to overwhelm your staging environment? You can throttle the replayed traffic. For example, you can replay traffic at 50% of the original speed to test how the system behaves under a lighter load.
- Filtering Requests: You’ll likely want to exclude certain requests, like those with sensitive user data or calls to third-party APIs (like a payment gateway) that you don’t want to hit twice. You can easily filter requests based on URL paths, headers, or HTTP methods.
- Saving and Replaying from File: Instead of replaying in real-time, you can save captured traffic to a file. This is incredibly useful for creating a standardized benchmark—a golden dataset you can run repeatedly to measure the performance impact of code changes.
By using these options, you can design sophisticated tests that move you beyond theoretical TPS calculations and into the realm of evidence-based optimization.
Advanced GoReplay Techniques for Accurate Benchmarks
Basic traffic replay is a great start, but modern applications are messy. They have user logins, multi-step shopping carts, and complex workflows that make them stateful—meaning each request depends entirely on what came before it. If you just blast this traffic at a test server without any context, you’ll get a storm of errors, not a useful transactions per second measurement.
To get a real benchmark, you have to go deeper. This means handling user sessions properly, managing replay speed to simulate different load conditions, and filtering traffic to create clean, repeatable tests. This is what separates a basic load test from a truly insightful performance analysis.
Taming Stateful Applications with Session-Aware Replay
Imagine replaying a user’s “checkout” request before their “add to cart” request. Your application would obviously reject it, creating a ton of noise in your test results. This is the classic challenge with stateful systems. GoReplay gets around this by tracking sessions, ensuring that all requests from a single user are replayed in the exact order they happened, keeping the user’s journey intact.
Maintaining session integrity is non-negotiable for getting accurate TPS numbers in most real-world apps:
- E-commerce platforms: You have to make sure a user adds an item to their cart before they try to buy it.
- SaaS applications: A user needs to be logged in before they can access their dashboard or protected data.
- Online banking: A fund transfer request has to come after a successful login and account selection.
Without this, your test environment will be flooded with application-level errors that have nothing to do with performance. These fake errors will skew your results and hide the genuine bottlenecks you’re trying to find.
Fine-Tuning Your Test with Middleware and Modifiers
The real magic of GoReplay is its extensibility. You can use middleware to intercept and modify traffic on the fly, giving you surgical control over your performance tests. This is how you solve the tricky problems and simulate a much wider range of scenarios.
For instance, you could write a simple middleware script to rewrite authorization headers. This is a common problem when replaying production traffic, since the original authentication tokens will be long expired. Your middleware can just swap in valid test tokens for each request, letting your staging environment process them without a hitch.
Key Takeaway: Middleware transforms GoReplay from a simple replay tool into a dynamic testing framework. It lets you adapt real production traffic to fit your test environment’s rules, ensuring the load you generate is both realistic and valid.
This is also where you can get creative with filtering. Maybe you need to strip out all requests containing personally identifiable information (PII) for compliance reasons, or perhaps you want to modify request headers to test a new feature behind a feature flag.
Here are a few powerful techniques you can put to use:
| Technique | Description | Use Case Example |
|---|---|---|
| Header Modification | Dynamically change HTTP headers like Authorization or User-Agent. | Replacing expired production JWTs with fresh test tokens to bypass authentication errors. |
| Rate Limiting | Throttle the replay speed using percentages or a fixed TPS limit. | Simulating a gradual traffic ramp-up or testing the system at 50% of peak load. |
| Request Filtering | Drop requests based on their path, method, or header content. | Removing all /api/payment requests to avoid hitting a third-party payment gateway during a test. |
By combining these strategies, you can design highly specific and repeatable benchmarks. It’s how you isolate variables and confidently measure how a code change or infrastructure tweak actually impacts your system’s ability to process transactions per second. This level of control is what turns performance testing from a guessing game into a reliable engineering practice.
Turning Test Results Into Performance Gains
Running a performance test with a tool like GoReplay and getting a number back is just the beginning. A metric on its own—even a critical one like transactions per second—doesn’t actually fix anything. The real work starts when you turn that data into a concrete plan for making your system better.
Think of it like a doctor diagnosing a patient. A high temperature is a clear symptom, but it doesn’t explain the illness. The doctor has to look at all the other signs to find the root cause. A low TPS is just a symptom; your job is to play detective and figure out why it’s happening.
Looking Beyond the TPS Number
A peak TPS figure tells you what your system can handle, but it doesn’t tell you why it can’t handle more. This is where the real investigation starts. To find the true bottlenecks, you need to correlate your GoReplay results with other system-level metrics.
While your replay is running, keep a close watch on these vital signs:
- CPU Utilization: Is your CPU constantly slammed at 90-100%? You’ve probably found a computation bottleneck. This points to inefficient code or processor-heavy tasks that need a second look.
- Memory Usage: A steady, unrelenting climb in memory usage is the classic signature of a memory leak. Sooner or later, this will crash your application, no matter its TPS.
- Database Response Times: Is your database the bottleneck? Check your query times and connection pool usage. A sudden spike in database latency will absolutely drag your TPS down with it.
- Network I/O: Don’t forget the connections between your services. Saturated network links or high latency can create a hidden performance ceiling that’s easy to miss.
By watching these metrics together, you can pinpoint the exact component that’s screaming for help when your TPS flatlines.
A Structured Approach to Optimization
Once you’ve spotted a bottleneck, resist the urge to start making random changes. A methodical, evidence-based approach will save you a ton of time and deliver much better results.
Here’s a simple framework to turn your analysis into action:
- Isolate the Culprit: Form a clear hypothesis based on your correlated metrics. For example, “Our TPS is capped by slow database writes, which we can see from the high disk I/O and query latency.”
- Target a Specific Fix: Propose a single, measurable change. This is not the time to refactor the entire app. A targeted fix might be as simple as adding a database index or introducing a small caching layer.
- Rerun the Benchmark: Use GoReplay to replay the exact same traffic file from your baseline test. This is critical for a true apples-to-apples comparison.
- Measure and Validate: Did it work? Compare the new TPS and system metrics to your original baseline. A successful fix will show a clear improvement in your target metric without breaking something else.
A systematic loop of Measure, Hypothesize, Fix, and Re-measure is the most effective way to drive performance gains. It transforms optimization from a chaotic guessing game into a repeatable engineering discipline.
This iterative process lets you systematically improve your system’s capacity, using hard data from realistic traffic to prove that every single change made a real difference.
Got Questions About TPS?
Navigating the world of performance testing brings up a lot of questions, especially around a core metric like transactions per second. Let’s clear up some of the most common ones.
What’s a “Good” TPS?
Honestly, there’s no magic number. A “good” TPS is completely relative. A payment processor like Visa might see peaks over 20,000 TPS, but a popular e-commerce site could be wildly successful with just a few hundred. It all comes down to your application, your users, and what you need to achieve.
The best way forward is to benchmark your current system with real-world traffic to find your baseline. From there, you can set meaningful goals. A “good” TPS is simply one that sails past your peak user demand, leaving enough breathing room to handle unexpected surges without breaking a sweat.
How Is TPS Different From RPS?
This is a classic point of confusion, but the distinction is critical. Requests Per Second (RPS) is a raw count of how many HTTP requests your server is fielding. In contrast, Transactions Per Second (TPS) measures how many complete, meaningful user actions are actually successful.
Think about it this way: a single user transaction, like booking a flight, might fire off dozens of individual requests behind the scenes. A high RPS with a low TPS is a huge red flag. It means your servers are busy spinning their wheels but aren’t actually completing the user journeys that matter.
Can I Just Throw More Hardware at the Problem to Improve TPS?
Not always. While scaling horizontally by adding more servers can certainly help if you have an infrastructure bottleneck, it’s not a silver bullet. If your performance ceiling is actually caused by sluggish software—like a poorly optimized database query or inefficient code—adding more hardware just means you’ll have more machines running that same inefficient code.
True optimization starts with finding the root cause. Sometimes the answer is better infrastructure. Other times, it’s refactoring a specific function, adding a caching layer, or tuning a database index.
Ready to stop guessing and start measuring your true TPS with real user traffic? GoReplay gives you the power to safely capture and replay production traffic for benchmarks you can actually trust. Start testing with GoReplay today.