A Guide to Testing the Internet of Things
Testing the Internet of Things isn’t just another flavor of quality assurance. It’s an entirely different beast. You’re not just verifying a single app; you’re stress-testing a whole ecosystem—the hardware, the software that lives on it, the network it talks to, and the cloud services processing its data. It’s a multi-layered discipline where every component has to work together, seamlessly and securely.
Why IoT Testing Is More Than Just QA

When you step away from traditional software QA and into testing the Internet of Things, you’re hit with a wave of unique challenges. A web app lives in a predictable digital world. An IoT product, on the other hand, is a mash-up of physical hardware and complex software that has to survive in the messy, unpredictable real world. That combination blows the doors wide open for potential failures.
Think about a smart thermostat. A typical QA process would check if the app’s interface works. But a real IoT test goes much, much deeper:
- Sensor Accuracy: Is the device actually reading the room temperature correctly?
- Hardware Durability: What happens when it’s exposed to high humidity or a sudden power surge?
- Network Resilience: If the Wi-Fi drops for 30 seconds, does it recover gracefully or just give up?
- Interoperability: Can it actually talk to the smart lights from a completely different brand like it’s supposed to?
The High Stakes of Inadequate Testing
Cutting corners here isn’t an option. A bug in a consumer gadget might just earn you a one-star review. But a failure in a connected medical device? That could have life-altering consequences. A security hole in a smart lock isn’t a data leak; it’s a physical threat. This real-world impact is what elevates IoT testing from a simple quality check to a non-negotiable business function.
The core challenge is that you’re not just testing code. You’re testing the intricate dance between hardware, firmware, network protocols, cloud services, and the app a user taps on. Each layer is its own minefield of potential failure points.
And these risks are only getting bigger as more devices come online. The IoT testing market is booming, driven by the sheer complexity of new systems popping up in every industry. With massive investments in 5G and other networks expected through 2034, the pressure to validate protocols, nail interoperability, and plug security holes is more intense than ever. You can dig into more data on the IoT testing market’s expansion to see how these trends are shaping the industry.
To manage this complexity, you need a robust, multi-faceted strategy that covers every link in the chain, from the tiny sensor on the device to the application in the user’s hand. Breaking it down into core components is the only way to ensure nothing gets missed.
Core Components of a Modern IoT Testing Strategy
A solid IoT testing plan is built on several key pillars. Each one addresses a different part of the ecosystem to ensure the entire system is reliable, secure, and performs as expected.
| Testing Component | Primary Focus | Key Objective |
|---|---|---|
| Performance Testing | System behavior under load | Ensure the backend can handle data from thousands or millions of devices without crashing. |
| Security Testing | Vulnerability identification | Protect against data breaches, unauthorized access, and device hijacking. |
| Connectivity Testing | Network protocol validation | Confirm reliable communication over Wi-Fi, Cellular, Bluetooth, or other protocols. |
| Compatibility Testing | Device interoperability | Guarantee the device works with different hardware, operating systems, and platforms. |
Covering these four areas gives you a comprehensive view of your system’s health, helping you catch critical issues before they ever reach your customers.
Building Your IoT Test Environment
An effective IoT test is only as good as the environment it’s run in. A sloppy setup gives you junk data, but a well-designed lab delivers the clean, repeatable results you need for real analysis. This is where you lay the foundation—creating a controlled space that mimics real-world conditions without ever touching your live production systems.
The absolute first thing you have to do is network segmentation. I can’t stress this enough: you must isolate your test devices from your main corporate or home network. This simple step prevents any weird experimental traffic, busted device configs, or security tests from spilling over and causing chaos. The easiest way to get this done is with a dedicated Wi-Fi router or access point running on its own subnet.
Hardware and Software Essentials
Putting together an isolated lab doesn’t have to break the bank. You can get started with just a few key pieces of gear. The whole point is to build a setup where you have total control over every single packet your IoT devices send or receive.
Here’s a practical shopping list to get you going:
- A dedicated router: An old router you have lying around is perfect, especially if you can flash it with custom firmware like OpenWrt or DD-WRT. This unlocks advanced control over traffic routing and monitoring that the stock firmware just doesn’t offer.
- A central interception point: This can be a Raspberry Pi, a small Linux box, or even a virtual machine (VM). This machine will act as your proxy, sitting right between your IoT devices and the internet so you can capture everything.
- An Ethernet switch: If you’re testing wired devices, a simple unmanaged switch is all you need to get them all connected to your test network.
- Proxy software: A tool like mitmproxy is essential. It’s a fantastic free, open-source proxy that lets you intercept, inspect, modify, and even replay HTTP/HTTPS traffic on the fly.
This setup creates a little microcosm of a real network, but it’s one where you’re the gatekeeper. It’s the only way to get a true, unfiltered picture of what a device is really doing.
Configuring Your Traffic Interception Point
Once your hardware is in place, it’s time to set it up to actually capture the traffic. The most common way to do this is by configuring your dedicated router to quietly redirect all traffic from your test devices through your central server running mitmproxy. This is often called setting up a transparent proxy.
What’s great about this method is that the devices on your test network have no idea they’re being monitored. They try to connect to the internet like normal, but your router’s custom rules invisibly funnel their communications through your proxy server. This is way more effective than trying to manually configure proxy settings on each device, especially since most IoT gadgets don’t even give you that option.
The real power of a dedicated test environment is control. By forcing all traffic through a single point you can analyze, you eliminate guesswork and capture a complete, unaltered record of how a device behaves in the wild.
Scaling Your Tests with Emulators
Physical hardware is great for getting a baseline, but what happens when you need to see how your backend handles 10,000 smart thermostats all connecting at once? You’re not going to buy that many devices. This is where simulators and emulators become absolutely critical for testing at scale.
An emulator can mimic the hardware and software of a physical device, letting you spin up thousands of virtual “devices” with minimal resources. You can then script these emulators to reproduce the exact traffic patterns you captured from a real device. This lets you run massive load tests that would be flat-out impossible otherwise, helping you find those nasty performance bottlenecks in your cloud infrastructure long before a customer ever complains about a slow product.
Get Your Hands on Real IoT Device Traffic
If you want to truly understand how your IoT ecosystem behaves, you have to see how your devices communicate in the wild. Synthetic tests are fine for a baseline, but they’re just a guess. Nothing beats capturing and analyzing the raw, live traffic coming straight from a device. This is how you build a complete digital footprint, moving past assumptions and into hard data.
This isn’t just about collecting packets; it’s about intelligence gathering. When you inspect every single request and response, you uncover the ground truth of your system’s behavior. It’s this intelligence that helps you find inefficiencies, boost performance, and spot security gaps before they turn into real problems.

Routing Traffic Through a Proxy
The most effective way to capture this data is to funnel all device communications through a proxy server that you control. Inside your isolated test environment, you can set up your dedicated router to create a transparent proxy. This trick forces every packet from your IoT devices through your central analysis server, and the best part is the devices themselves don’t need any special configuration.
This is a huge advantage. Most IoT devices are locked down and don’t offer user-accessible network settings. They just connect to Wi-Fi and expect to work. A transparent proxy intercepts all that traffic invisibly, giving you a complete, unaltered record of every connection attempt, data payload, and server response.
Peeking Inside Encrypted Communications
You’ll hit a roadblock almost immediately: encryption. A staggering 70% of all IoT devices are estimated to be vulnerable to attacks, so manufacturers (rightfully) use HTTPS/TLS to protect data on its way to the server. While great for security, this makes the traffic you just captured completely unreadable.
To get around this, you need to perform a controlled “man-in-the-middle” interception. It sounds sketchy, but in a test environment, it’s a standard practice. By installing a custom root certificate authority (CA) on your test devices, you can decrypt the traffic as it flows through your proxy.
By installing your own certificate, you’re essentially telling the device to trust your proxy as a legitimate intermediary. This allows your proxy tool, like mitmproxy, to decrypt the HTTPS traffic for inspection before re-encrypting it and sending it on to its final destination.
This is often the most hands-on part of the whole process. If a device has an accessible operating system, it’s pretty straightforward. For those locked-down “black box” devices, you might have to get creative with hardware-level techniques to get your certificate installed.
Introducing GoReplay for Traffic Recording
Once you’re capturing and decrypting traffic, you need a way to save it. This is where a tool like GoReplay becomes an absolute game-changer. It’s an open-source utility built specifically to listen to network traffic and record it to a file. Instead of just watching packets fly by in real-time, you can create a permanent, replayable record of any user scenario you want to test.
This screenshot shows the GoReplay homepage, highlighting its core capability of capturing and replaying real user traffic for robust testing.
The key takeaway here is that GoReplay bridges the gap between passive observation and active simulation. It’s what turns your captured traffic into a repeatable load test. For a deeper dive, check out this guide on how to capture network traffic and bake it into your testing workflow.
What to Look For in Captured Packets
With traffic flowing and being recorded, your job shifts to analysis. That raw data is a goldmine of information. The trick is knowing what to look for to turn that data into something you can act on.
Here are the key areas to focus on:
- API Endpoints: Pinpoint every single server URL the device talks to. Are they all documented? Are you seeing any unexpected third-party connections?
- Authentication Methods: How does the device prove it is who it says it is? Look for API keys, bearer tokens, or client certificates in the headers or body.
- Payload Formats: Check out the structure of the data being sent. Is it clean JSON, lightweight MQTT, or some custom binary format? Understanding the payload is critical for debugging and tuning.
- Communication Timing: Pay attention to how often the device sends data. A “chatty” device pinging your servers every second can drain its battery and put a serious strain on your backend.
- Security Weaknesses: Scrutinize everything for insecure practices. Are credentials or sensitive data being sent in plaintext? Any hardcoded secrets?
This detailed inspection gives you the raw material for all your subsequent testing. Every captured packet tells a story about your device’s behavior, efficiency, and security. By listening closely, you can find problems and make sure the system works exactly the way you designed it to.
Simulating Real-World Load with GoReplay
Capturing raw device traffic is a massive step forward, but the data itself is just the starting point. Its real power comes when you turn that captured history into a dynamic, repeatable test. This is where you move from passively observing to actively simulating, using the authentic device interactions you’ve recorded to push your backend systems in a controlled environment.
This process is critical for any serious effort in testing the internet of things. By replaying real scenarios, you can accurately reproduce complex bugs, validate fixes under pressure, and ensure a new software update doesn’t quietly degrade system performance. It’s the difference between guessing how your servers will react and knowing for sure.
Saving and Replaying Traffic Scenarios
First things first, you need to save that captured traffic to a file. With GoReplay, this is incredibly straightforward. While your proxy is capturing device communications, you can run a simple command in your terminal to listen to a specific network port and write everything it hears into a file.
For example, a command might look something like this:
gor --input-raw :8080 --output-file my-iot-traffic.gor
This tells GoReplay to listen for raw traffic on port 8080 and save every request and response to a file named my-iot-traffic.gor. You now have a portable, permanent record of a real device interaction.
The real magic happens when you flip this around. To replay that exact scenario against a staging server, you simply point GoReplay at your saved file and tell it where to send the traffic.
gor --input-file my-iot-traffic.gor --output-http "http://staging-server-address"
With this, you’re effectively recreating the past. GoReplay will read the requests from the file and send them to your staging environment, mimicking the original device’s behavior perfectly. You can learn more about configuring your test environment with GoReplay’s setup guide to make sure everything is routed correctly.
Manipulating Traffic for Advanced Testing
Simply replaying a scenario one-to-one is useful for regression testing, but the true value comes from manipulating the traffic to simulate different conditions. This is how you stress-test your infrastructure and find its breaking points—before your customers do.
This visual flow shows the core steps in a robust testing process, moving from discovery and scanning to eventual deployment.
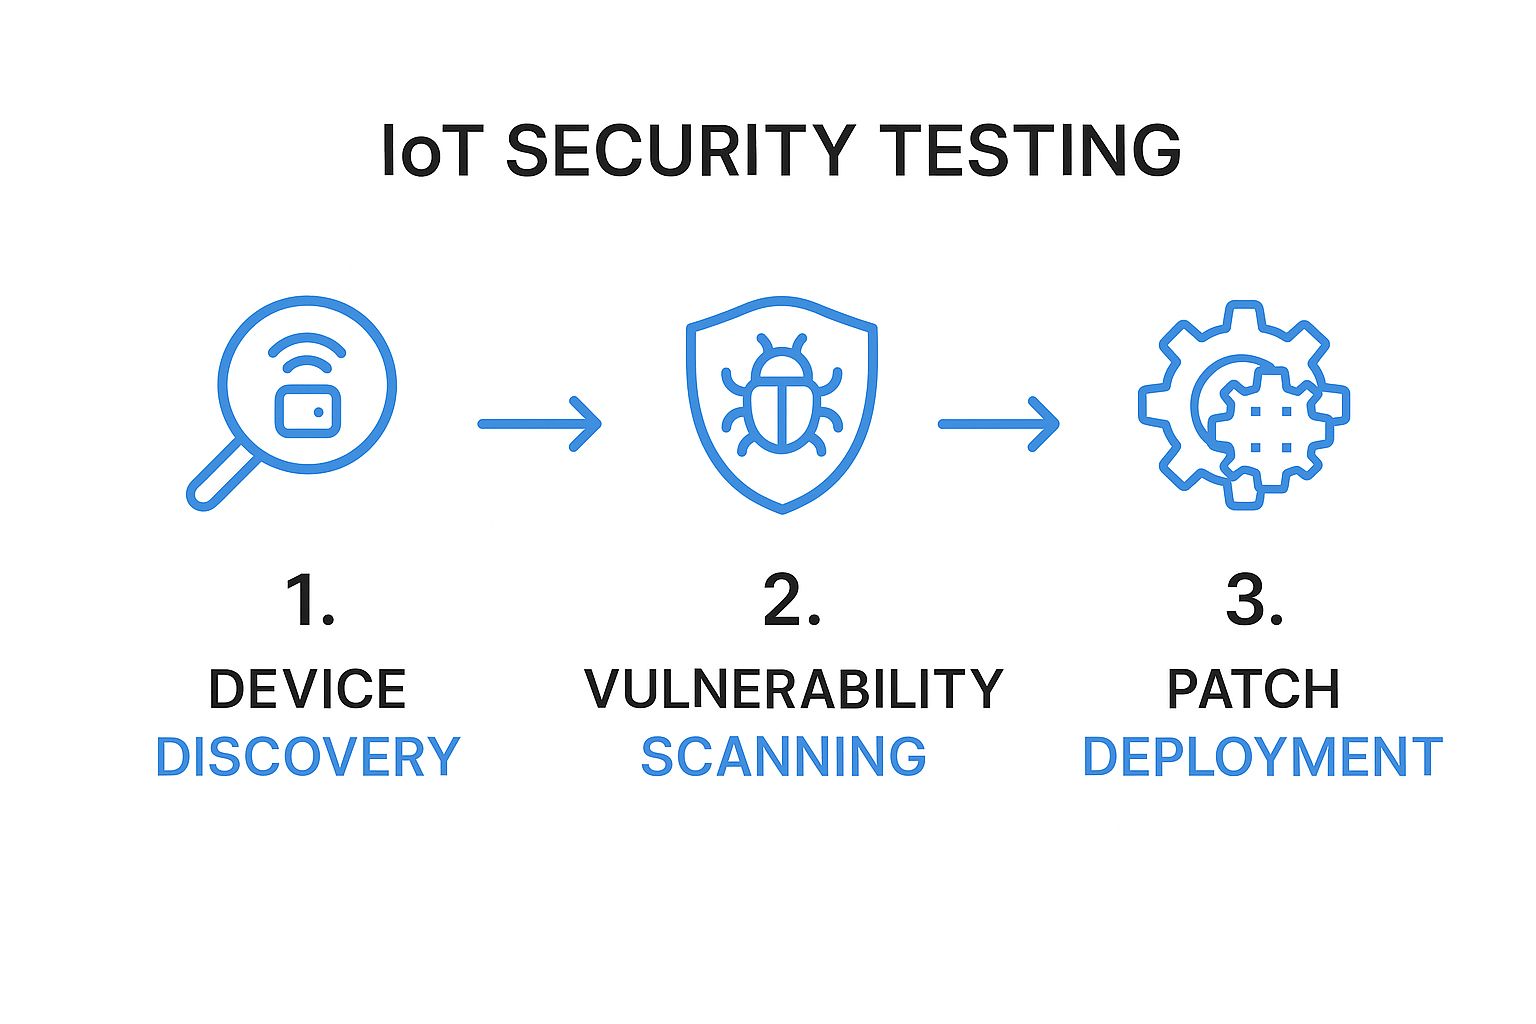
This process highlights that effective testing is a continuous cycle, not a one-time event, ensuring systems remain secure and performant over time.
You can easily modify the replay command to speed things up. Imagine you want to simulate a massive load—perhaps thousands of devices connecting simultaneously after a power outage. You can amplify the traffic rate with a simple flag.
For example, to replay traffic at 10 times the original speed:
gor --input-file my-iot-traffic.gor --output-http "http://staging-server-address|1000%"
This command unleashes a storm of requests against your server, allowing you to monitor its CPU usage, memory consumption, and response times under extreme load. It’s an incredibly efficient way to find out if your backend can handle a sudden, massive spike in activity.
A key insight I’ve learned is that most performance issues don’t appear under normal conditions. They hide until the system is under duress. Simulating these high-stress events with amplified, real-world traffic is the only way to proactively find and fix those hidden bottlenecks.
Filtering Requests to Isolate Features
Massive load tests are great for finding infrastructure limits, but sometimes you need to focus on a specific feature. Imagine you’ve just deployed a fix for a bug related to a single API endpoint, and you want to verify it without replaying hours of irrelevant traffic.
GoReplay allows for powerful filtering to isolate exactly what you need:
- Filter by URL Path: You can tell GoReplay to only replay requests that contain a specific path, like
/api/v2/firmware-update. - Filter by Header: It’s possible to isolate traffic based on headers, such as replaying only requests with a particular
User-Agentstring. - Filter by HTTP Method: You can focus exclusively on
POSTrequests to test how your system handles incoming data submissions.
This level of control turns your captured traffic into a precise surgical tool. You can build a library of different traffic files—one for device onboarding, another for routine data reporting—and use them to run highly targeted regression tests after every code change. This ensures that new features don’t inadvertently break old ones, a common and frustrating problem in complex IoT systems. By simulating real-world load with precision, you build confidence that your ecosystem is robust, scalable, and ready for whatever your users throw at it.
Analyzing Results to Find Performance Bottlenecks
You’ve run the load test, and the traffic is replaying. Easy part, done. Now for the real work: digging through the results to figure out what’s actually happening under the hood.
A successful IoT test session isn’t about just finding bugs. It’s about turning a mountain of raw data into a clear story. You need to go from a vague feeling like “the server feels slow” to a concrete, actionable diagnosis: “the /api/v1/device-status endpoint has a 300ms latency spike when database connections exceed 50.”
This is where you connect the dots. You’re watching the replayed traffic hit your system and simultaneously observing how your servers react in real-time. It’s a game of correlation—seeing how incoming requests directly impact your backend’s health. This is how you pinpoint the exact function, query, or service that’s buckling under pressure.
Key Performance Indicators to Monitor
As your GoReplay test hums along, your eyes should be glued to your backend monitoring tools. You’re looking for a specific set of key performance indicators (KPIs) that, together, paint a complete picture of your system’s health. Toggling between your server dashboard and the test output is where the “aha!” moments happen, revealing the cause-and-effect that exposes weaknesses.
Here are the vital signs I always track:
- CPU Utilization: This is your first and most obvious canary in the coal mine. If you see sustained CPU usage creeping above 80-90% during the test, your server is struggling to keep its head above water.
- Memory Usage: Watch for memory consumption that just keeps climbing without ever leveling off. That’s a classic sign of a memory leak, where resources get allocated but never released, which is a one-way ticket to an eventual crash.
- Response Latency: How long does your server take to answer a request? I pay special attention to the p95 and p99 latencies—these tell you the response times for the slowest 5% and 1% of requests. They are often the first metrics to scream that a bottleneck is forming.
- Error Rate: Keep a close watch on the percentage of server responses that are errors, like HTTP 5xx codes. If that number suddenly spikes as the load ramps up, a component is failing spectacularly.
The real magic happens when you cross-reference these KPIs. A spike in latency might be interesting, but if it happens at the exact same moment your CPU usage smacks 100%, you’ve almost certainly found a processing bottleneck.
Visualizing Data to Spot Anomalies
Let’s be honest: no one can make sense of a firehose of raw logs or numbers. The human brain is built to spot patterns and outliers visually, not in a text file. This is why using a monitoring platform with solid visualization tools—think Grafana, Datadog, or Prometheus—is absolutely non-negotiable for any serious performance analysis.
These tools turn your KPIs into time-series graphs, letting you overlay different metrics on top of each other. You could, for instance, plot the number of active device connections right on top of your database query time. When you see the query time graph shoot for the moon at the exact moment the connection count crosses a certain threshold, you’ve just visually confirmed a direct correlation. This kind of visual proof is gold. It’s not just for diagnosing the issue; it’s far more compelling when you need to write up a bug report for the dev team.
From Diagnosis to Actionable Bug Reports
Once you’ve hunted down a bottleneck, the final step is to document it so well that a developer can’t help but fix it. A great bug report is the bridge between your testing efforts and actual system improvements. It needs to be specific, reproducible, and actionable.
Here’s what every good report should contain:
- A Clear Summary: Get straight to the point. “High latency on user authentication endpoint under load.”
- Steps to Reproduce: Give them the exact GoReplay command you used, including the traffic file and any rate multipliers. This lets a developer recreate the crime scene perfectly.
- Observed vs. Expected Behavior: State what you saw versus what you expected. For example: “Observed p99 latency of 2500ms, expected under 500ms.”
- Supporting Evidence: This is crucial. Attach screenshots from your monitoring dashboard showing the correlated spikes in latency, CPU, or error rates. Visual proof shuts down any debate.
This level of detail empowers developers to squash bugs efficiently, turning your sharp analysis into tangible improvements for your entire IoT ecosystem.
Embedding Security into Your Testing Workflow

In the world of connected devices, security isn’t just another item on a final checklist. It has to be woven into the fabric of your development and testing cycles right from the start.
By shifting security left—into your QA process—you transform it from a last-minute scramble into a proactive hunt for vulnerabilities. The best part? You can use the exact same traffic-capturing techniques we’ve already covered to start finding common exploits long before a product ever gets near a customer.
This isn’t just about finding bugs. It’s about stress-testing the trustworthiness of your entire ecosystem. When you treat security as a core part of quality, you move beyond just checking if features work and start validating your system’s resilience against real-world attacks.
Hunting for Common Vulnerabilities in Captured Traffic
Those traffic files you captured? They’re a goldmine for security analysis. As you inspect the raw data flowing between a device and your backend, you can actively look for the kind of red flags that attackers dream of exploiting. This proactive inspection is a fundamental part of testing the internet of things for true robustness.
Here are a few critical vulnerabilities to keep an eye out for:
- Insecure Data Transmission: Are credentials, API keys, or personal user data being sent in plaintext? This is a cardinal sin of security, but it’s shockingly common. Every last bit of sensitive data must be encrypted.
- Weak Authentication: Take a hard look at your authentication mechanism. Is the device using a hardcoded, non-expiring bearer token? Can you snatch a token from one session and successfully use it in another?
- Hardcoded Secrets: Sometimes, developers embed secret keys or credentials right into the device’s firmware. While this won’t always show up in network traffic, it’s a massive risk you can uncover through firmware analysis.
Leveraging Replay Attacks for Resilience Testing
Capturing traffic is one thing, but using it to simulate an attack is where you really start to test your defenses. A replay attack is one of the simplest yet most effective methods an attacker can use against an IoT system. They just capture a valid command—like “unlock the door”—and replay it later to gain access.
You can simulate this exact scenario using GoReplay. Capture a legitimate request from a device, then try replaying that same request file minutes or even hours later.
Does the server accept the old command? If it does, you have a critical vulnerability. A robust system should use mechanisms like timestamps or single-use numbers (nonces) to ensure a request is only valid for a very short time, rendering replayed commands useless.
This same technique works wonders for testing how your system handles malformed data. Manually edit a captured traffic file to include unexpected or malicious payloads—think script tags to test for XSS vulnerabilities—and replay it. A resilient system will gracefully reject the bad data. A fragile one might just crash or expose a new security hole.
The threat landscape is escalating dramatically. Recent data shows that in 2025 alone, IoT devices face an average of 820,000 hacking attempts every single day—a 46% jump from the previous year. With security solutions blocking over 629 million attacks in just the first quarter of 2025, the sheer scale of the threat is undeniable. You can learn more about the evolving dangers highlighted in recent IoT hacking statistics.
Integrating security validation into your workflow isn’t just a best practice anymore; it’s a matter of survival.
IoT Testing: Your Questions Answered
As you start piecing together an IoT testing strategy, a few common questions always seem to pop up. Here are some quick, no-nonsense answers to help you navigate the tricky spots and refine your approach.
What’s the Real Difference Between IoT and Regular Software Testing?
While they both stem from the same QA roots, IoT testing is a whole different ballgame. It’s way more complex because it’s not just about the code—it’s about the messy, unpredictable marriage of hardware and software.
Regular software testing usually happens in a clean, controlled digital space. IoT testing has to account for the physical device itself, its firmware, the reliability of its network connection, and whether its sensors are even telling the truth. You’re also battling real-world chaos like spotty Wi-Fi, power outages, and interference from other devices, things you just don’t worry about with standard software.
How Can You Test an IoT Device Without the Actual Hardware?
It’s a classic problem: you need to test, but the physical devices aren’t ready, or you need to simulate thousands of them. This is where simulators and emulators become your best friends. It’s a super common and effective workaround.
A simulator is perfect for stress-testing your backend. It mimics a device’s software behavior and communication protocols, letting you blast your servers with realistic traffic from thousands of virtual devices to see what breaks. An emulator, on the other hand, digs deeper by replicating the device’s actual hardware and software environment. This is what you use when you need to get into the nitty-gritty of firmware and functional testing without having the physical unit on hand.
The trick is knowing when to use which. Simulators are for testing the cloud and scaling up. Emulators are for zeroing in on the device-specific software behavior.
What Are the Absolute Must-Test Security Items?
In the world of IoT, security isn’t just a feature; it’s everything. If you’re going to focus your efforts, hit these areas hard:
- Secure Data Transmission: Is all your data encrypted? I mean all of it—both when it’s flying across the network and when it’s sitting on a server.
- Rock-Solid Authentication: Lock down access with strong credentials and proper authorization. Don’t let just anyone talk to your devices.
- Known Vulnerability Scanning: Are you actively hunting for rookie mistakes like default passwords, open ports, or ancient, insecure libraries? You should be.
- Secure Firmware Updates: Your over-the-air (OTA) update process needs to be bulletproof. If a hacker can hijack it, it’s game over.
And don’t forget to test for replay attacks. This is where an attacker snoops on your network, grabs a valid command (like “unlock the door”), and just sends it again later. You need to make sure your system is smart enough to reject these malicious repeats.
Ready to turn real user traffic into your most powerful testing asset? GoReplay helps you capture and replay live traffic to find bugs, validate performance, and deploy with confidence. Learn more at https://goreplay.org.