Mastering GoReplay for Testing Response Time
Look, we’ve all relied on synthetic load tests. They’re a standard part of the performance testing playbook, and they’re great for getting a basic performance baseline. But let’s be honest with ourselves: they don’t tell the whole story. Not even close.
Why? Because they can’t possibly replicate the messy, unpredictable, and downright chaotic nature of real human beings interacting with your application.
Where Synthetic Load Tests Fall Short

Running a scripted load test often feels like a sterile laboratory experiment. Everything is predictable, clean, and follows a nice, neat path. It’s a good start, but it’s a far cry from the reality of your production environment.
Real users are anything but predictable. They get distracted and abandon shopping carts mid-checkout. They get frustrated and hammer the same button five times in a row. They navigate your app in ways your UX designers never dreamed of. A synthetic script just can’t account for that beautiful randomness.
The Problem with Predictable Scripts
One of the biggest weaknesses of synthetic traffic is its failure to simulate complex, multi-step user journeys with any real accuracy. A script might follow a simple path—login, search, checkout—but it completely misses the nuanced, and often illogical, sequences of actions that real people take. This means you’re blind to critical edge cases until they blow up in production.
On top of that, synthetic tests consistently struggle with:
- Sudden Traffic Spikes: They don’t replicate the “flash mob” effect that comes from a viral social media post or a wildly successful marketing campaign.
- Unexpected API Usage: Real users and third-party tools will interact with your APIs in creative—and sometimes problematic—ways that your scripts would never think of.
- Diverse Network Conditions: Your users are on everything from blazing-fast fiber to spotty 3G on a train. Most synthetic tests completely ignore the real-world impact of latency and unreliable connections.
The heart of the issue is this: synthetic tests are designed to check for the problems you already know about. The real danger always comes from the unknown issues that only surface under the pressure of genuine, chaotic user traffic.
Making the Switch to Realistic Testing
This disconnect between lab conditions and live traffic is exactly why so many engineering teams are moving toward more authentic testing methods. The industry’s growing obsession with automation highlights this need for smarter validation. The global test automation market, once valued at $15.87 billion, is projected to hit an incredible $49.9 billion by 2025 as teams ditch manual processes. You can dig into more insights on test automation trends and their explosive growth.
At the end of the day, there’s only one way to get a true measure of your application’s resilience: test it with a perfect mirror of your production traffic. It prepares you for reality, not a simulation. This is precisely where a tool like GoReplay becomes essential, bridging that critical gap between theory and real-world performance.
Before we jump into capturing and replaying traffic with GoReplay, we need to get on the same page about what we’re actually measuring. It’s tempting to just glance at an “average” response time and call it a day, but that number often hides the painful outliers that frustrate real users.
Truly effective performance analysis means digging deeper. We need to look at specific metrics that paint a complete and honest picture of your application’s health.
Moving Beyond Simple Averages
When we talk about response time, we’re really asking how quickly and efficiently our system handles requests under real-world pressure. This isn’t a single number—it’s a story told through a few key indicators.
Averages are notoriously misleading. They get skewed by a handful of lightning-fast or painfully slow requests, completely masking the typical user’s experience. This is where percentiles become your best friend.
- p50 (Median) Response Time: This is your middle-of-the-road value. If your p50 is 200ms, it means 50% of your users got a response in 200ms or less. It’s a solid baseline for what most people experience.
- p90, p95, and p99 Response Times: Now we’re getting to the good stuff. A p95 of 800ms means that while 95% of requests were faster than that, a critical 5% were slower. These upper percentiles are where the gold is—they expose the worst-case scenarios your users are hitting and are often the first canary in the coal mine for bigger performance problems.
Pay close attention to your p95 and p99 response times. A healthy-looking average can easily hide a terrible experience for a significant chunk of your users. Dialing in these upper percentiles is one of the fastest ways to boost user satisfaction.
Another crucial metric, especially from the client’s perspective, is the Time to First Byte (TTFB). This tells you exactly how long a user’s browser has to wait to get the first piece of data from your server. For a deeper dive into these core concepts, this guide on performance testing from Global App Testing is a great resource.
The Metrics That Tell the Full Story
Latency is a huge piece of the puzzle, but it’s not the only one. To get a truly holistic view of your application’s behavior, you need to track a few other indicators when you’re replaying traffic.
Here’s a quick rundown of the metrics that, when combined, give you a powerful diagnostic toolkit. They help you move from just “testing response time” to genuinely understanding your application’s performance under stress.
Essential Response Time Metrics Explained
| Metric | What It Measures | Why It Matters |
|---|---|---|
| Throughput | The number of requests your system can handle per unit of time (e.g., requests per second). | High throughput shows your system is efficient and can scale. A sudden drop during a test almost always points to a bottleneck somewhere. |
| Error Rate | The percentage of requests that result in an error (e.g., 5xx server errors or 4xx client errors). | If your error rate climbs under load, it’s a blaring alarm that your app is struggling, likely due to bugs or maxed-out resources. |
| Time to First Byte (TTFB) | The time from when a client sends a request to when it receives the very first byte of the response. | A long TTFB is a classic sign of server-side delays. Think slow database queries or complex logic that runs before any data is even sent. |
By keeping an eye on this combination of metrics, you’re setting yourself up for success. As you start replaying real traffic with GoReplay, these are the numbers that will show you exactly how your changes impact the real-world user experience.
Capturing Live Traffic Without Impacting Performance
The holy grail of performance testing is using real user traffic. But the very idea of running anything extra on a live production server is enough to make any engineer sweat. Your absolute priority is to gather data without interfering with the user experience. This is precisely where GoReplay comes in—it’s designed to be a passive listener, like a fly on the wall.
GoReplay operates at the network layer, sniffing packets as they arrive. Crucially, it doesn’t sit between your users and your application, so it adds zero latency to the request-response cycle. This means you can capture a perfect replica of your production traffic for testing response time under genuine, real-world conditions, and your users will never even know it’s there. It’s a safe, non-intrusive way to get the data you need.
Getting started is refreshingly simple. GoReplay is distributed as a single binary, which makes setup a breeze on just about any OS. Just head over to the official GitHub releases page, grab the right version for your server, and make sure the binary is executable and accessible in your system’s PATH.
Starting the Traffic Capture
Once GoReplay is installed, you can start listening in with a single command. The main idea is to point GoReplay at the right network interface and port. For example, if your application is humming along on port 8080, that’s where you’ll tell GoReplay to listen.
A basic command to capture traffic and save it to a file looks like this:
gor --input-raw :8080 --output-file requests.gor
Let’s quickly break that down:
--input-raw :8080: This tells GoReplay to listen for raw TCP traffic coming into port8080.--output-file requests.gor: This instructs GoReplay to save all the traffic it captures into a file namedrequests.gor. This file becomes your golden copy for replaying later.
One critical detail: you’ll almost always need to run this command with sudo. Capturing network packets requires elevated privileges, and without them, GoReplay won’t be able to access the network interface.
Pro Tip: If your server has multiple network interfaces, it’s a good practice to specify the exact one you want to monitor using the
--input-raw-engine-listener-addressflag. This is a great way to avoid capturing irrelevant traffic from other services and keep your data clean.
Refining Your Capture Strategy
While that basic command is a great start, real-world scenarios often call for a bit more finesse. Maybe you need to filter out noisy health checks or zero in on traffic hitting a specific API endpoint. GoReplay has a whole suite of flags to help you refine what you capture, ensuring your test data is as relevant as possible.
This visual flow shows how you can turn that raw captured traffic into solid performance insights.
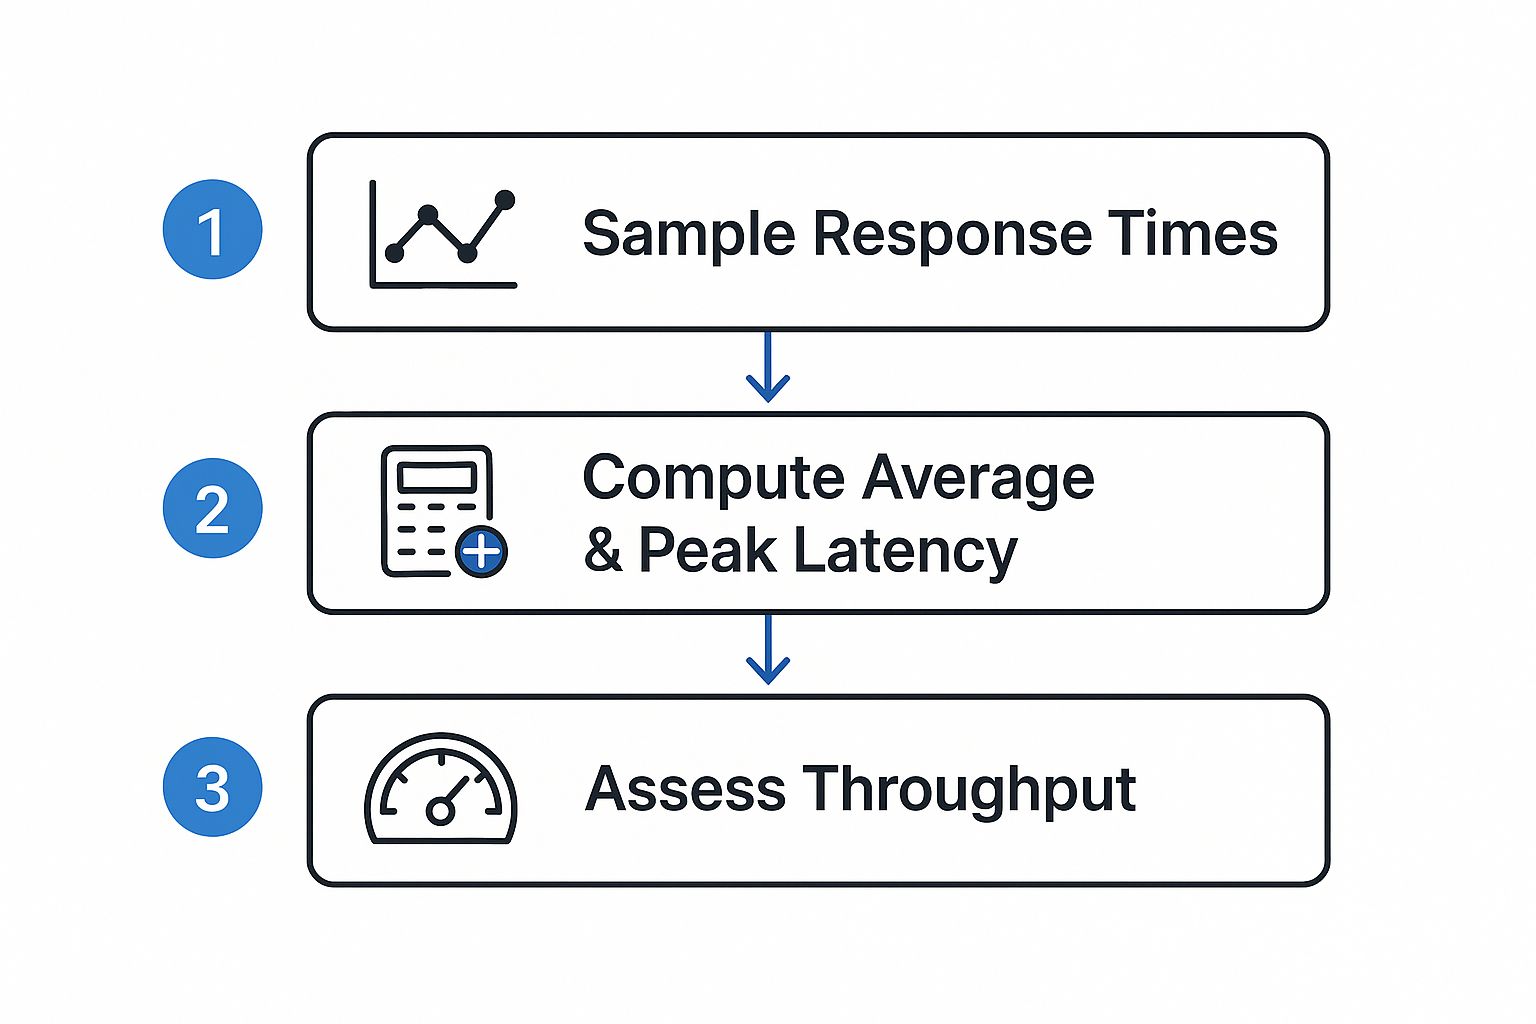
As the diagram illustrates, you process the raw response time samples to figure out key latency metrics, which then help you evaluate your system’s overall throughput.
For instance, you can use flags to control the capture rate or filter requests based on certain HTTP headers or URL paths. This level of control is what allows you to build targeted load tests that focus on the most critical—or most fragile—parts of your application. By carefully crafting your capture command, you build a high-fidelity dataset that truly reflects user behavior without putting any performance penalty on your live environment.
Replaying Traffic to Safely Stress Test Your System
Okay, so you’ve got that requests.gor file ready to go. This is where the real fun starts. You’ve captured a perfect snapshot of your production traffic, and now it’s time to unleash it on your test environment. We’re shifting from just watching traffic to actively testing response time under conditions that are as real as it gets.
The idea is to safely point all that captured traffic at a staging or development server. This lets you see exactly how your system behaves under a true production load—all without touching your live environment.
Directing Traffic to Your Test Server
First things first, you need to tell GoReplay where to send the replayed requests. Instead of letting them hit your production servers again, we’ll use the --output-http flag to redirect everything to a test endpoint. This is the most critical step for keeping your load test contained.
A basic replay command is beautifully simple:
gor --input-file requests.gor --output-http "http://staging-server.local"
This one-liner takes your saved traffic and fires it at your staging server. GoReplay replays the requests at the same speed they were originally captured, giving you a perfect one-to-one simulation of a typical day. It’s an excellent way to get a baseline and spot any performance regressions after a new deployment.
Amplifying the Load for Stress Testing
A one-to-one replay is great, but what about preparing for that big marketing campaign or a new product launch? How will your application handle a sudden traffic surge? This is where amplifying the traffic becomes a game-changer for testing response time under serious pressure.
GoReplay lets you crank up the replay speed with a simple multiplier. By adding a | and a percentage to your output flag, you can easily simulate much heavier loads.
--output-http "http://staging-server.local|200%": This replays traffic at 2x the original speed.--output-http "http://staging-server.local|1000%": This command hammers your server at 10x the original speed, simulating a massive traffic spike.
This ability to dial the intensity up or down is what makes GoReplay more than just a replay tool—it’s a powerful stress-testing machine. You can methodically increase the load to find your system’s breaking point, all while using traffic patterns that mirror actual user behavior.
By replaying genuine production traffic, you’re not just throwing random requests at your server; you’re simulating real user journeys and interactions. Our guide on how to replay production traffic for realistic load testing offers more advanced strategies on this topic.
Handling Real-World Complications
In a perfect world, you could just point and shoot. But we know reality is messier. Your staging environment might live on a different domain or use a different API path prefix than production. Thankfully, GoReplay has powerful URL rewriting capabilities to handle exactly this.
The --http-rewrite-url flag lets you modify request URLs on the fly with a simple rewrite rule.
Example Rewrite Rules:
| Flag | Original URL Path | Replayed URL Path |
|---|---|---|
--http-rewrite-url /v1/api:/v2/api | .../v1/api/users | .../v2/api/users |
--http-rewrite-url /old-path:/new-path | .../old-path/products | .../new-path/products |
This ensures that a request originally sent to /v1/api in production gets correctly routed to /v2/api in your staging environment. Without this, your replay would just be a stream of 404 Not Found errors, making the whole test useless. By mastering these replay commands, you can build incredibly accurate and demanding load tests that give you real confidence in your system’s stability.
Analyzing Results to Pinpoint Performance Bottlenecks

Capturing and replaying real traffic is a huge step, but the real work starts after the test is done. This is where you turn raw data into actionable insights, moving from simply running a test to diagnosing precisely where—and why—your application buckles under pressure.
GoReplay’s power lies in its ability to compare the original traffic against the replayed traffic. Its diffing feature gives you a side-by-side view of how your system’s responses changed, highlighting discrepancies in status codes, response times, and even payloads. This makes it painfully obvious if a new code change introduced a regression or an unexpected error.
Interpreting the Diff Output
Once you run a replay with comparison enabled, GoReplay generates a report that becomes your roadmap for investigation. Be on the lookout for a sudden spike in 5xx server errors or a major jump in your p95 or p99 response times. These are the classic red flags that signal a bottleneck screaming for attention.
For instance, you might see that while most endpoints are fine, your /api/v1/user/profile endpoint now has a 200% higher response time in the replayed test. Just like that, you know exactly where to start digging.
By comparing the “before” and “after” snapshots of your system’s performance, you get undeniable proof of how your changes impact stability and speed. It removes the guesswork from testing response time and replaces it with hard data.
Integrating with Observability Platforms
While GoReplay’s built-in diffing is powerful on its own, you can unlock a whole new level of analysis by pairing it with an observability platform like Grafana, Prometheus, or DataDog. This is how you connect the dots between slow responses and their root causes.
This integration is what helps you go from knowing what is slow to understanding why it’s slow. Suddenly, you can see that a spike in API latency during a replay test corresponds directly with a spike in database CPU or memory pressure on a specific microservice. It’s a game-changer.
From Numbers to Actionable Insights
Once you’ve zeroed in on a slow endpoint, the real detective work begins. The goal is to isolate the specific code or infrastructure component causing the delay. From my experience, the culprits are often found in a few common areas:
- Inefficient Database Queries: A slow API is often a symptom of an unoptimized SQL query. These issues love to hide until you hit them with the concurrent load of a realistic replay test.
- Slow Third-Party API Calls: If your service depends on external APIs, their performance is your performance. A replay test will quickly show you if a downstream dependency is your bottleneck.
- CPU-Intensive Operations: Complex calculations, data serialization, or just plain inefficient algorithms can chew through CPU cycles, adding latency to every request.
By consistently running these realistic tests with GoReplay, you build a solid foundation for continuous performance optimization. For a deeper dive, check out our guide on boosting application performance through effective load testing. This process turns testing response time from a reactive chore into a proactive strategy for building faster, more reliable software.
GoReplay FAQs: Your Top Questions Answered
As you start working with GoReplay, a few common questions always pop up, especially around security, performance, and handling real-world traffic quirks. Let’s tackle them head-on, drawing from what we see most often in the field.
Can GoReplay Handle Encrypted Traffic?
Absolutely. GoReplay is built to handle encrypted HTTPS traffic, but there’s a small catch. Since the data is encrypted, GoReplay needs a way to peek inside to understand the requests it’s replaying.
You’ll need to provide the server’s private key when you start capturing traffic. This is usually done with a simple command-line flag. Without that key, GoReplay can still see the encrypted packets fly by, but it can’t inspect or modify them, which is where the real magic happens for most testing scenarios.
How Do I Protect Sensitive User Data?
This is a big one. Replaying production traffic is powerful, but it comes with a huge responsibility: protecting user data. You absolutely cannot let things like passwords, API keys, or any other personally identifiable information (PII) leak into your test environments.
Fortunately, GoReplay has powerful middleware and rewriting features designed for exactly this. You can set up rules to find and replace sensitive data on the fly. For instance, you could use a regular expression to spot a field like "password": "some-secret" and instantly swap it with "password": "REDACTED". The modified request is what hits your staging server, keeping the original data safe while preserving the realistic structure of the request.
Key Takeaway: Data sanitization is not optional; it’s a critical step. Always use GoReplay’s filtering and rewriting features to scrub sensitive information from your traffic before replaying it in any non-production environment.
Will GoReplay Impact Production Performance?
This is probably the most critical question, and the answer gets to the heart of GoReplay’s design. It was engineered from day one to be incredibly lightweight.
Instead of sitting in the middle of your request-response cycle, GoReplay acts like a passive listener, “sniffing” network packets from the sidelines. It never adds latency to your live traffic. Of course, any process running on a server uses some CPU and memory, but GoReplay’s footprint is so small it’s practically negligible. This makes it a safe bet for capturing traffic even from your busiest production servers without your users ever noticing.
Ready to start testing response time with the same traffic your users generate? With GoReplay, you can capture and replay live HTTP traffic to safely load test your applications, find bottlenecks, and deploy with confidence. Learn more and get started at https://goreplay.org.